| Param | Original file | Final file |
|---|---|---|
| Filename | modeM0/AS1G05_253T03_9000000562_04478cztM0_level2.evt | modeM0/AS1G05_253T03_9000000562_04478cztM0_level2_quad_clean.evt |
| Size (bytes) | 32,454,720 | 5,011,200 |
| Size | 31.0 MB | 4.8 MB |
| Events in quadrant A | 236,197 | 27,813 |
| Events in quadrant B | 247,215 | 30,183 |
| Events in quadrant C | 236,142 | 30,938 |
| Events in quadrant D | 228,570 | 22,602 |
| Mode SS | |||
|---|---|---|---|
| Quadrant | BADHDUFLAG | Total packets | Discarded packets |
| A | 0 | 128 | 114 |
| B | 0 | 129 | 123 |
| C | 0 | 122 | 106 |
| D | 0 | 123 | 117 |
| Mode M9 | |||
|---|---|---|---|
| Quadrant | BADHDUFLAG | Total packets | Discarded packets |
| A | 0 | 6 | 5 |
| B | 0 | 3 | 2 |
| C | 0 | 3 | 2 |
| D | 0 | 2 | 2 |
| Mode M0 | |||
|---|---|---|---|
| Quadrant | BADHDUFLAG | Total packets | Discarded packets |
| A | 0 | 14351 | 13377 |
| B | 0 | 12716 | 11691 |
| C | 0 | 12643 | 11638 |
| D | 0 | 16070 | 15154 |
| Quadrant | Total seconds | Saturated seconds | Saturation percentage |
|---|---|---|---|
| A | 453 | 13 | 2.869757% |
| B | 479 | 19 | 3.966597% |
| C | 477 | 5 | 1.048218% |
| D | 393 | 8 | 2.035623% |
Noise dominated data is calculated using 1-second bins in cleaned event files. If a bin has >2000 counts, and if more than 50% of those come from <1% of pixels, then it is considered to be noise-dominated and hence unusable.
| Quadrant | # 1 sec bins | Bins with >0 counts | Bins with >2000 counts | High rate bins dominated by noise | Noise dominated (total time) | Noise dominated (detector-on time) | Marked lightcurve |
|---|---|---|---|---|---|---|---|
| A | 7111 | 657 | 0 | 0 | 0.00% | 0.00% |  |
| B | 7101 | 711 | 0 | 0 | 0.00% | 0.00% | 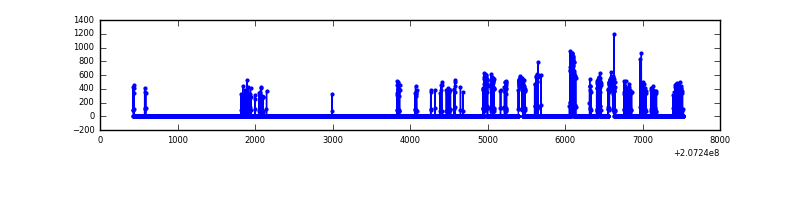 |
| C | 7144 | 718 | 0 | 0 | 0.00% | 0.00% | 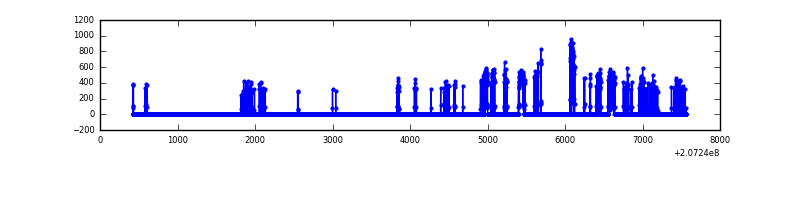 |
| D | 7088 | 582 | 1 | 1 | 0.01% | 0.17% | 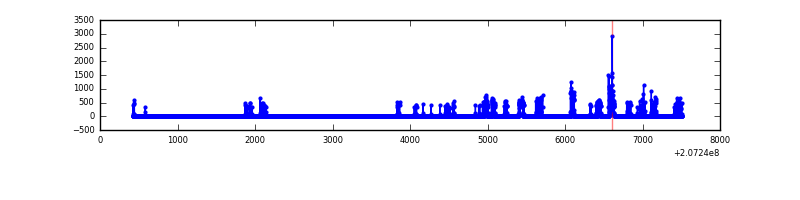 |
Top three noisy pixels from each quadrant. If the there are fewer than three noisy pixels in the level2.evt file, extra rows are filled as -1
| Pixel properties | Quadrant properties | ||||||
|---|---|---|---|---|---|---|---|
| Quadrant | DetID | PixID | Counts | Sigma | Mean | Median | Sigma |
| A | 0 | 13 | 3587 | 244.41 | 59 | 57 | 14.4 |
| A | 0 | 118 | 2984 | 202.66 | 59 | 57 | 14.4 |
| A | 15 | 174 | 1563 | 104.27 | 59 | 57 | 14.4 |
| B | 15 | 204 | 3796 | 260.78 | 61 | 60 | 14.3 |
| B | 4 | 80 | 1680 | 113.08 | 61 | 60 | 14.3 |
| B | 15 | 54 | 1409 | 94.16 | 61 | 60 | 14.3 |
| C | 8 | 128 | 765 | 43.76 | 59 | 59 | 16.1 |
| C | 13 | 61 | 434 | 23.24 | 59 | 59 | 16.1 |
| C | 14 | 48 | 422 | 22.5 | 59 | 59 | 16.1 |
| D | 13 | 235 | 14619 | 1040.38 | 49 | 47 | 14.0 |
| D | 14 | 34 | 12541 | 892.02 | 49 | 47 | 14.0 |
| D | 8 | 112 | 7650 | 542.82 | 49 | 47 | 14.0 |
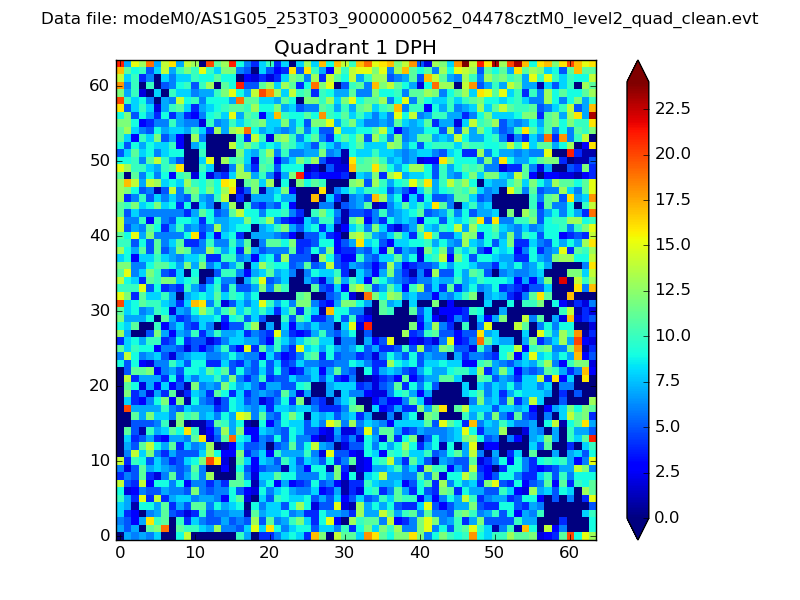
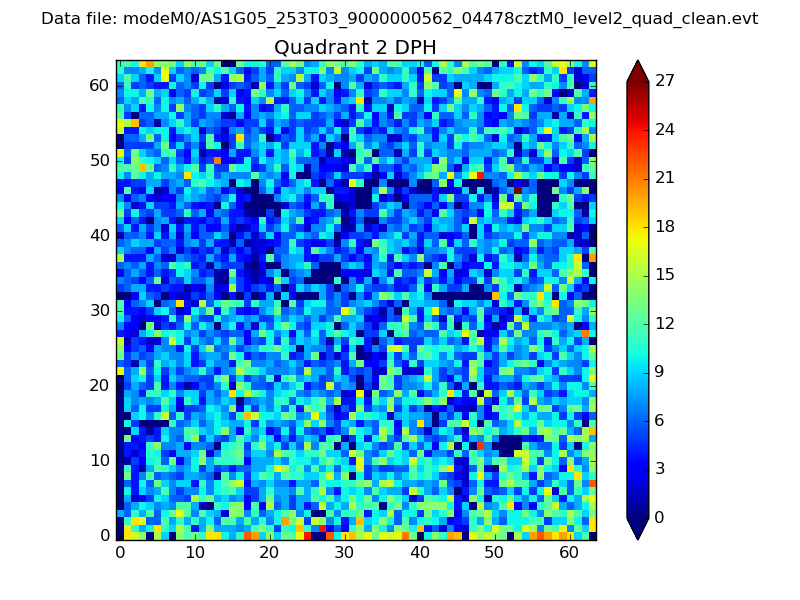
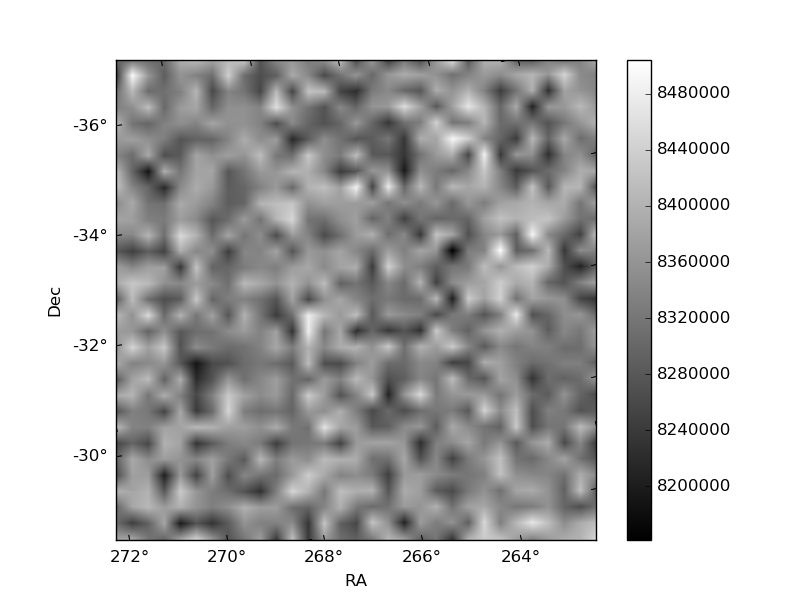
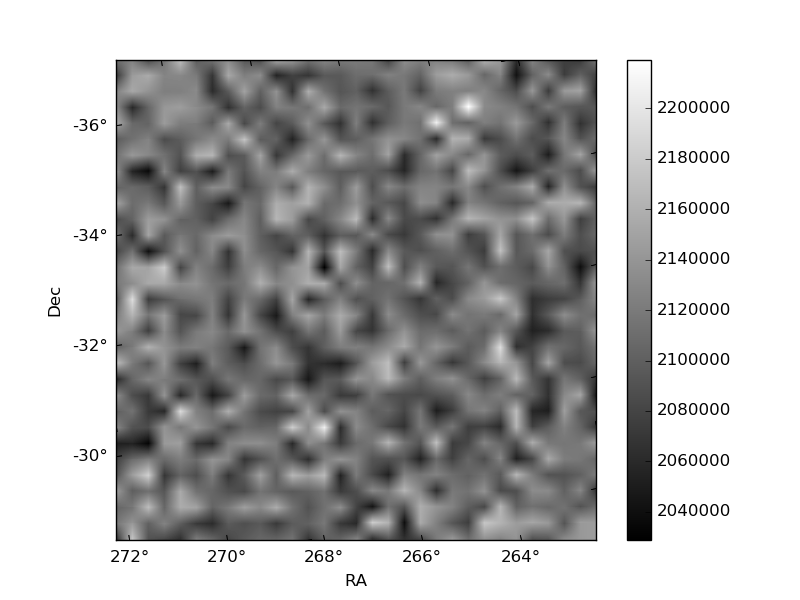
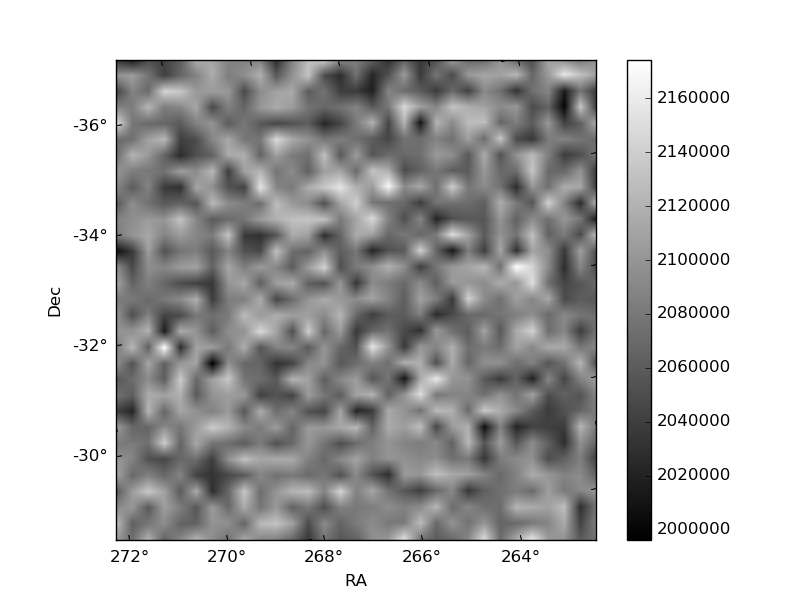
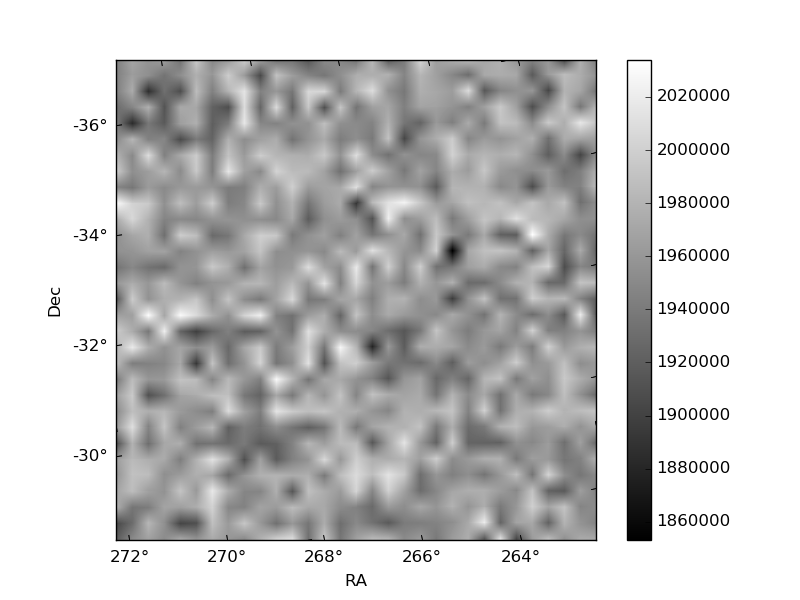
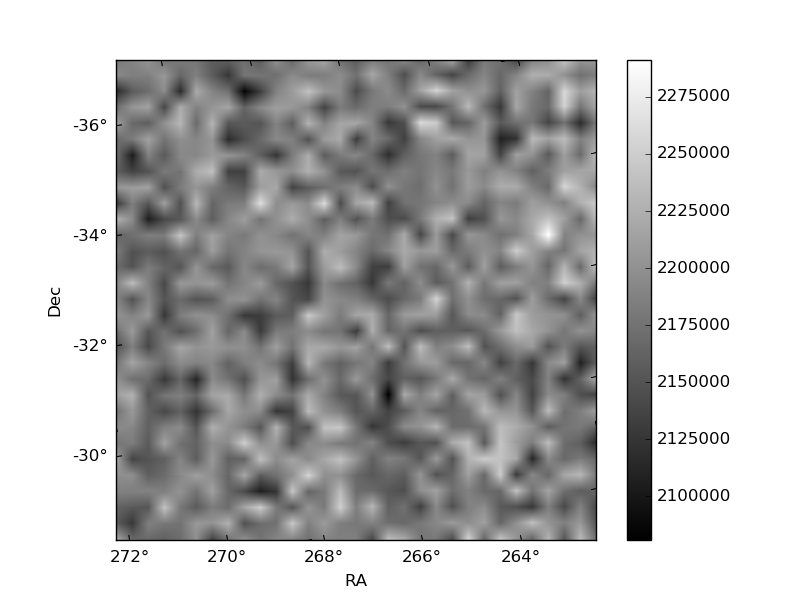
Histogram calculated using DETX and DETY for each event in the final _common_clean file
| Quadrant A | 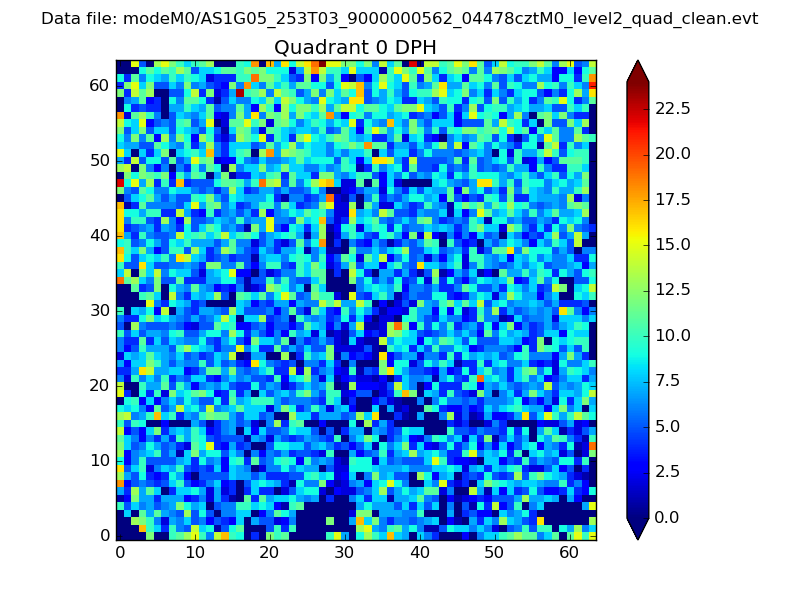 |
 |
Quadrant B |
|---|---|---|---|
| Quadrant D | 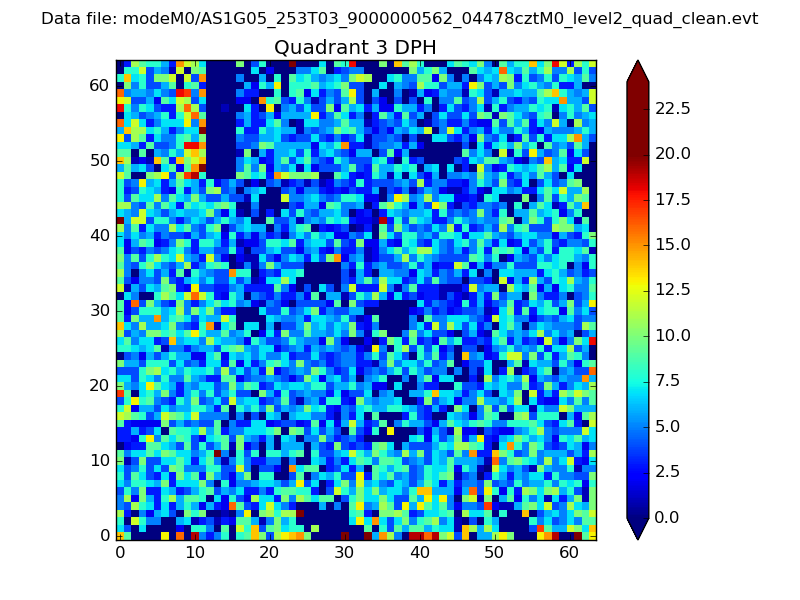 |
 |
Quadrant C |
| Plot type | Count rate plots | Images |
|---|---|---|
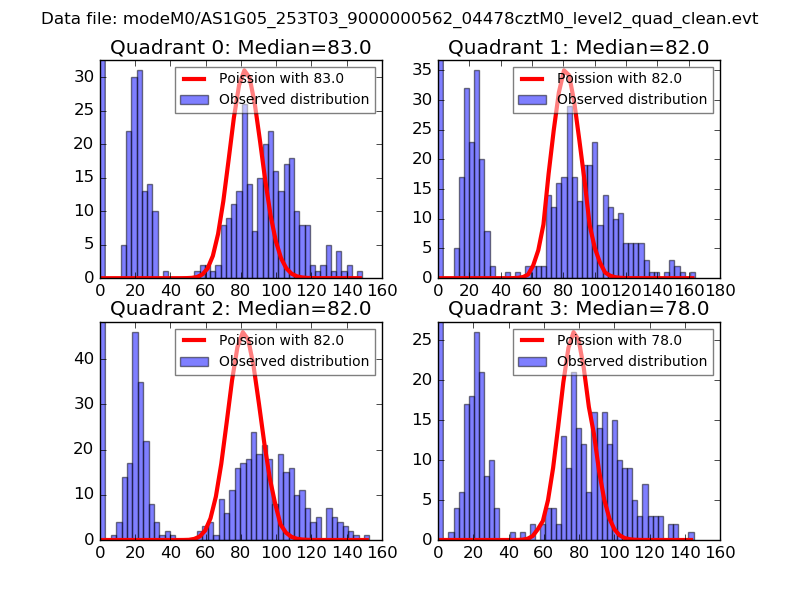
| Comparison with Poisson distribution Blue bars denote a histogram of data divided into 1 sec bins. Red curve is a Poisson curve with rate = median count rate of data. |
 |
 |
| Quadrant-wise count rates Data is divided into 100 sec bins |
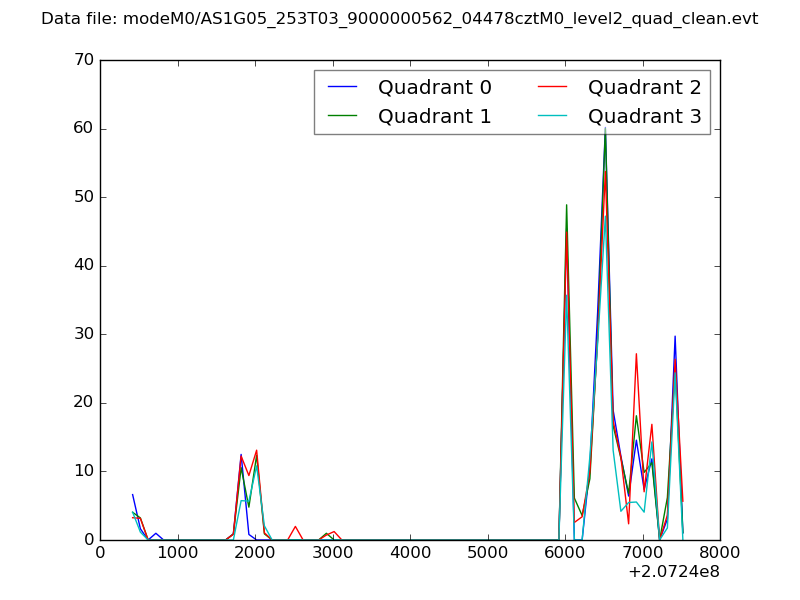 |
|
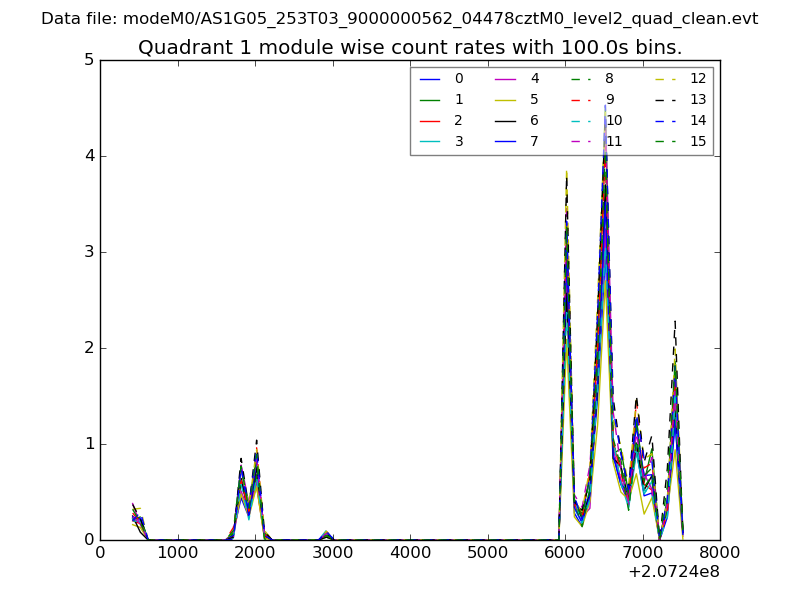
| Module-wise count rates for Quadrant A Data is divided into 100 sec bins |
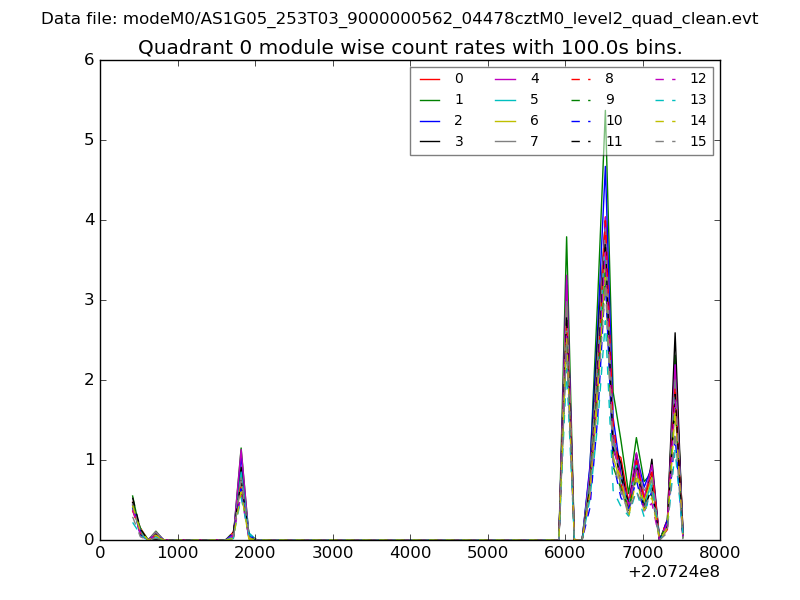 |
 |
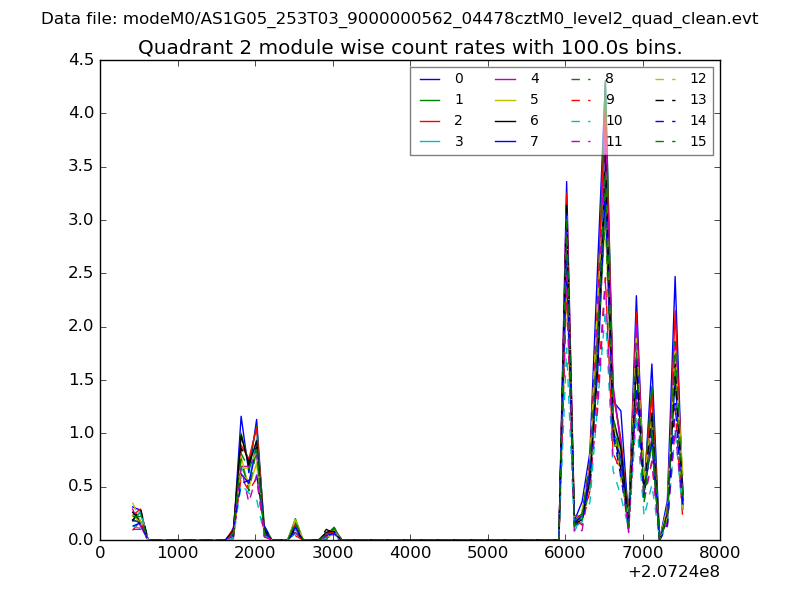
| Module-wise count rates for Quadrant B Data is divided into 100 sec bins |
 |
 |
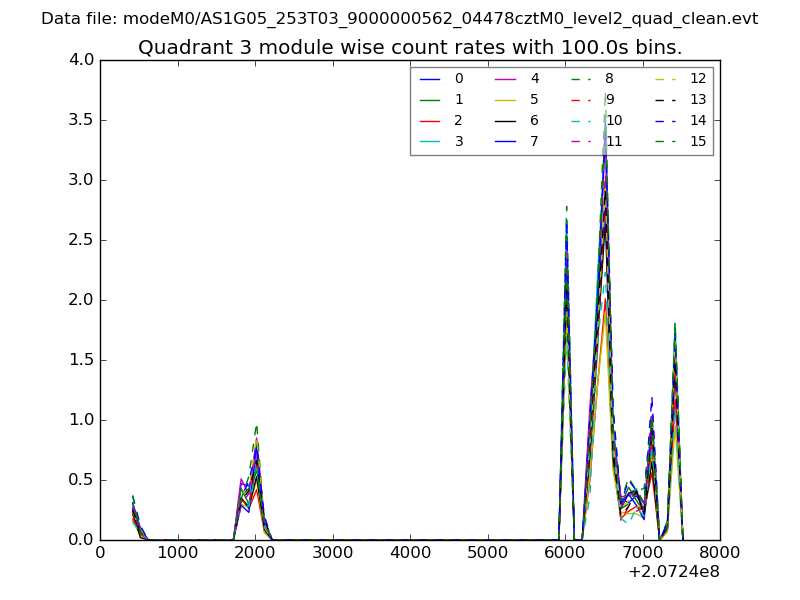
| Module-wise count rates for Quadrant C Data is divided into 100 sec bins |
 |
 |
| Module-wise count rates for Quadrant D Data is divided into 100 sec bins |
 |
 |
| Parameter | Plot |
|---|---|
| CZT HV Monitor | 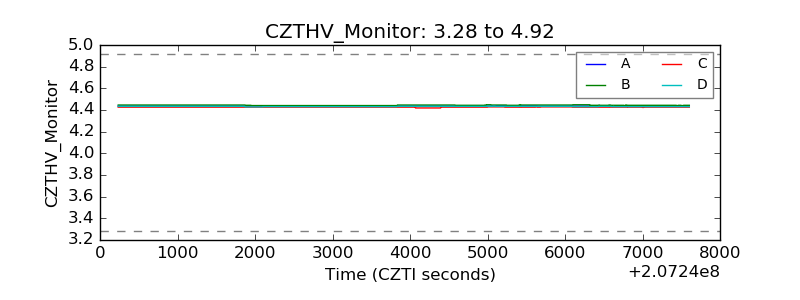 |
| D_VDD | 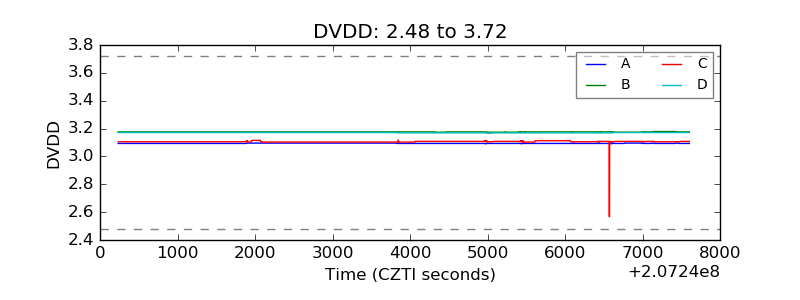 |
| Temperature 1 | 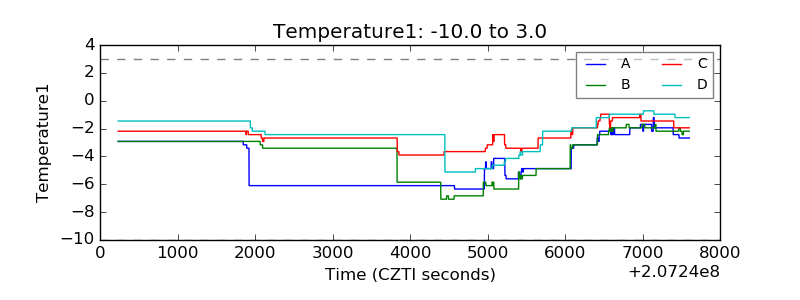 |
| Veto HV Monitor | 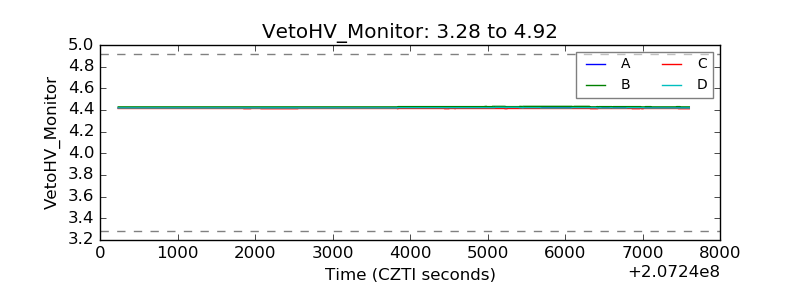 |
| Veto LLD | 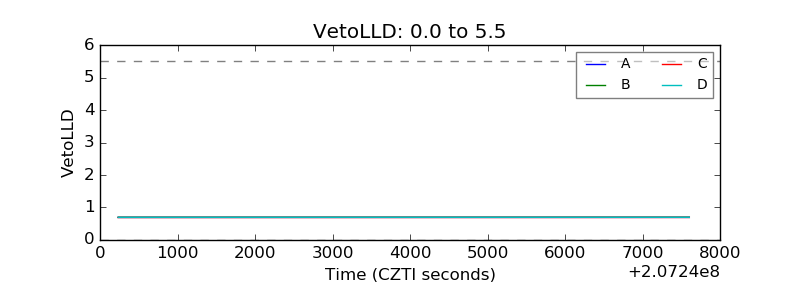 |
| Alpha Counter | 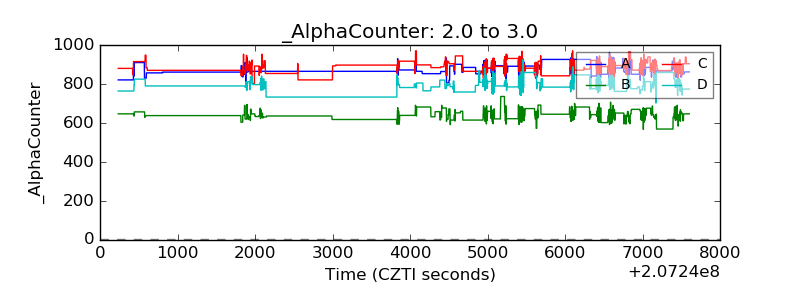 |
| _CPM_Rate | 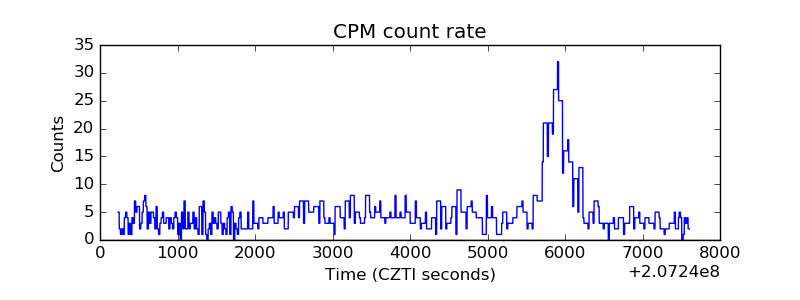 |
| CZT Counter | 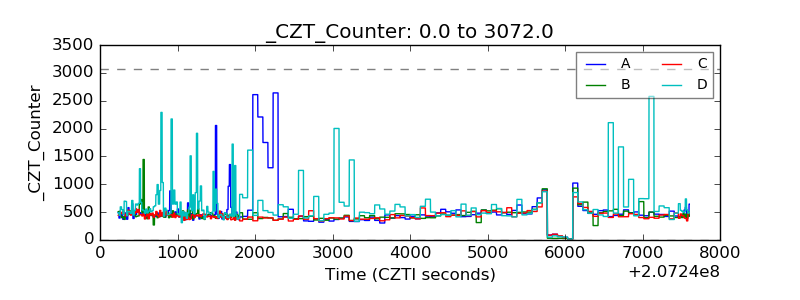 |
| +2.5 Volts monitor | 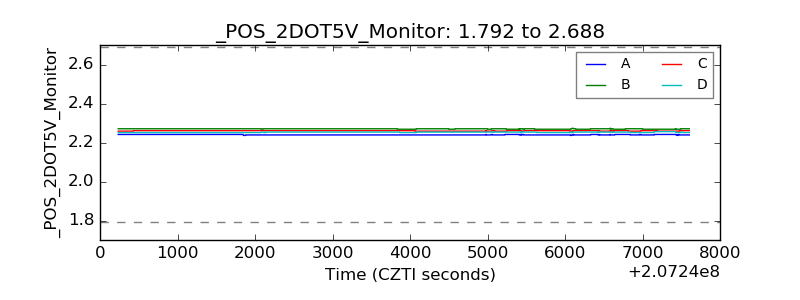 |
| +5 Volts monitor | 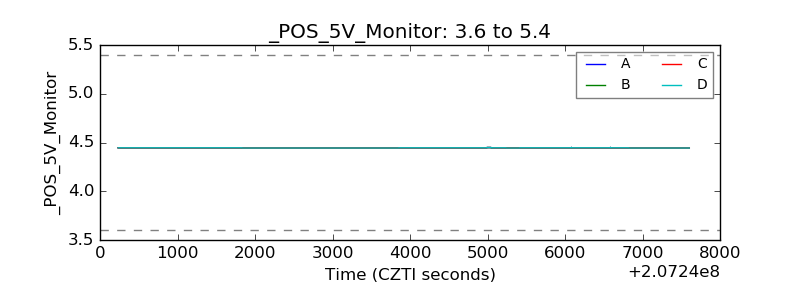 |
| _ROLL_ROT | 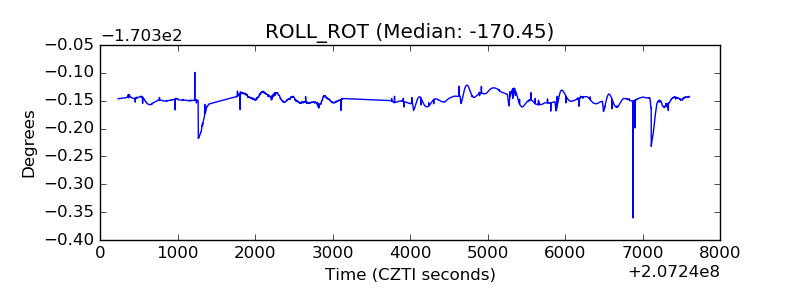 |
| _Roll_DEC | 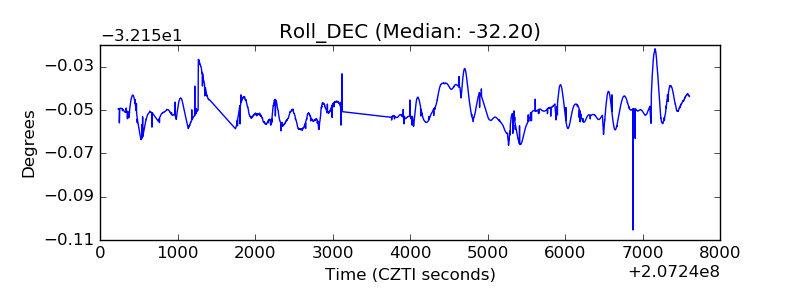 |
| _Roll_RA | 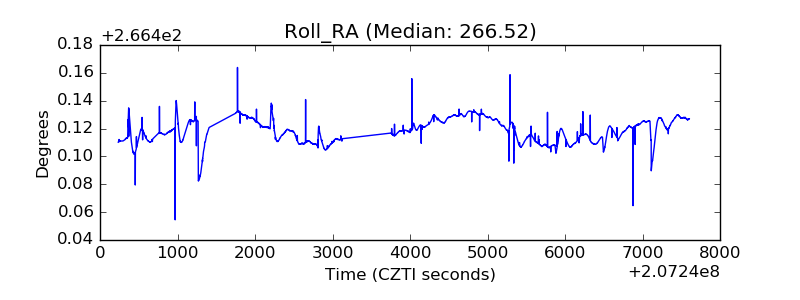 |
| Veto Counter | 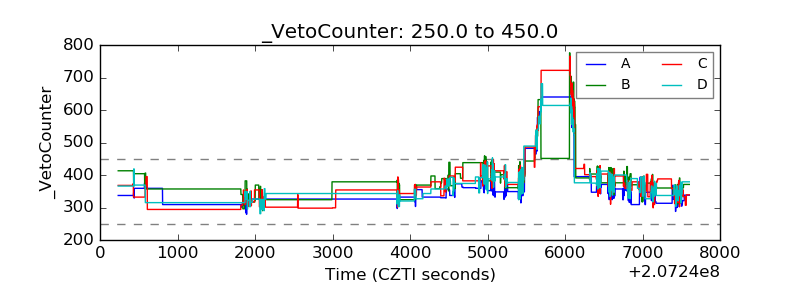 |