| Param | Original file | Final file |
|---|---|---|
| Filename | modeM0/AS1G05_253T03_9000000562_04481cztM0_level2.evt | modeM0/AS1G05_253T03_9000000562_04481cztM0_level2_quad_clean.evt |
| Size (bytes) | 968,515,200 | 141,655,680 |
| Size | 923.6 MB | 135.1 MB |
| Events in quadrant A | 6,826,003 | 828,271 |
| Events in quadrant B | 6,942,769 | 831,045 |
| Events in quadrant C | 6,504,648 | 835,775 |
| Events in quadrant D | 8,074,223 | 791,682 |
| Mode SS | |||
|---|---|---|---|
| Quadrant | BADHDUFLAG | Total packets | Discarded packets |
| A | 0 | 298 | 8 |
| B | 0 | 298 | 4 |
| C | 0 | 298 | 2 |
| D | 0 | 298 | 0 |
| Mode M9 | |||
|---|---|---|---|
| Quadrant | BADHDUFLAG | Total packets | Discarded packets |
| A | 0 | 23 | 0 |
| B | 0 | 23 | 0 |
| C | 0 | 23 | 0 |
| D | 0 | 23 | 0 |
| Mode M0 | |||
|---|---|---|---|
| Quadrant | BADHDUFLAG | Total packets | Discarded packets |
| A | 0 | 30886 | 425 |
| B | 0 | 30862 | 520 |
| C | 0 | 30159 | 469 |
| D | 0 | 34850 | 627 |
| Quadrant | Total seconds | Saturated seconds | Saturation percentage |
|---|---|---|---|
| A | 14562 | 104 | 0.714188% |
| B | 14513 | 111 | 0.764832% |
| C | 14526 | 31 | 0.213410% |
| D | 14517 | 255 | 1.756561% |
Noise dominated data is calculated using 1-second bins in cleaned event files. If a bin has >2000 counts, and if more than 50% of those come from <1% of pixels, then it is considered to be noise-dominated and hence unusable.
| Quadrant | # 1 sec bins | Bins with >0 counts | Bins with >2000 counts | High rate bins dominated by noise | Noise dominated (total time) | Noise dominated (detector-on time) | Marked lightcurve |
|---|---|---|---|---|---|---|---|
| A | 16929 | 14749 | 24 | 24 | 0.14% | 0.16% | 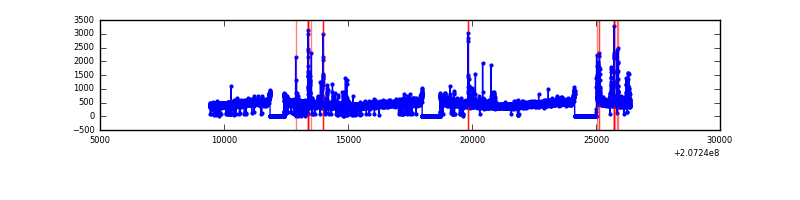 |
| B | 16928 | 14744 | 16 | 16 | 0.09% | 0.11% |  |
| C | 16929 | 14746 | 7 | 7 | 0.04% | 0.05% | 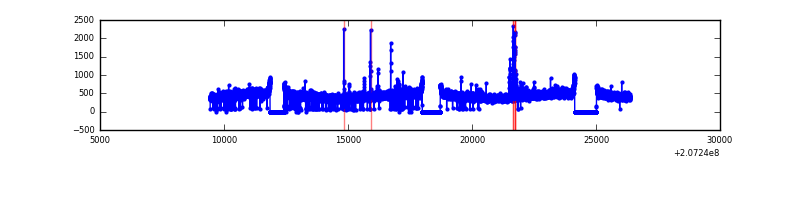 |
| D | 16929 | 14745 | 147 | 147 | 0.87% | 1.00% |  |
Top three noisy pixels from each quadrant. If the there are fewer than three noisy pixels in the level2.evt file, extra rows are filled as -1
| Pixel properties | Quadrant properties | ||||||
|---|---|---|---|---|---|---|---|
| Quadrant | DetID | PixID | Counts | Sigma | Mean | Median | Sigma |
| A | 0 | 118 | 232197 | 677.95 | 1674 | 1637 | 340.1 |
| A | 15 | 234 | 65208 | 186.93 | 1674 | 1637 | 340.1 |
| A | 0 | 226 | 38760 | 109.16 | 1674 | 1637 | 340.1 |
| B | 4 | 48 | 87863 | 263.29 | 1696 | 1655 | 327.4 |
| B | 14 | 167 | 85440 | 255.89 | 1696 | 1655 | 327.4 |
| B | 15 | 204 | 69830 | 208.21 | 1696 | 1655 | 327.4 |
| C | 9 | 54 | 94468 | 244.3 | 1631 | 1639 | 380.0 |
| C | 9 | 16 | 24012 | 58.88 | 1631 | 1639 | 380.0 |
| C | 13 | 61 | 13358 | 30.84 | 1631 | 1639 | 380.0 |
| D | 13 | 235 | 743038 | 1908.77 | 1605 | 1561 | 388.5 |
| D | 14 | 34 | 484345 | 1242.82 | 1605 | 1561 | 388.5 |
| D | 12 | 79 | 337974 | 866.02 | 1605 | 1561 | 388.5 |
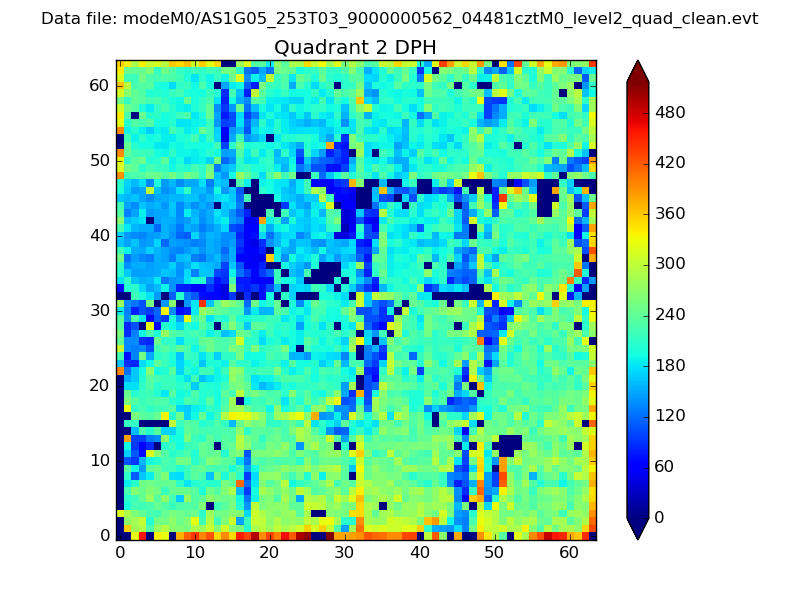
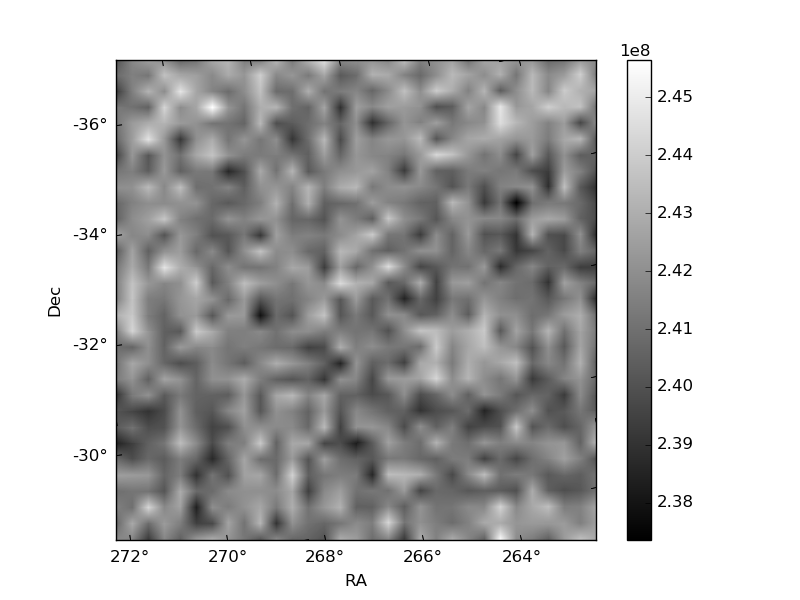
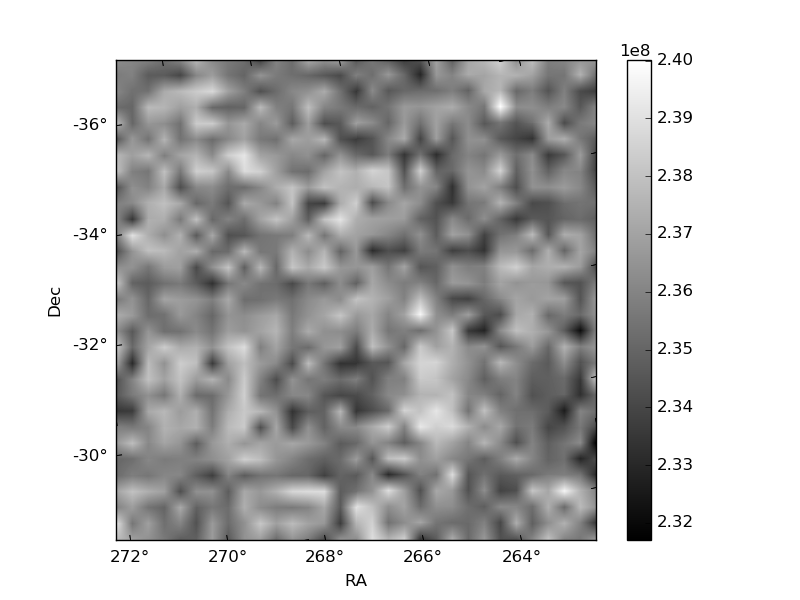
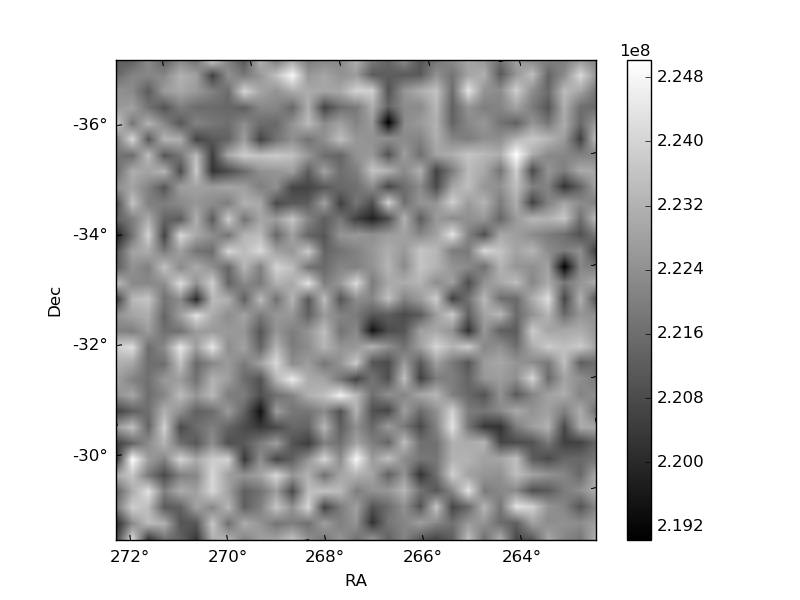
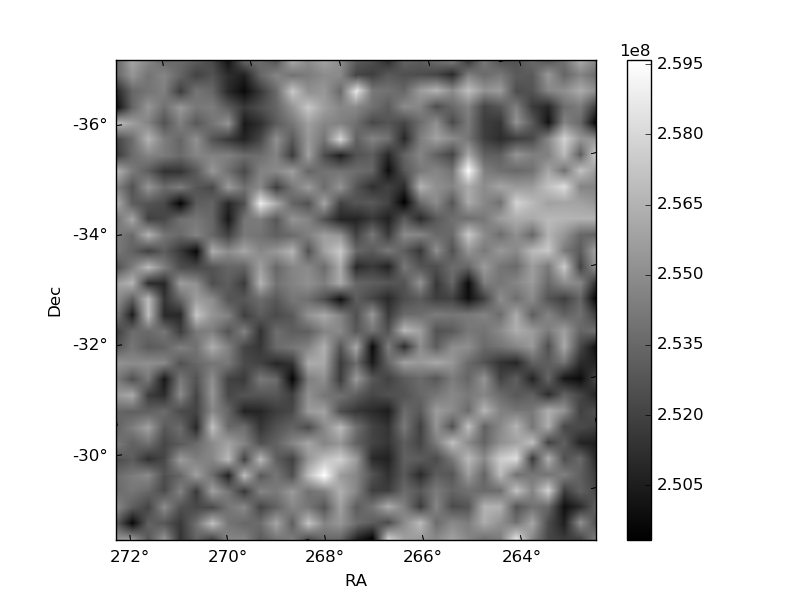
Histogram calculated using DETX and DETY for each event in the final _common_clean file
| Quadrant A | 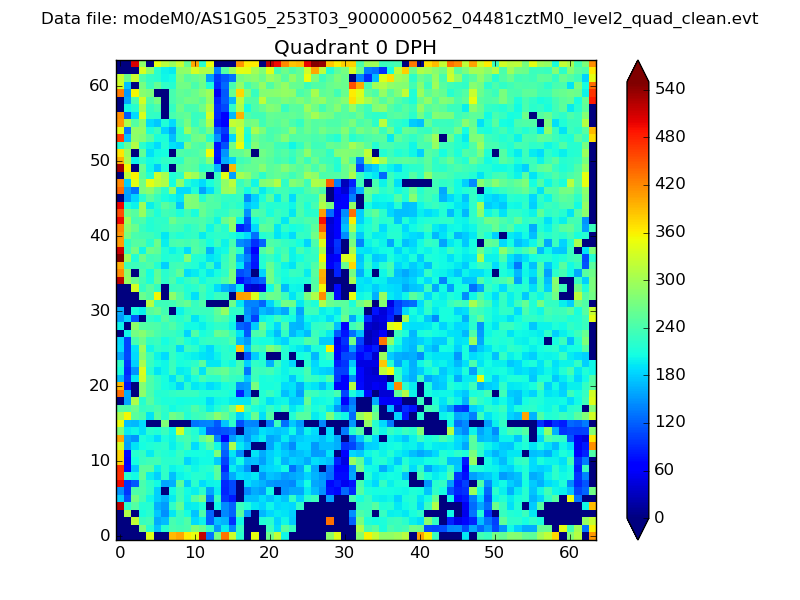 |
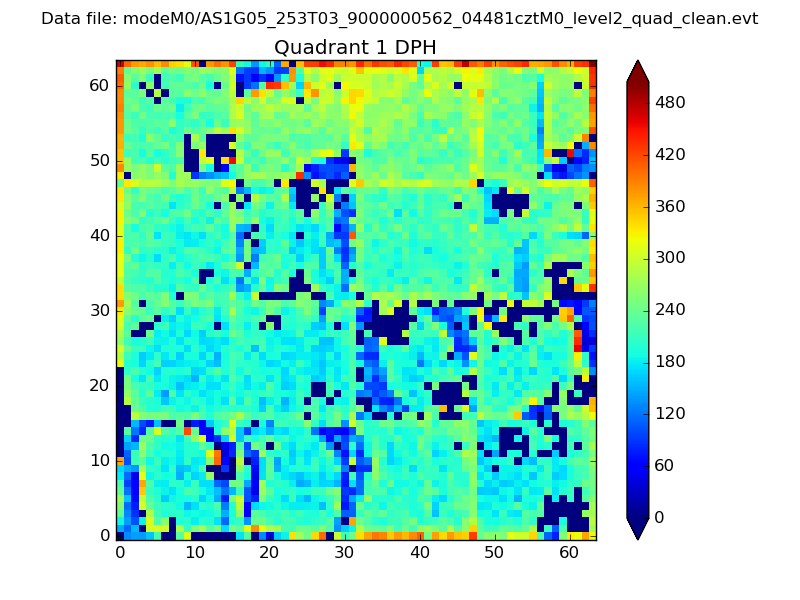 |
Quadrant B |
|---|---|---|---|
| Quadrant D | 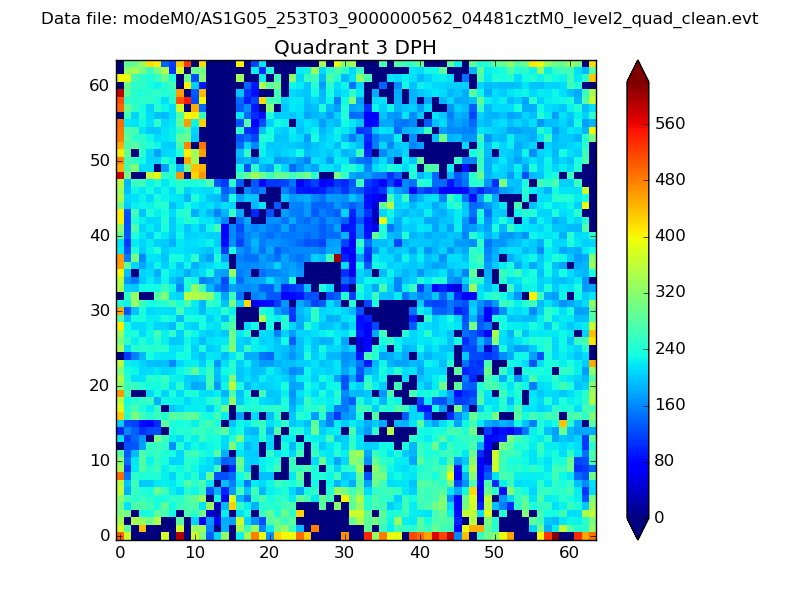 |
 |
Quadrant C |
| Plot type | Count rate plots | Images |
|---|---|---|
| Comparison with Poisson distribution Blue bars denote a histogram of data divided into 1 sec bins. Red curve is a Poisson curve with rate = median count rate of data. |
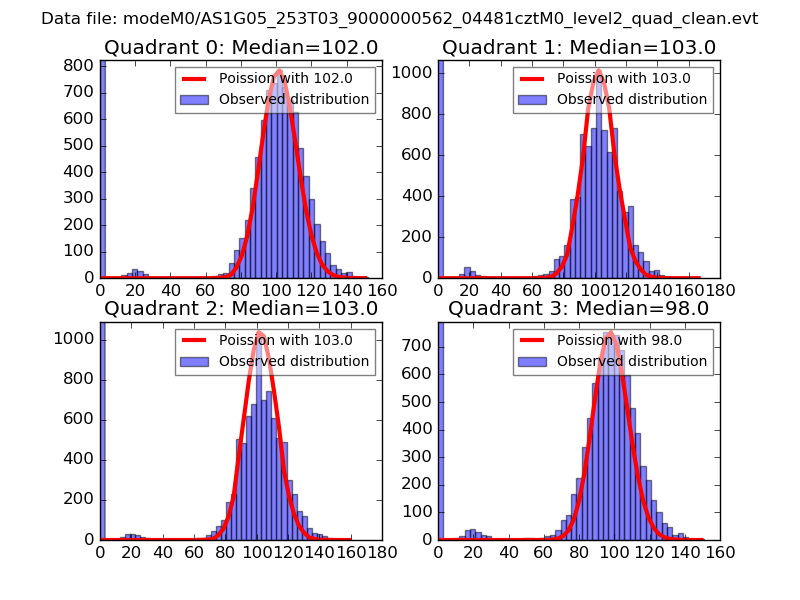 |
 |
| Quadrant-wise count rates Data is divided into 100 sec bins |
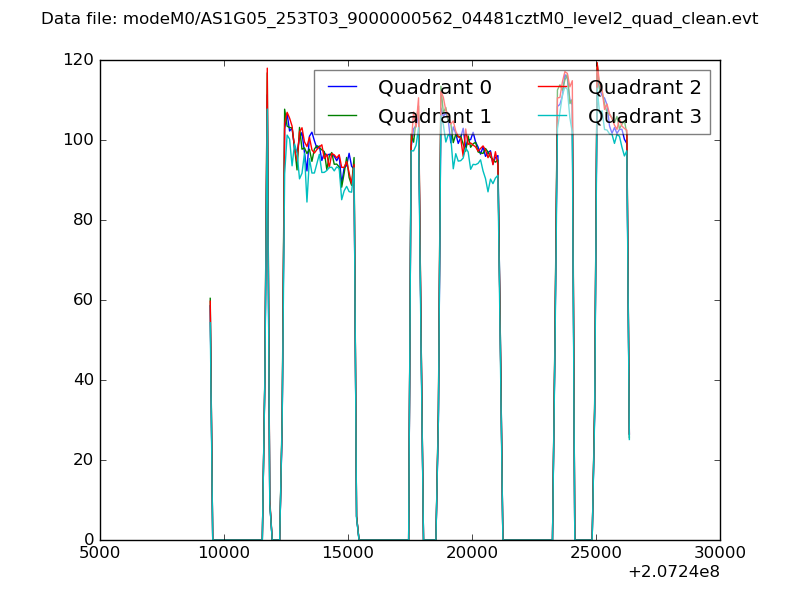 |
|
| Module-wise count rates for Quadrant A Data is divided into 100 sec bins |
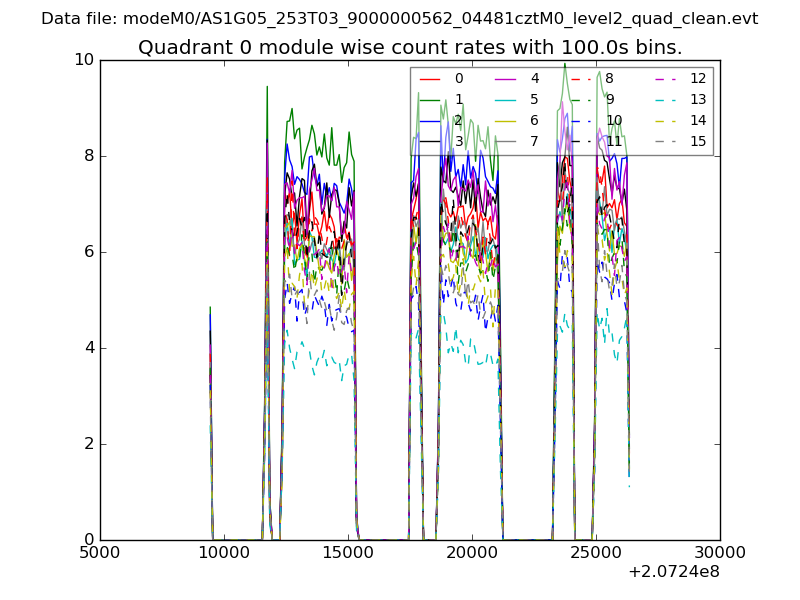 |
 |
| Module-wise count rates for Quadrant B Data is divided into 100 sec bins |
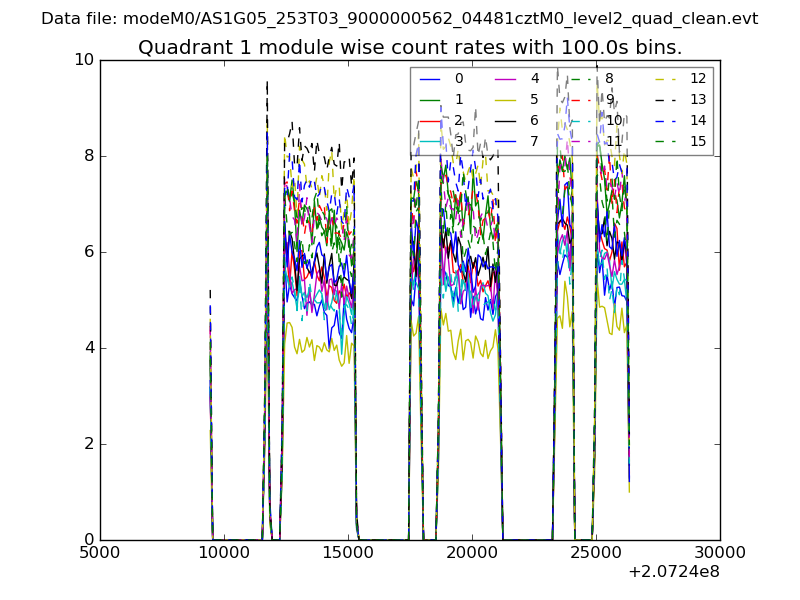 |
 |
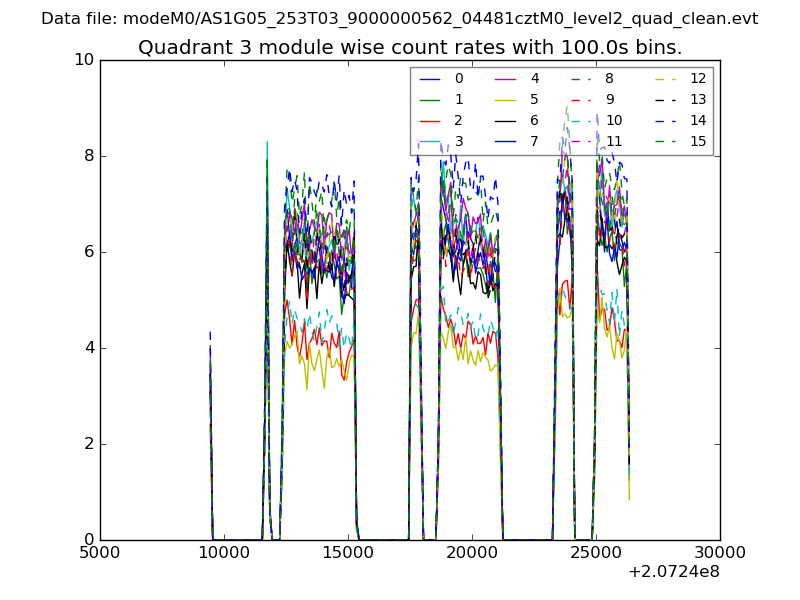
| Module-wise count rates for Quadrant C Data is divided into 100 sec bins |
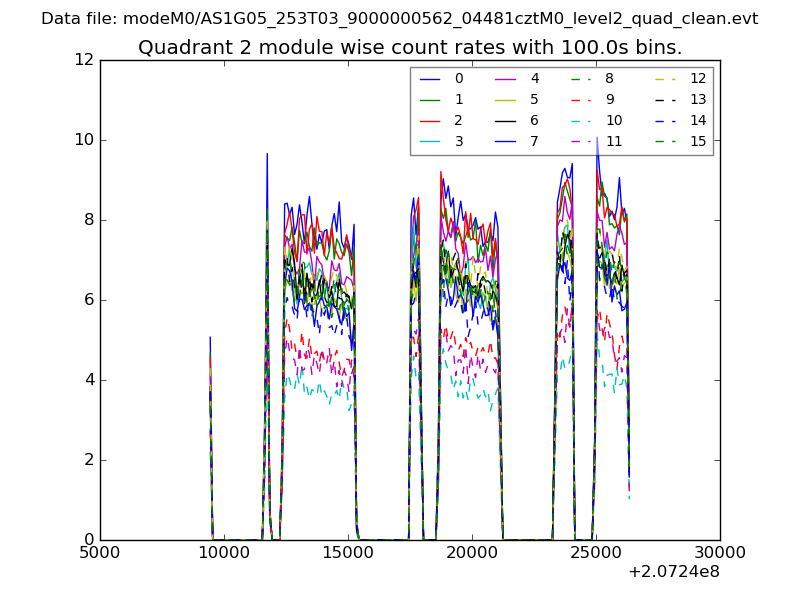 |
 |
| Module-wise count rates for Quadrant D Data is divided into 100 sec bins |
 |
 |
| Parameter | Plot |
|---|---|
| CZT HV Monitor | 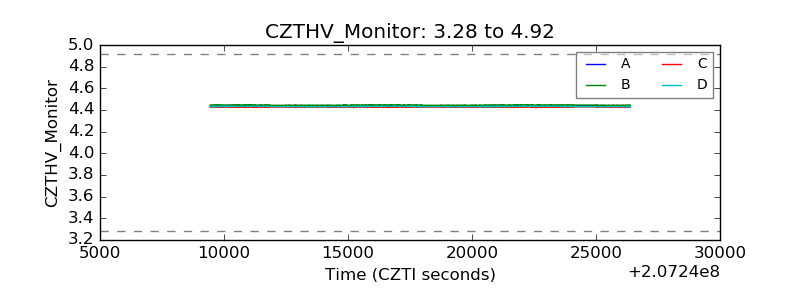 |
| D_VDD | 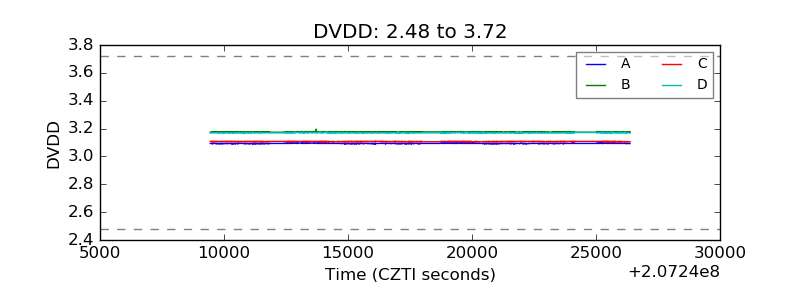 |
| Temperature 1 | 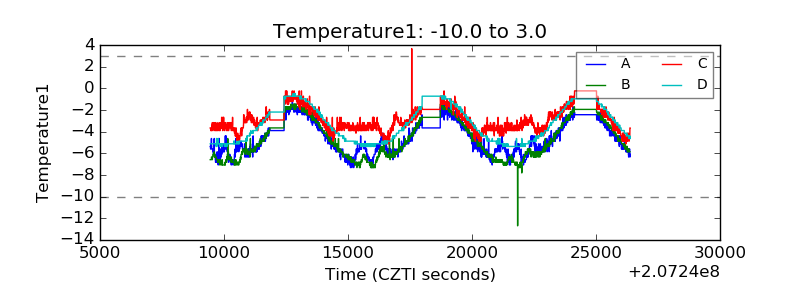 |
| Veto HV Monitor | 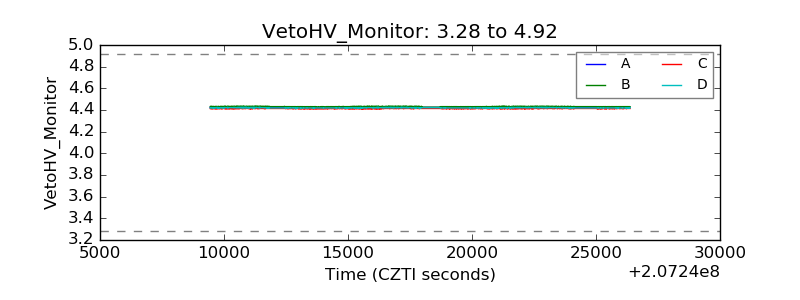 |
| Veto LLD | 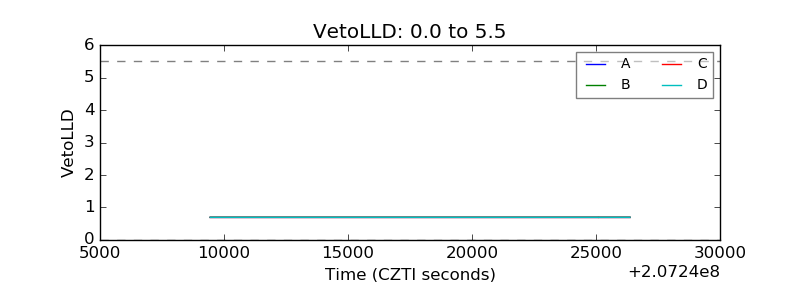 |
| Alpha Counter | 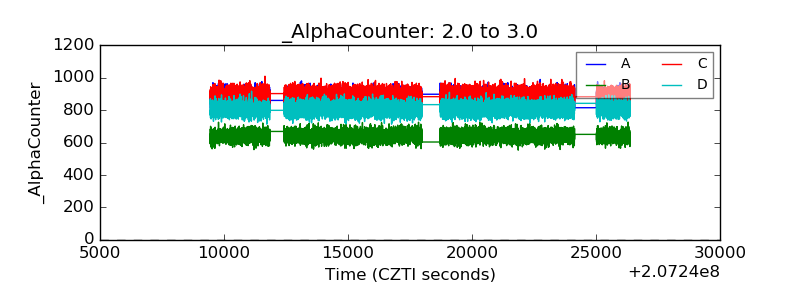 |
| _CPM_Rate | 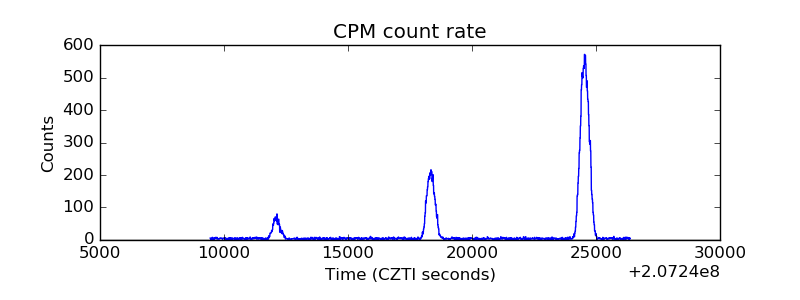 |
| CZT Counter | 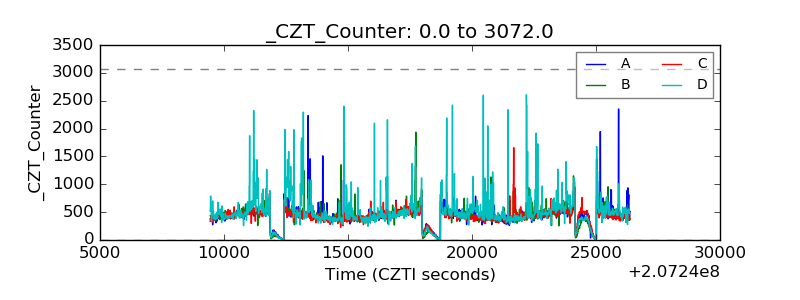 |
| +2.5 Volts monitor |  |
| +5 Volts monitor |  |
| _ROLL_ROT | 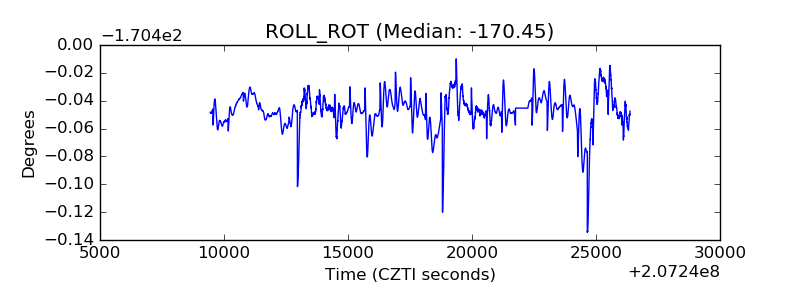 |
| _Roll_DEC | 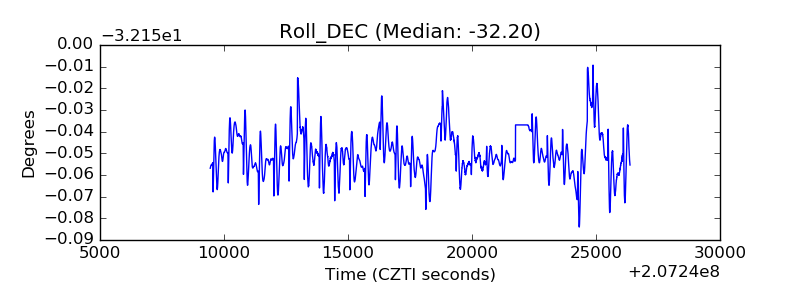 |
| _Roll_RA | 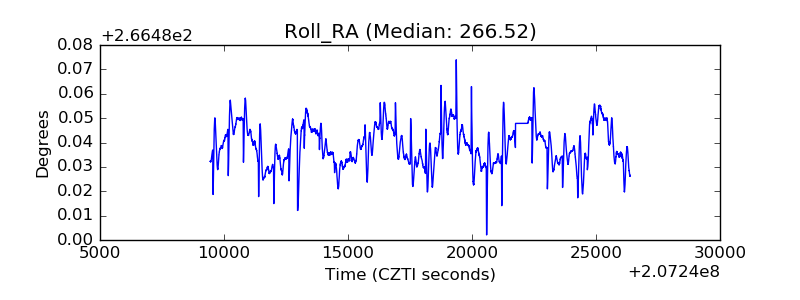 |
| Veto Counter | 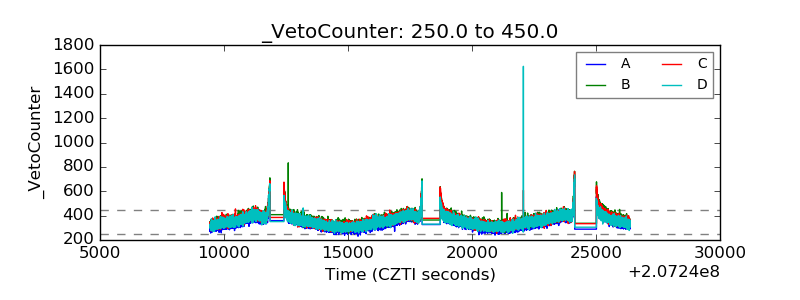 |