| Param | Original file | Final file |
|---|---|---|
| Filename | modeM0/AS1G05_253T03_9000000562_04484cztM0_level2.evt | modeM0/AS1G05_253T03_9000000562_04484cztM0_level2_quad_clean.evt |
| Size (bytes) | 1,774,929,600 | 277,205,760 |
| Size | 1.7 GB | 264.4 MB |
| Events in quadrant A | 12,885,753 | 1,649,670 |
| Events in quadrant B | 12,280,367 | 1,685,226 |
| Events in quadrant C | 11,515,133 | 1,680,495 |
| Events in quadrant D | 15,305,514 | 1,581,545 |
| Mode SS | |||
|---|---|---|---|
| Quadrant | BADHDUFLAG | Total packets | Discarded packets |
| A | 0 | 532 | 0 |
| B | 0 | 532 | 0 |
| C | 0 | 532 | 0 |
| D | 0 | 532 | 0 |
| Mode M9 | |||
|---|---|---|---|
| Quadrant | BADHDUFLAG | Total packets | Discarded packets |
| A | 0 | 36 | 0 |
| B | 0 | 36 | 0 |
| C | 0 | 36 | 0 |
| D | 0 | 37 | 0 |
| Mode M0 | |||
|---|---|---|---|
| Quadrant | BADHDUFLAG | Total packets | Discarded packets |
| A | 0 | 56935 | 6 |
| B | 0 | 54462 | 5 |
| C | 0 | 53372 | 5 |
| D | 0 | 63999 | 5 |
| Quadrant | Total seconds | Saturated seconds | Saturation percentage |
|---|---|---|---|
| A | 26144 | 586 | 2.241432% |
| B | 26144 | 189 | 0.722919% |
| C | 26144 | 52 | 0.198898% |
| D | 26144 | 659 | 2.520655% |
Noise dominated data is calculated using 1-second bins in cleaned event files. If a bin has >2000 counts, and if more than 50% of those come from <1% of pixels, then it is considered to be noise-dominated and hence unusable.
| Quadrant | # 1 sec bins | Bins with >0 counts | Bins with >2000 counts | High rate bins dominated by noise | Noise dominated (total time) | Noise dominated (detector-on time) | Marked lightcurve |
|---|---|---|---|---|---|---|---|
| A | 37854 | 26148 | 332 | 332 | 0.88% | 1.27% | 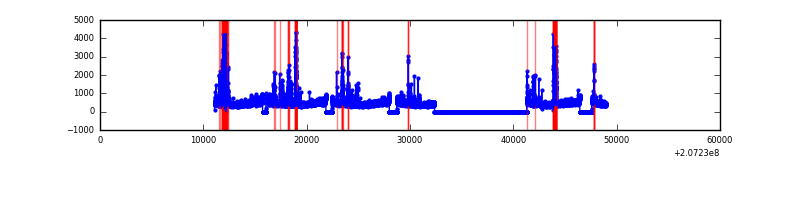 |
| B | 37854 | 26148 | 22 | 22 | 0.06% | 0.08% | 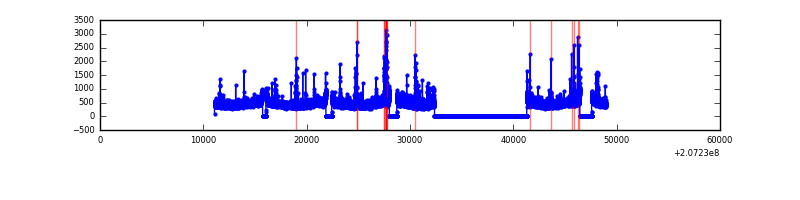 |
| C | 37854 | 26148 | 10 | 10 | 0.03% | 0.04% | 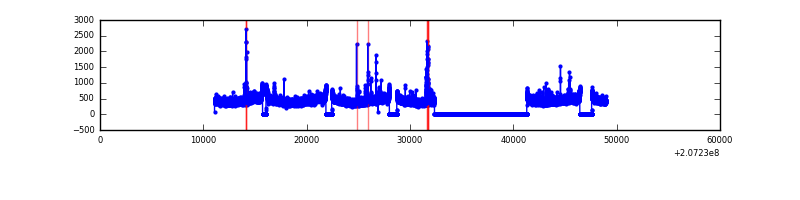 |
| D | 37854 | 26148 | 469 | 469 | 1.24% | 1.79% | 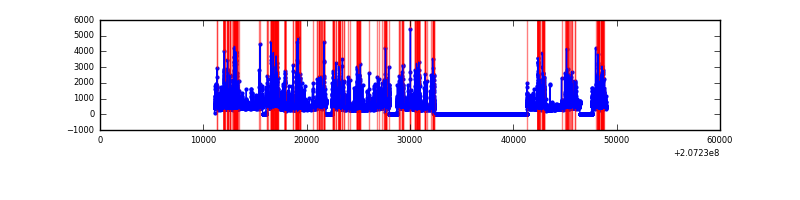 |
Top three noisy pixels from each quadrant. If the there are fewer than three noisy pixels in the level2.evt file, extra rows are filled as -1
| Pixel properties | Quadrant properties | ||||||
|---|---|---|---|---|---|---|---|
| Quadrant | DetID | PixID | Counts | Sigma | Mean | Median | Sigma |
| A | 0 | 118 | 1133610 | 1902.08 | 2937 | 2879 | 594.5 |
| A | 0 | 13 | 205377 | 340.64 | 2937 | 2879 | 594.5 |
| A | 0 | 226 | 128238 | 210.87 | 2937 | 2879 | 594.5 |
| B | 15 | 204 | 164156 | 281.79 | 3010 | 2944 | 572.1 |
| B | 4 | 48 | 136991 | 234.31 | 3010 | 2944 | 572.1 |
| B | 4 | 170 | 99200 | 168.25 | 3010 | 2944 | 572.1 |
| C | 9 | 54 | 129439 | 188.94 | 2887 | 2902 | 669.7 |
| C | 9 | 16 | 45201 | 63.16 | 2887 | 2902 | 669.7 |
| C | 13 | 61 | 23925 | 31.39 | 2887 | 2902 | 669.7 |
| D | 13 | 235 | 1689638 | 2463.21 | 2833 | 2748 | 684.8 |
| D | 14 | 34 | 1384774 | 2018.05 | 2833 | 2748 | 684.8 |
| D | 12 | 79 | 391202 | 567.22 | 2833 | 2748 | 684.8 |
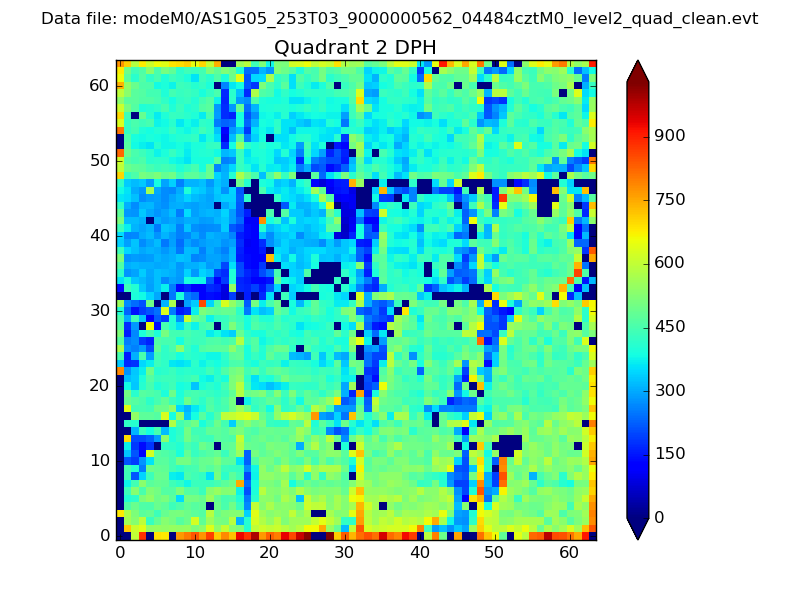
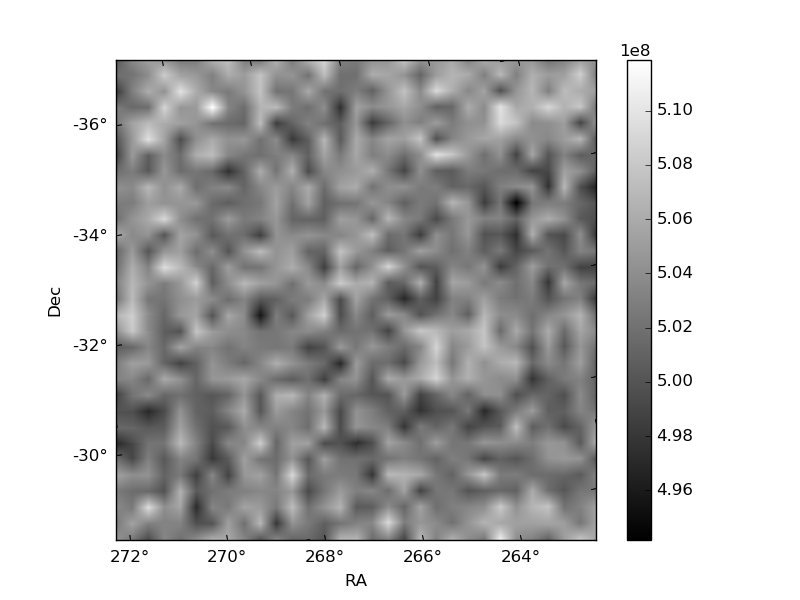
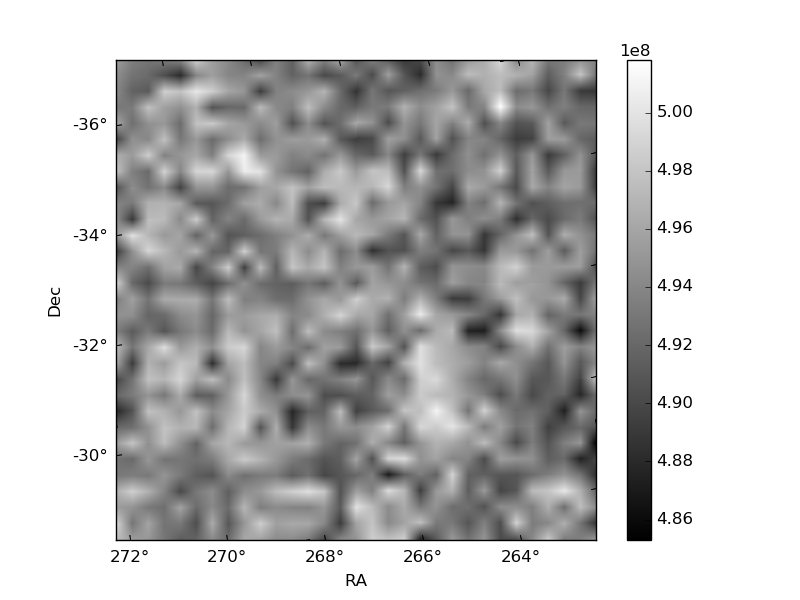
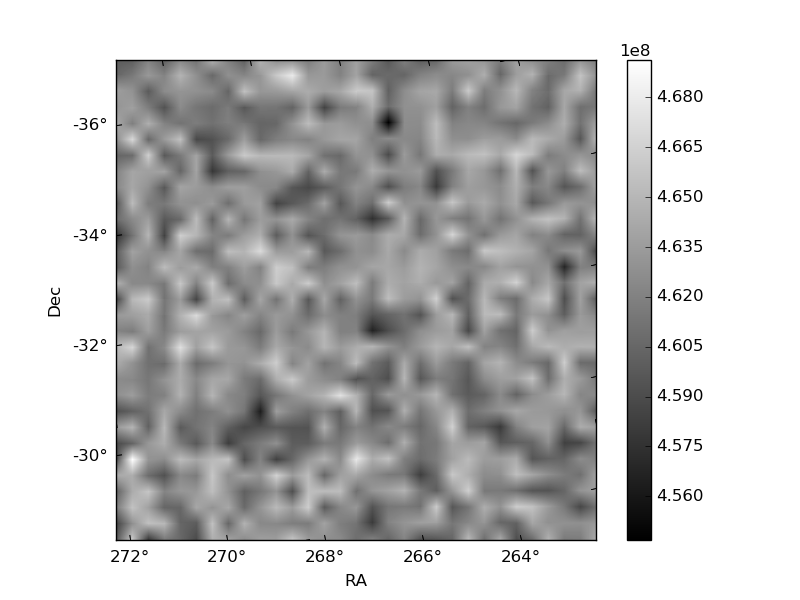
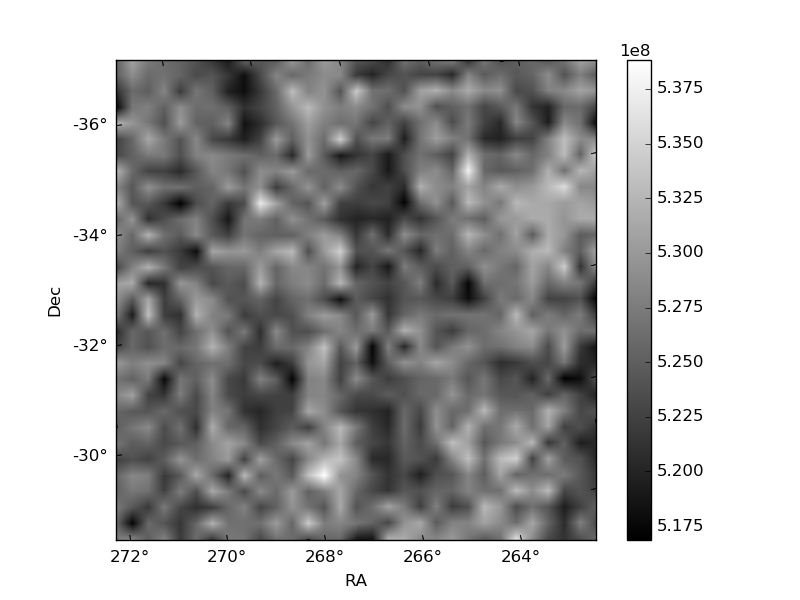
Histogram calculated using DETX and DETY for each event in the final _common_clean file
| Quadrant A | 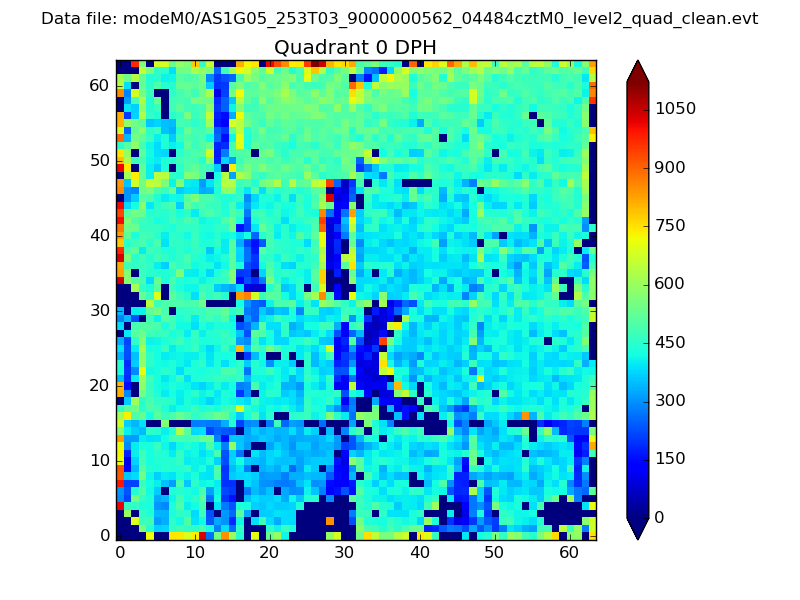 |
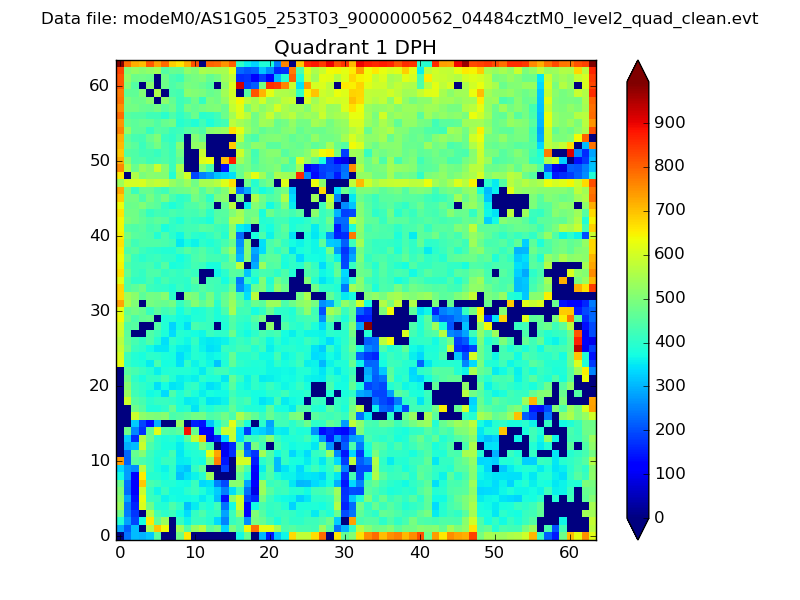 |
Quadrant B |
|---|---|---|---|
| Quadrant D | 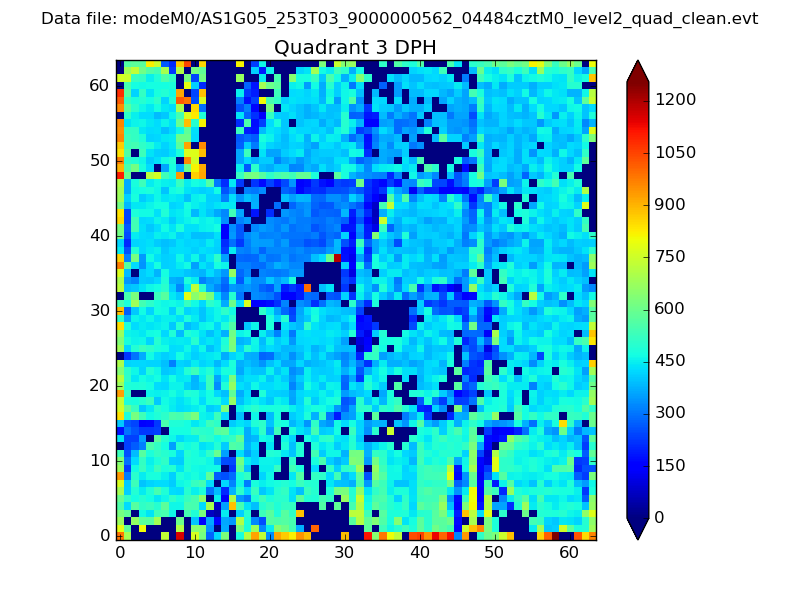 |
 |
Quadrant C |
| Plot type | Count rate plots | Images |
|---|---|---|
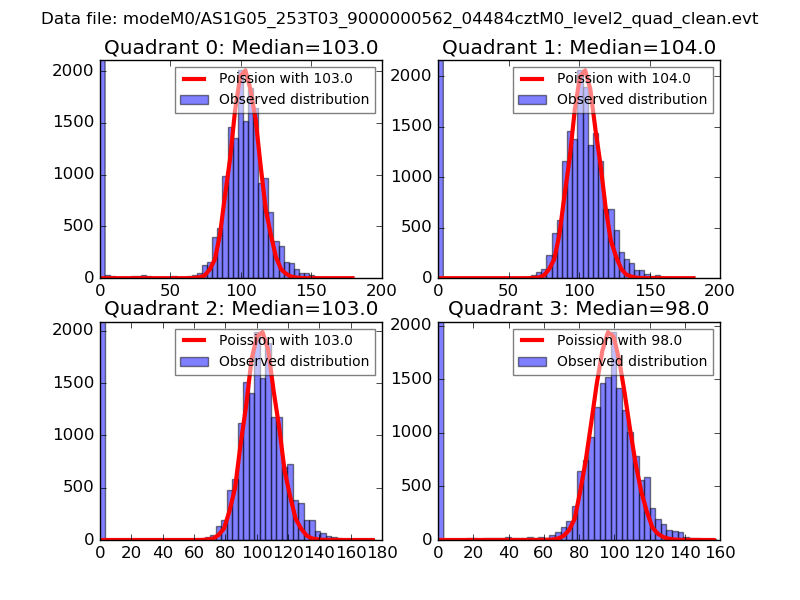
| Comparison with Poisson distribution Blue bars denote a histogram of data divided into 1 sec bins. Red curve is a Poisson curve with rate = median count rate of data. |
 |
 |
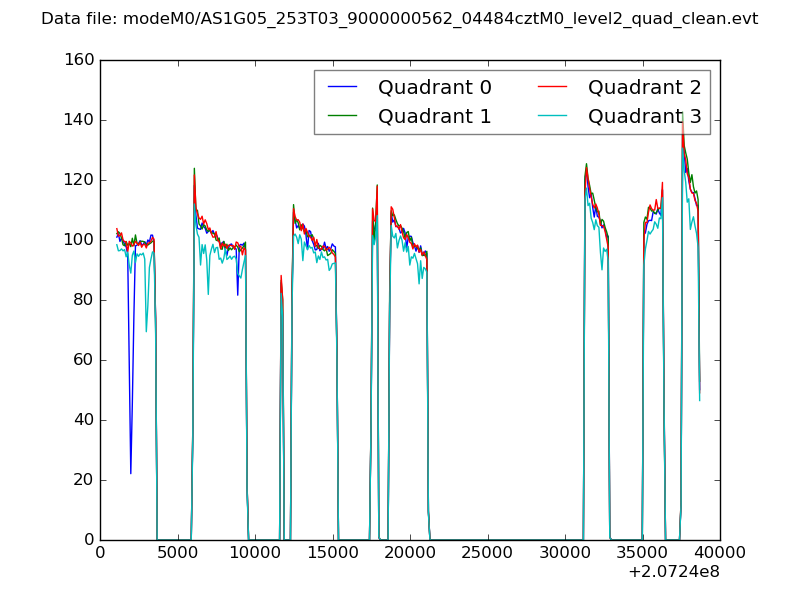
| Quadrant-wise count rates Data is divided into 100 sec bins |
 |
|
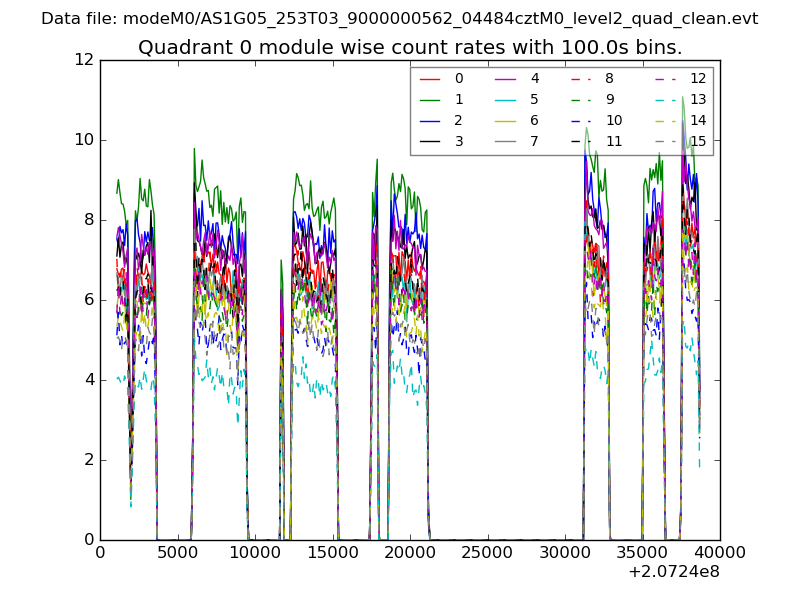
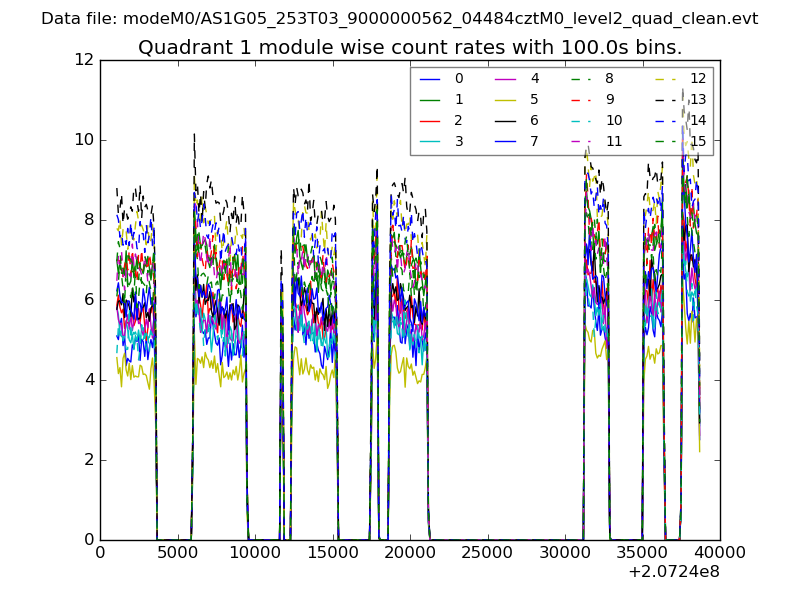
| Module-wise count rates for Quadrant A Data is divided into 100 sec bins |
 |
 |
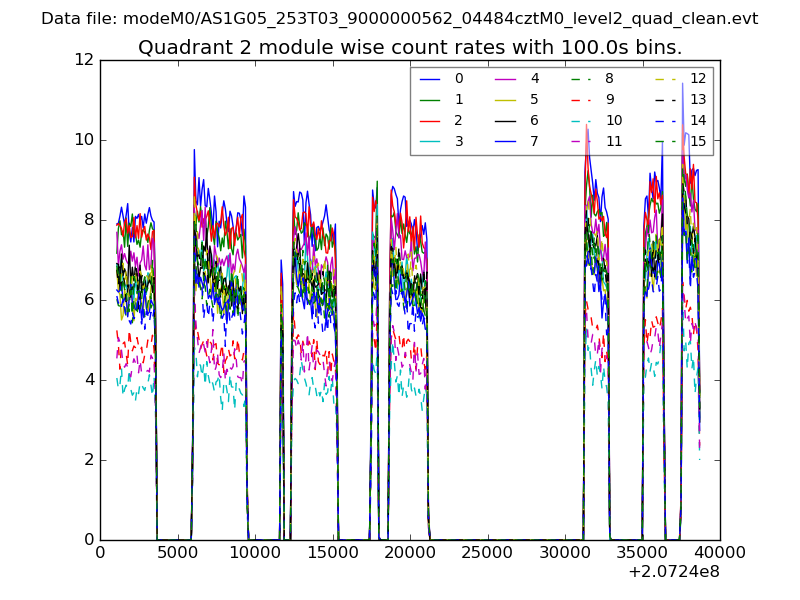
| Module-wise count rates for Quadrant B Data is divided into 100 sec bins |
 |
 |
| Module-wise count rates for Quadrant C Data is divided into 100 sec bins |
 |
 |
| Module-wise count rates for Quadrant D Data is divided into 100 sec bins |
 |
 |
| Parameter | Plot |
|---|---|
| CZT HV Monitor | 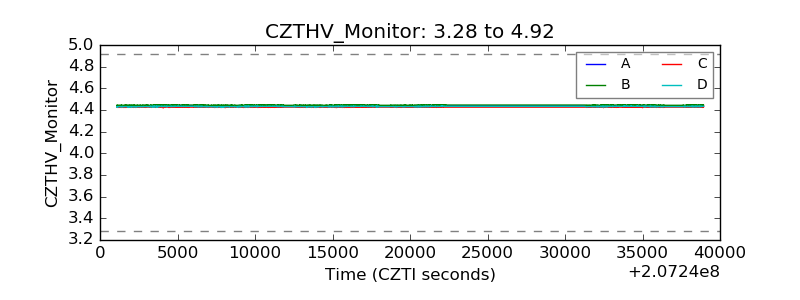 |
| D_VDD | 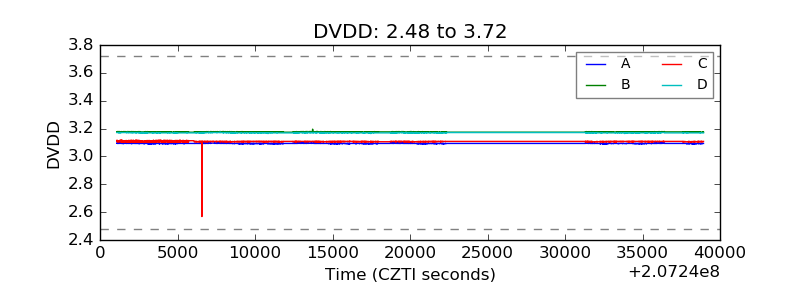 |
| Temperature 1 | 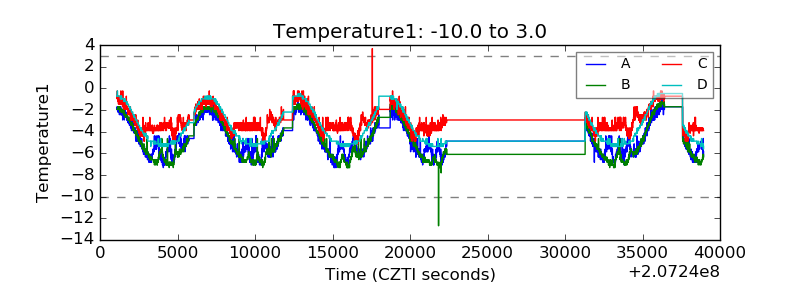 |
| Veto HV Monitor | 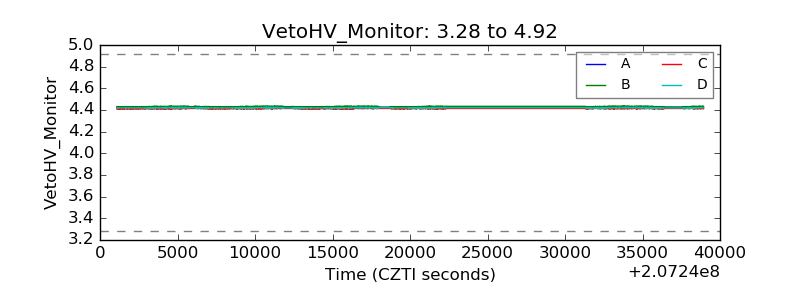 |
| Veto LLD | 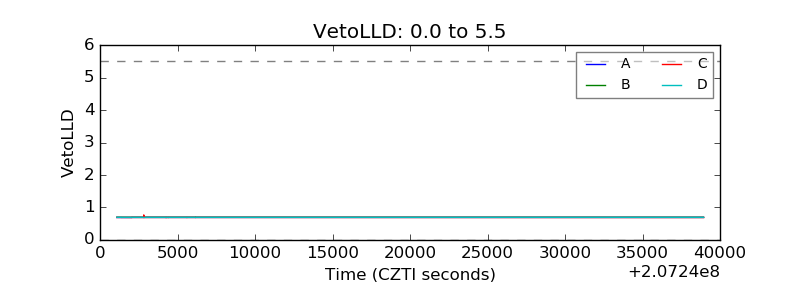 |
| Alpha Counter | 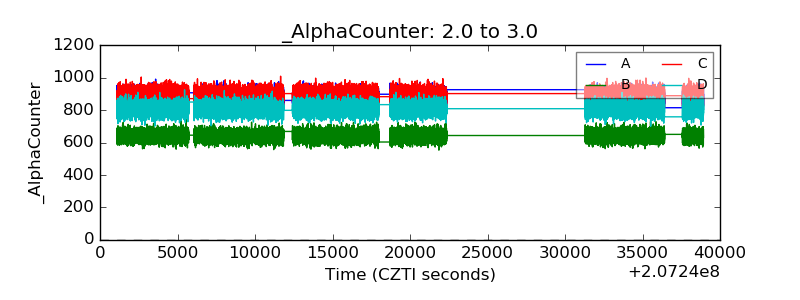 |
| _CPM_Rate | 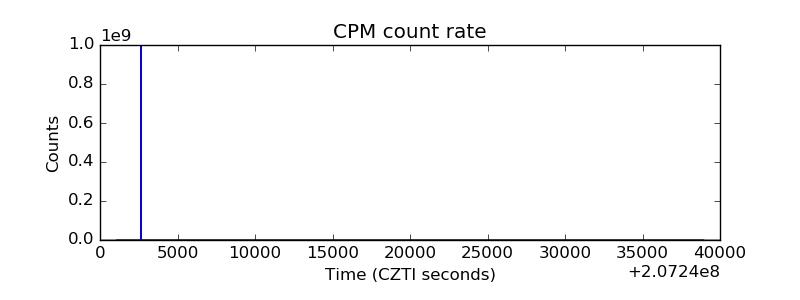 |
| CZT Counter | 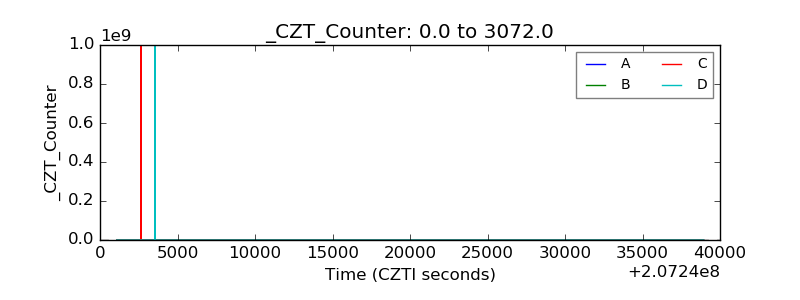 |
| +2.5 Volts monitor |  |
| +5 Volts monitor |  |
| _ROLL_ROT | 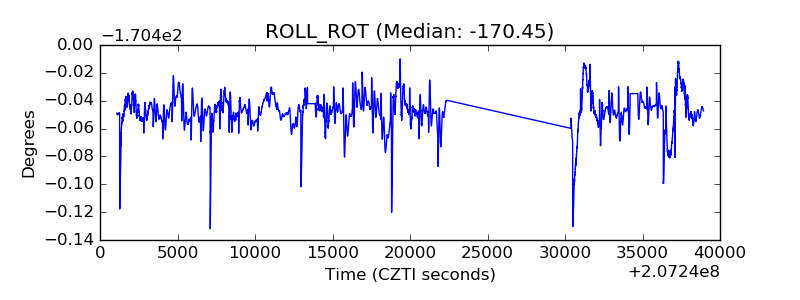 |
| _Roll_DEC | 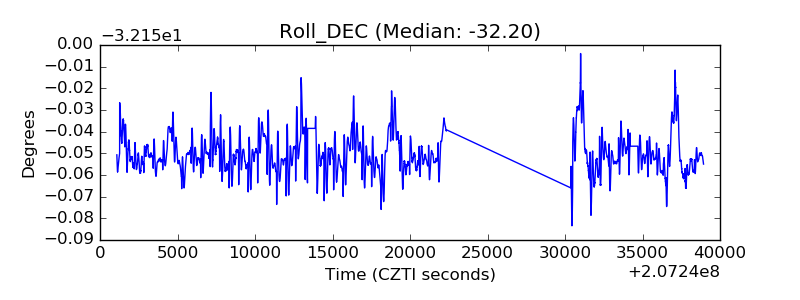 |
| _Roll_RA | 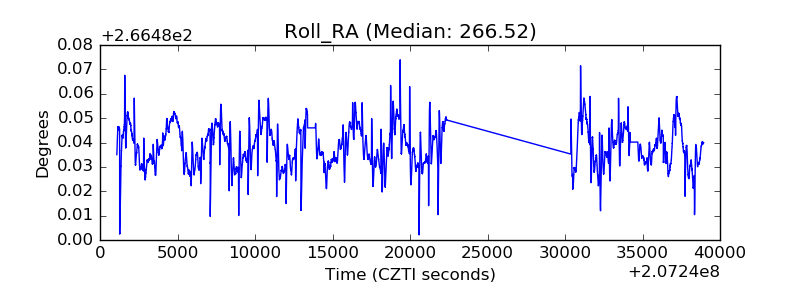 |
| Veto Counter | 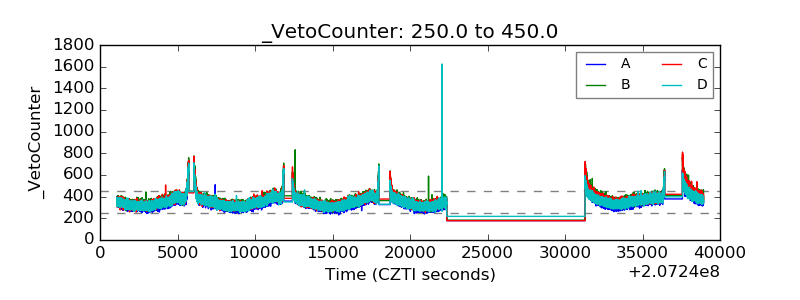 |