| Param | Original file | Final file |
|---|---|---|
| Filename | modeM0/AS1G05_253T03_9000000562_04487cztM0_level2.evt | modeM0/AS1G05_253T03_9000000562_04487cztM0_level2_quad_clean.evt |
| Size (bytes) | 468,705,600 | 56,937,600 |
| Size | 447.0 MB | 54.3 MB |
| Events in quadrant A | 3,451,032 | 318,960 |
| Events in quadrant B | 3,270,104 | 324,856 |
| Events in quadrant C | 3,266,252 | 323,744 |
| Events in quadrant D | 3,766,059 | 302,839 |
| Mode SS | |||
|---|---|---|---|
| Quadrant | BADHDUFLAG | Total packets | Discarded packets |
| A | 0 | 134 | 0 |
| B | 0 | 134 | 0 |
| C | 0 | 134 | 0 |
| D | 0 | 134 | 0 |
| Mode M9 | |||
|---|---|---|---|
| Quadrant | BADHDUFLAG | Total packets | Discarded packets |
| A | 0 | 12 | 0 |
| B | 0 | 12 | 0 |
| C | 0 | 12 | 0 |
| D | 0 | 12 | 0 |
| Mode M0 | |||
|---|---|---|---|
| Quadrant | BADHDUFLAG | Total packets | Discarded packets |
| A | 0 | 14383 | 3 |
| B | 0 | 13658 | 2 |
| C | 0 | 13840 | 2 |
| D | 0 | 15522 | 2 |
| Quadrant | Total seconds | Saturated seconds | Saturation percentage |
|---|---|---|---|
| A | 6490 | 114 | 1.756549% |
| B | 6490 | 79 | 1.217257% |
| C | 6490 | 71 | 1.093991% |
| D | 6491 | 204 | 3.142813% |
Noise dominated data is calculated using 1-second bins in cleaned event files. If a bin has >2000 counts, and if more than 50% of those come from <1% of pixels, then it is considered to be noise-dominated and hence unusable.
| Quadrant | # 1 sec bins | Bins with >0 counts | Bins with >2000 counts | High rate bins dominated by noise | Noise dominated (total time) | Noise dominated (detector-on time) | Marked lightcurve |
|---|---|---|---|---|---|---|---|
| A | 7765 | 6490 | 52 | 52 | 0.67% | 0.80% | 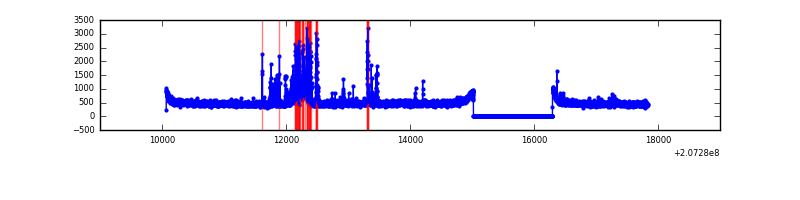 |
| B | 7765 | 6490 | 5 | 5 | 0.06% | 0.08% | 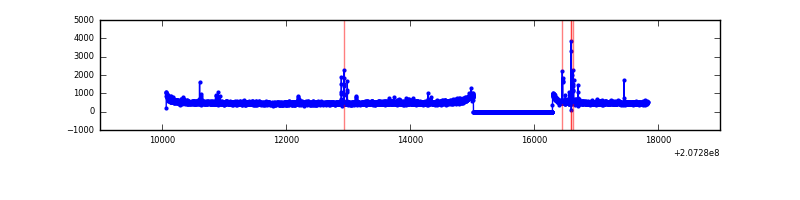 |
| C | 7765 | 6490 | 21 | 21 | 0.27% | 0.32% | 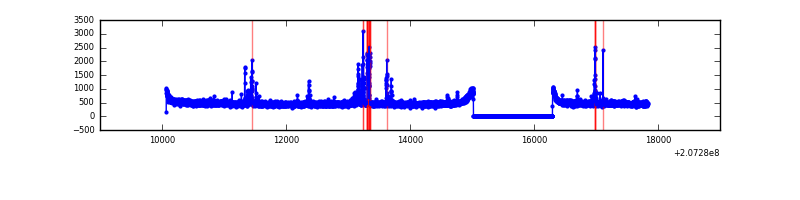 |
| D | 7766 | 6490 | 111 | 111 | 1.43% | 1.71% | 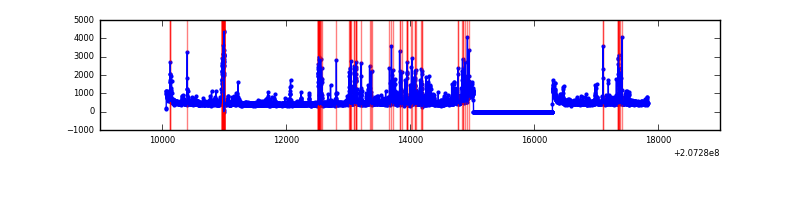 |
Top three noisy pixels from each quadrant. If the there are fewer than three noisy pixels in the level2.evt file, extra rows are filled as -1
| Pixel properties | Quadrant properties | ||||||
|---|---|---|---|---|---|---|---|
| Quadrant | DetID | PixID | Counts | Sigma | Mean | Median | Sigma |
| A | 0 | 13 | 379761 | 2334.09 | 795 | 778 | 162.4 |
| A | 0 | 226 | 8015 | 44.57 | 795 | 778 | 162.4 |
| A | 12 | 194 | 7983 | 44.37 | 795 | 778 | 162.4 |
| B | 4 | 48 | 52477 | 336.14 | 814 | 796 | 153.7 |
| B | 15 | 204 | 51237 | 328.08 | 814 | 796 | 153.7 |
| B | 12 | 111 | 13302 | 81.34 | 814 | 796 | 153.7 |
| C | 9 | 54 | 109583 | 597.36 | 786 | 790 | 182.1 |
| C | 14 | 48 | 60402 | 327.31 | 786 | 790 | 182.1 |
| C | 9 | 16 | 17859 | 93.72 | 786 | 790 | 182.1 |
| D | 13 | 235 | 288361 | 1568.06 | 765 | 744 | 183.4 |
| D | 12 | 233 | 175561 | 953.08 | 765 | 744 | 183.4 |
| D | 14 | 34 | 151502 | 821.92 | 765 | 744 | 183.4 |
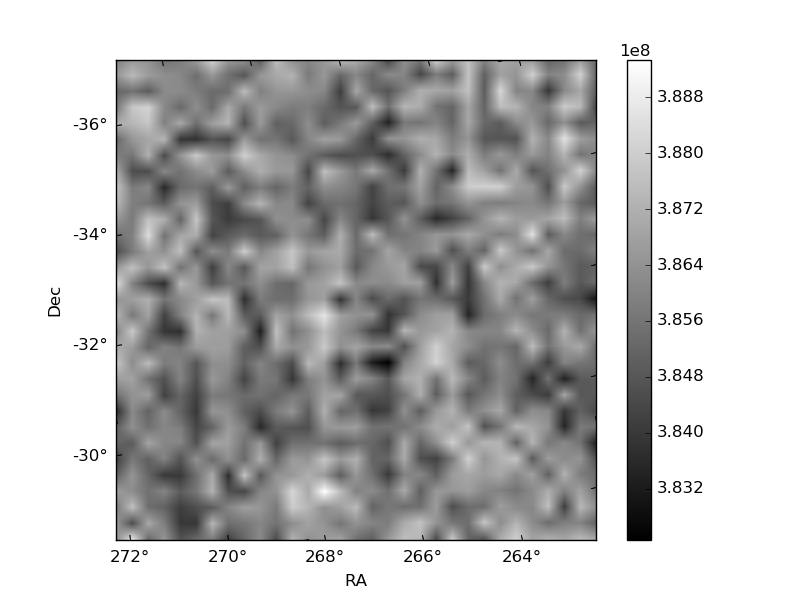
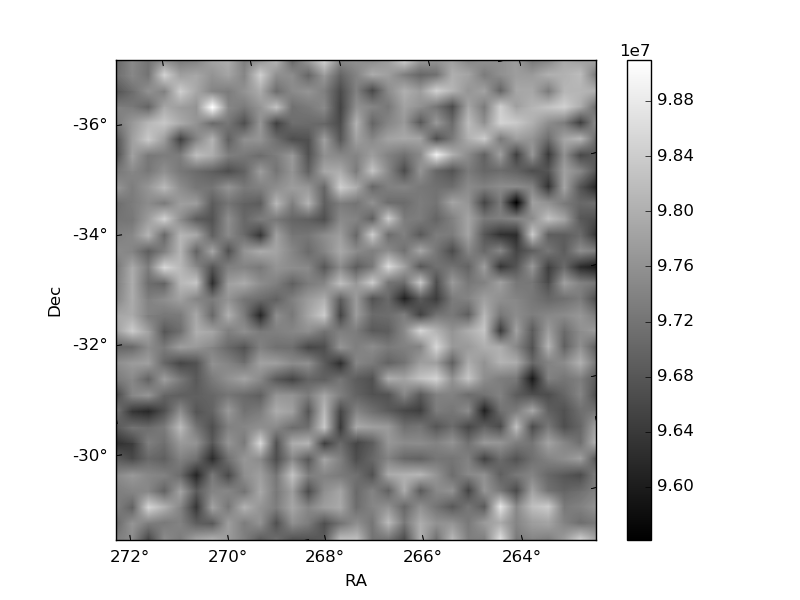
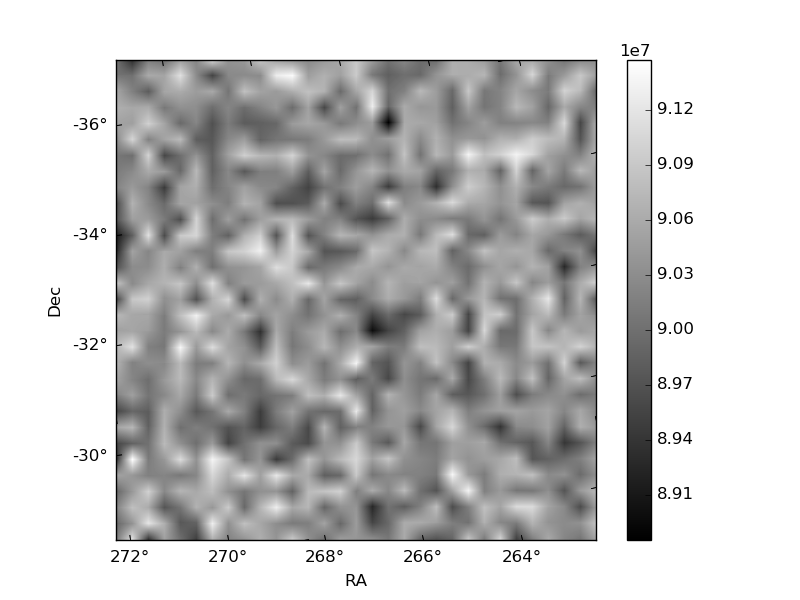
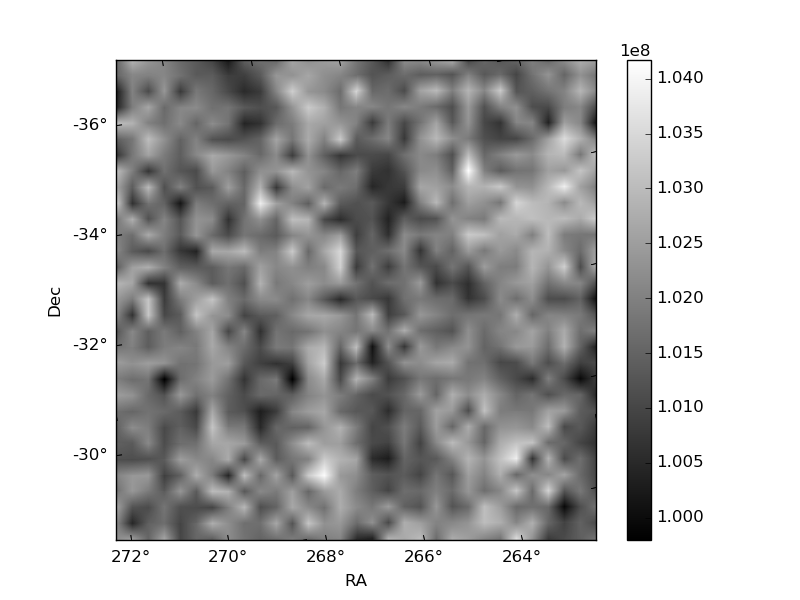
Histogram calculated using DETX and DETY for each event in the final _common_clean file
| Quadrant A | 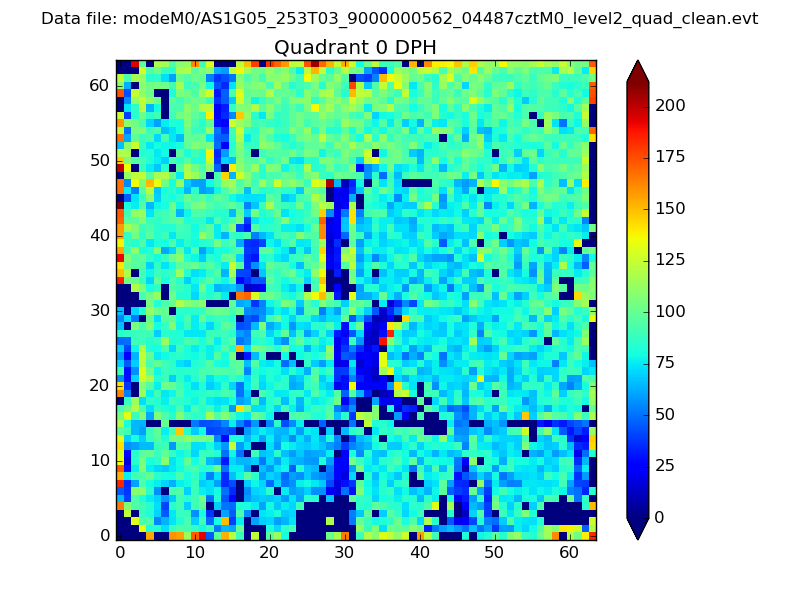 |
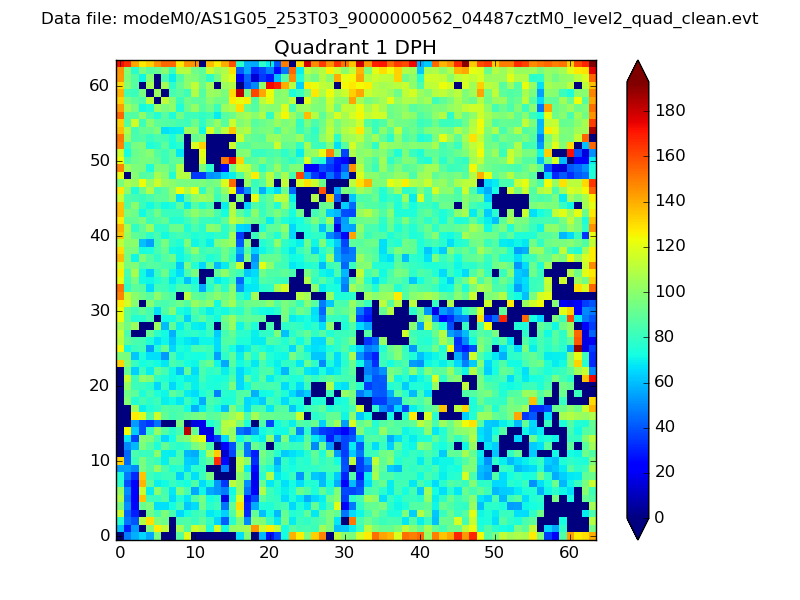 |
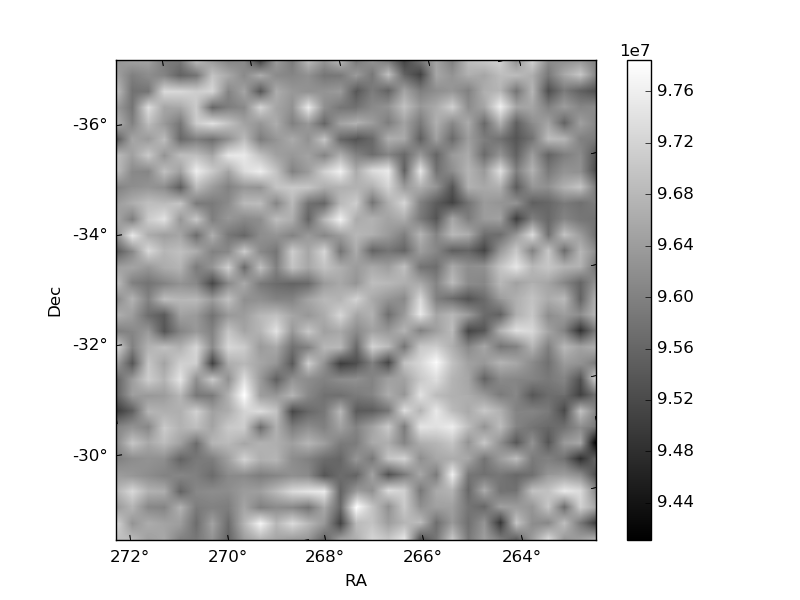
Quadrant B |
|---|---|---|---|
| Quadrant D | 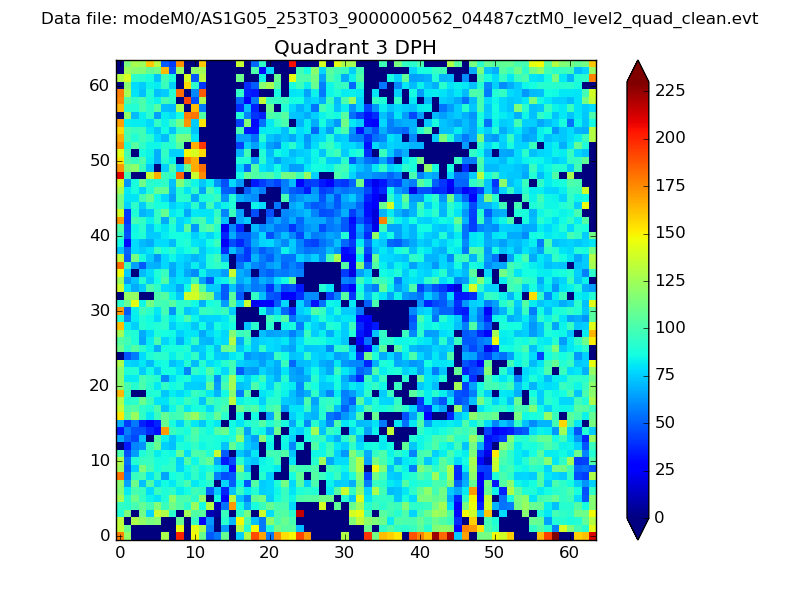 |
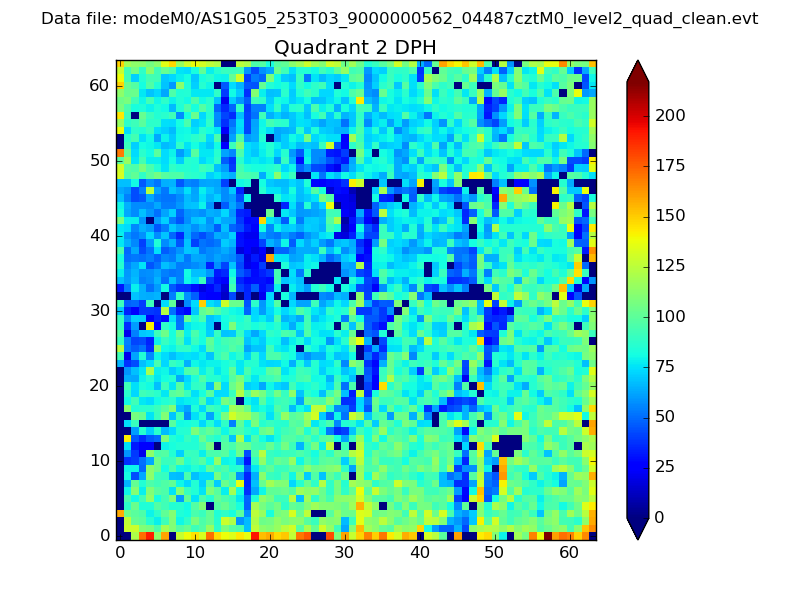 |
Quadrant C |
| Plot type | Count rate plots | Images |
|---|---|---|
| Comparison with Poisson distribution Blue bars denote a histogram of data divided into 1 sec bins. Red curve is a Poisson curve with rate = median count rate of data. |
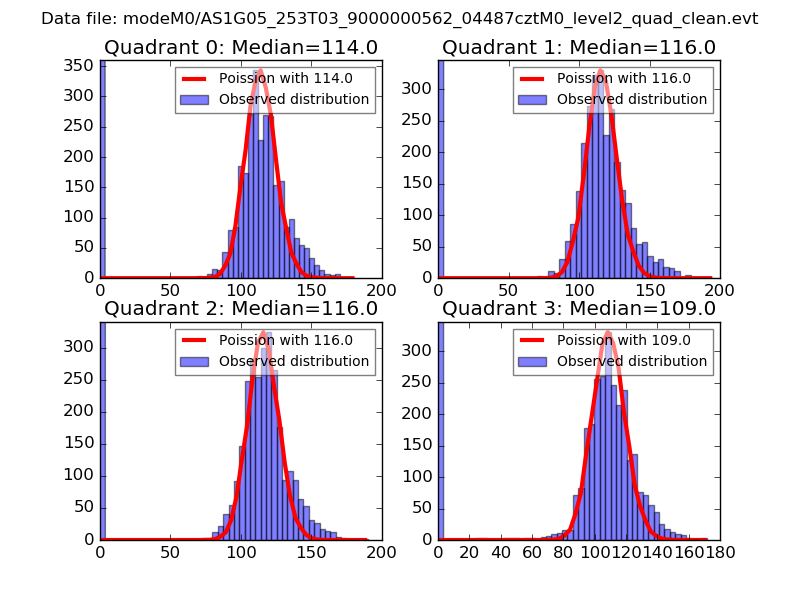 |
 |
| Quadrant-wise count rates Data is divided into 100 sec bins |
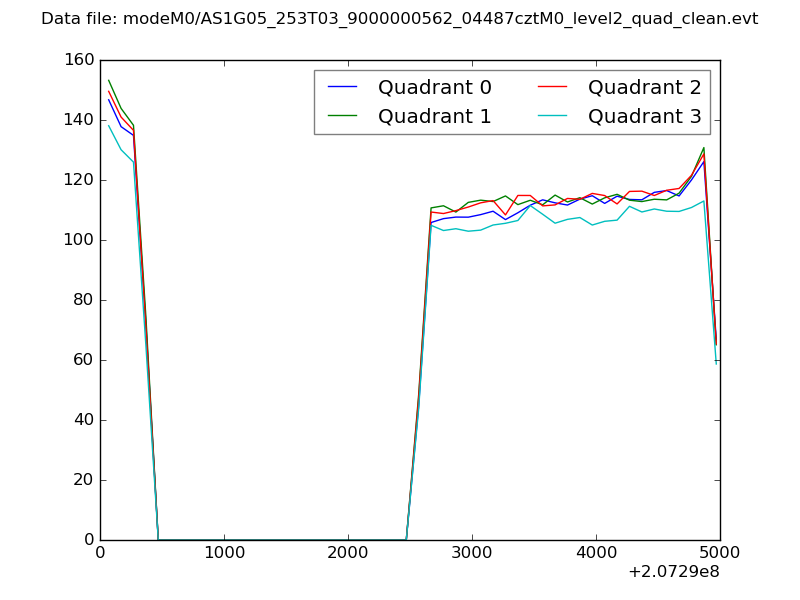 |
|
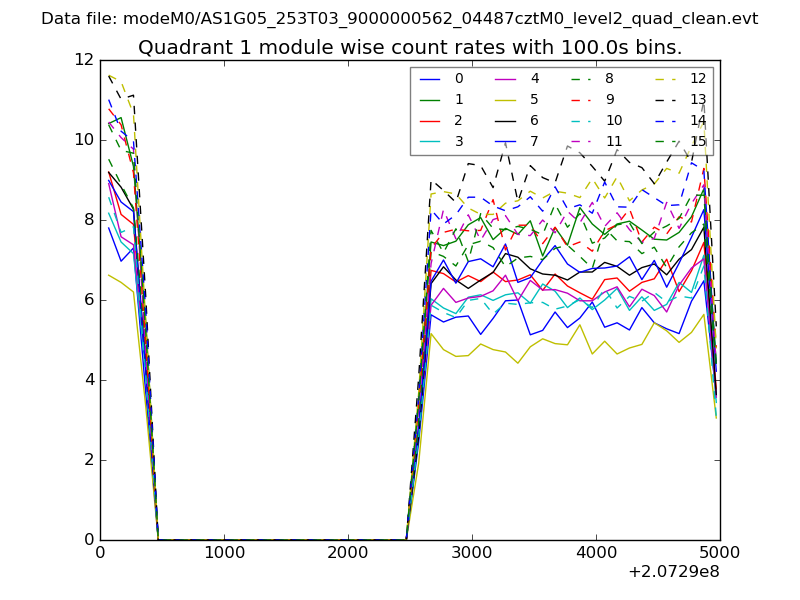
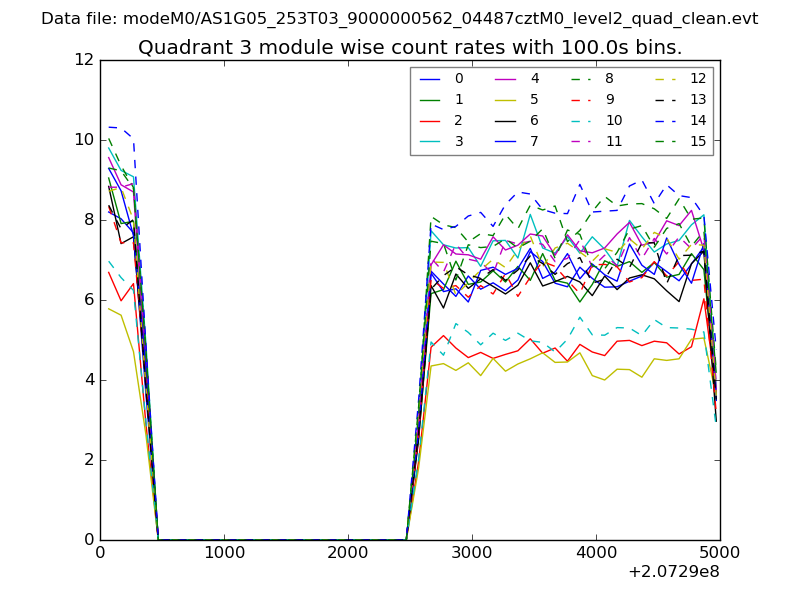
| Module-wise count rates for Quadrant A Data is divided into 100 sec bins |
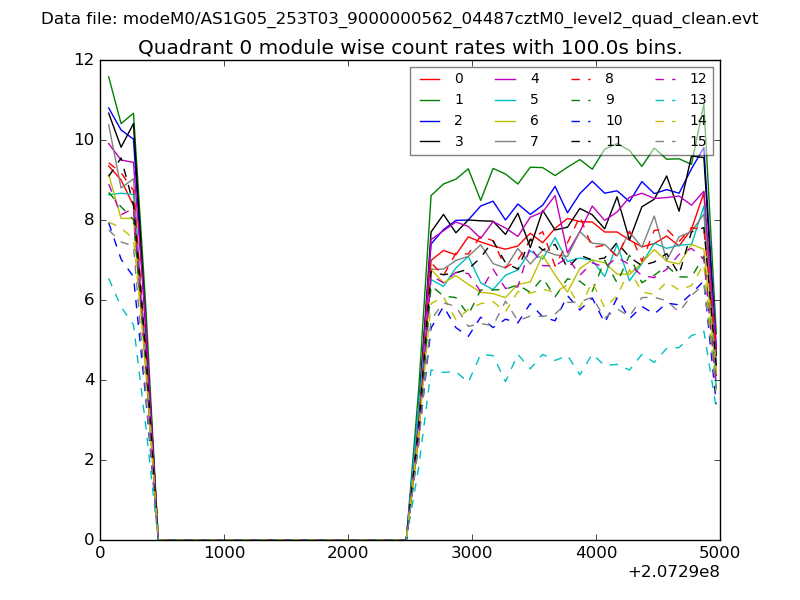 |
 |
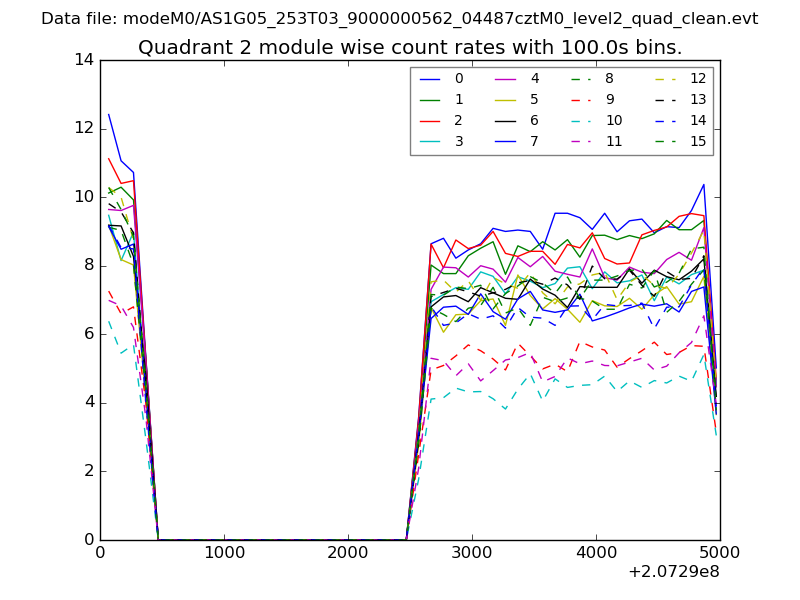
| Module-wise count rates for Quadrant B Data is divided into 100 sec bins |
 |
 |
| Module-wise count rates for Quadrant C Data is divided into 100 sec bins |
 |
 |
| Module-wise count rates for Quadrant D Data is divided into 100 sec bins |
 |
 |
| Parameter | Plot |
|---|---|
| CZT HV Monitor | 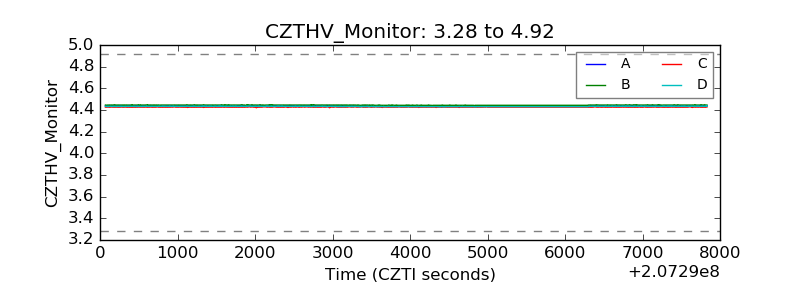 |
| D_VDD | 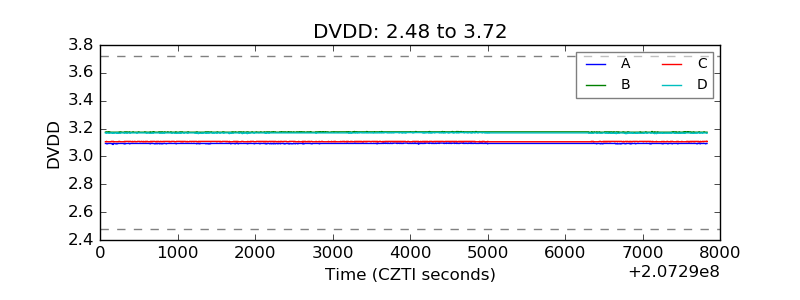 |
| Temperature 1 | 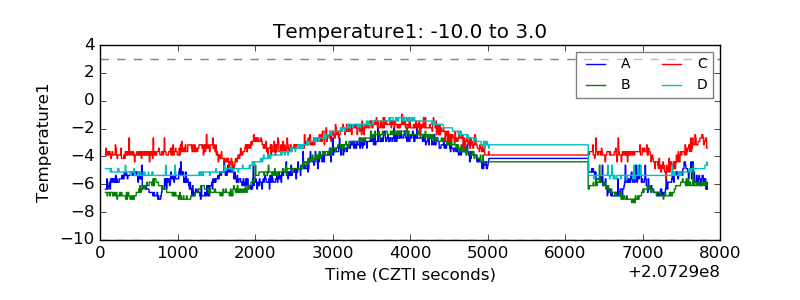 |
| Veto HV Monitor | 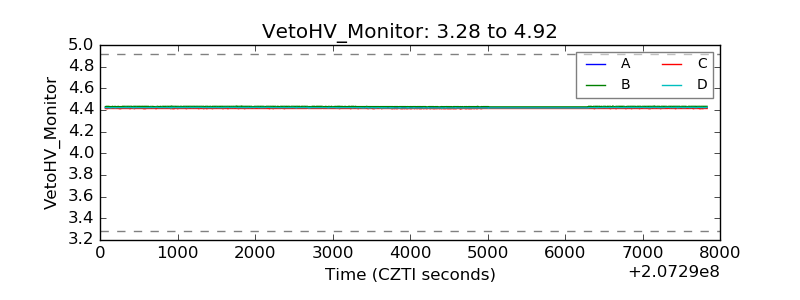 |
| Veto LLD | 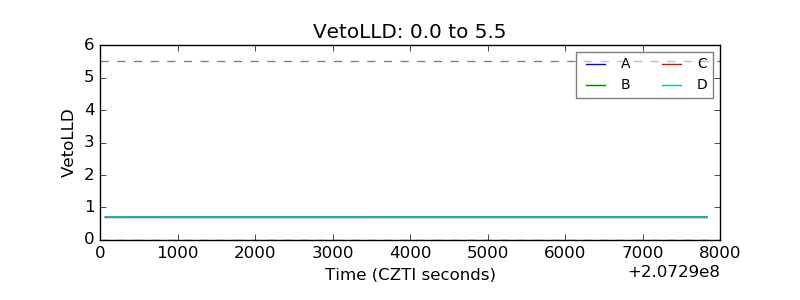 |
| Alpha Counter | 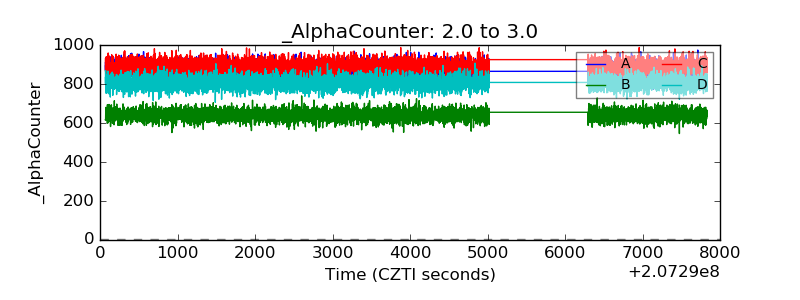 |
| _CPM_Rate | 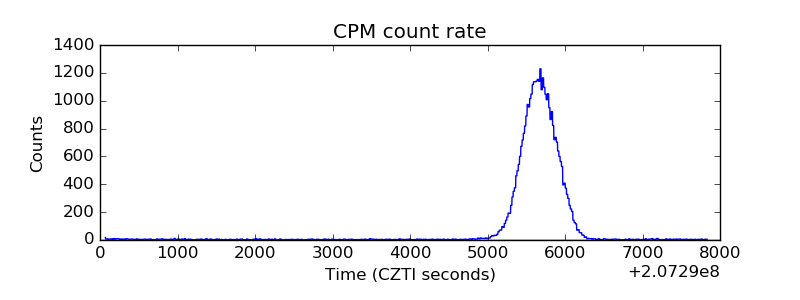 |
| CZT Counter | 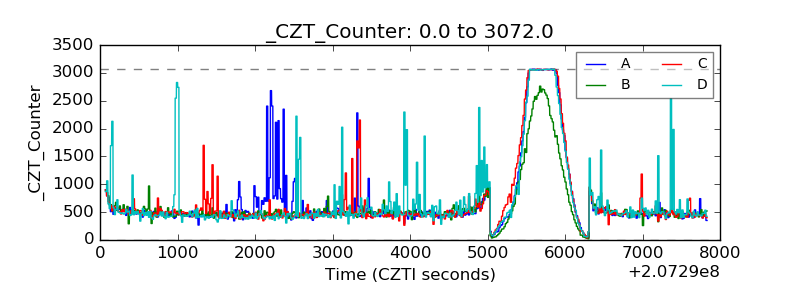 |
| +2.5 Volts monitor |  |
| +5 Volts monitor |  |
| _ROLL_ROT | 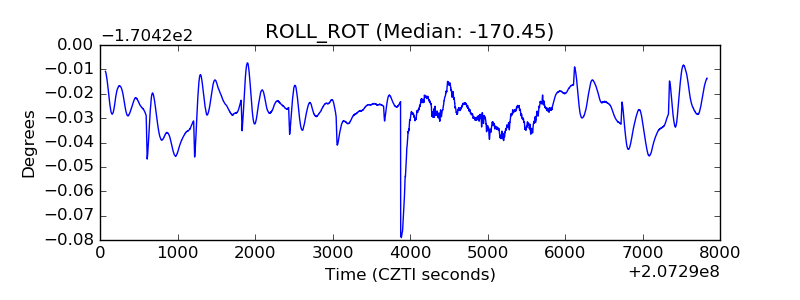 |
| _Roll_DEC | 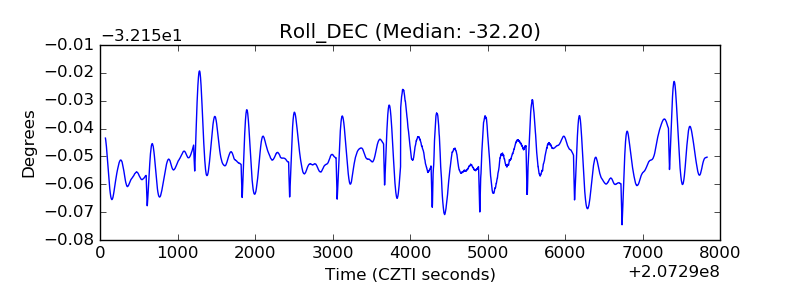 |
| _Roll_RA | 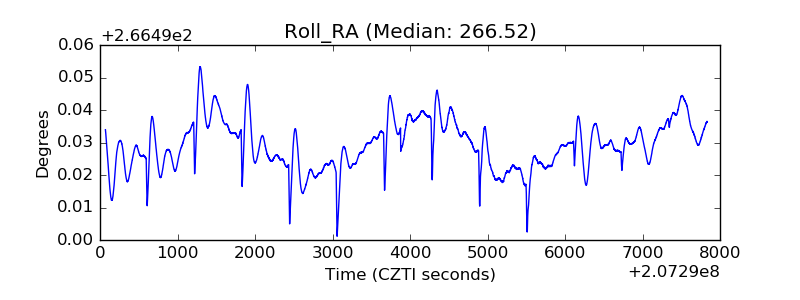 |
| Veto Counter | 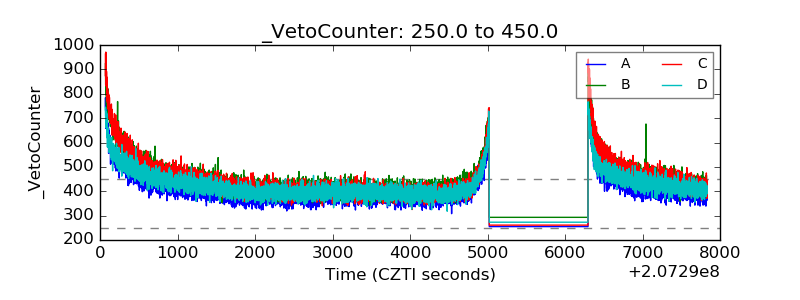 |