| Param | Original file | Final file |
|---|---|---|
| Filename | modeM0/AS1G05_253T03_9000000562_04489cztM0_level2.evt | modeM0/AS1G05_253T03_9000000562_04489cztM0_level2_quad_clean.evt |
| Size (bytes) | 777,764,160 | 120,072,960 |
| Size | 741.7 MB | 114.5 MB |
| Events in quadrant A | 5,453,295 | 718,064 |
| Events in quadrant B | 5,425,779 | 727,580 |
| Events in quadrant C | 5,916,109 | 728,042 |
| Events in quadrant D | 6,009,968 | 696,677 |
| Mode SS | |||
|---|---|---|---|
| Quadrant | BADHDUFLAG | Total packets | Discarded packets |
| A | 0 | 224 | 0 |
| B | 0 | 224 | 0 |
| C | 0 | 224 | 0 |
| D | 0 | 224 | 0 |
| Mode M9 | |||
|---|---|---|---|
| Quadrant | BADHDUFLAG | Total packets | Discarded packets |
| A | 0 | 21 | 0 |
| B | 0 | 21 | 0 |
| C | 0 | 21 | 0 |
| D | 0 | 21 | 0 |
| Mode M0 | |||
|---|---|---|---|
| Quadrant | BADHDUFLAG | Total packets | Discarded packets |
| A | 0 | 23626 | 3 |
| B | 0 | 23119 | 2 |
| C | 0 | 25166 | 2 |
| D | 0 | 25423 | 2 |
| Quadrant | Total seconds | Saturated seconds | Saturation percentage |
|---|---|---|---|
| A | 11065 | 254 | 2.295526% |
| B | 11065 | 229 | 2.069589% |
| C | 11065 | 405 | 3.660190% |
| D | 11065 | 268 | 2.422052% |
Noise dominated data is calculated using 1-second bins in cleaned event files. If a bin has >2000 counts, and if more than 50% of those come from <1% of pixels, then it is considered to be noise-dominated and hence unusable.
| Quadrant | # 1 sec bins | Bins with >0 counts | Bins with >2000 counts | High rate bins dominated by noise | Noise dominated (total time) | Noise dominated (detector-on time) | Marked lightcurve |
|---|---|---|---|---|---|---|---|
| A | 13095 | 11067 | 49 | 49 | 0.37% | 0.44% |  |
| B | 13095 | 11067 | 9 | 9 | 0.07% | 0.08% | 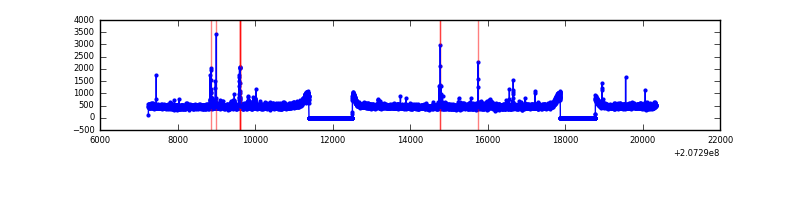 |
| C | 13095 | 11067 | 171 | 171 | 1.31% | 1.55% | 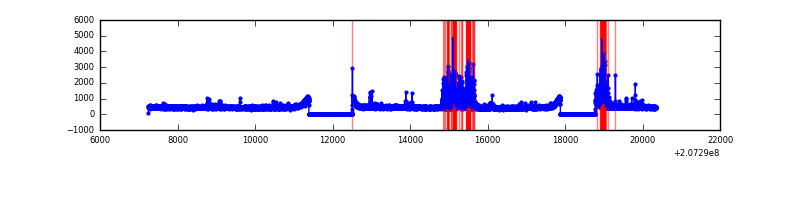 |
| D | 13095 | 11067 | 58 | 58 | 0.44% | 0.52% | 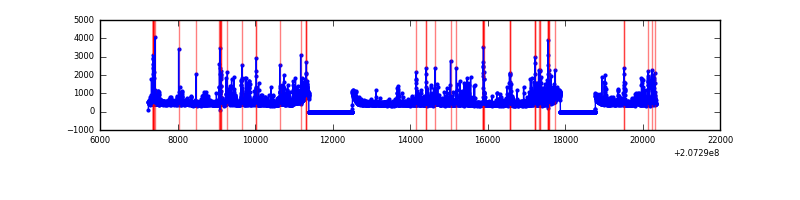 |
Top three noisy pixels from each quadrant. If the there are fewer than three noisy pixels in the level2.evt file, extra rows are filled as -1
| Pixel properties | Quadrant properties | ||||||
|---|---|---|---|---|---|---|---|
| Quadrant | DetID | PixID | Counts | Sigma | Mean | Median | Sigma |
| A | 0 | 118 | 197883 | 727.53 | 1327 | 1297 | 270.2 |
| A | 8 | 15 | 73543 | 267.37 | 1327 | 1297 | 270.2 |
| A | 0 | 226 | 33636 | 119.68 | 1327 | 1297 | 270.2 |
| B | 15 | 204 | 145847 | 558.59 | 1346 | 1315 | 258.7 |
| B | 4 | 48 | 34875 | 129.7 | 1346 | 1315 | 258.7 |
| B | 5 | 70 | 28565 | 105.32 | 1346 | 1315 | 258.7 |
| C | 9 | 247 | 581433 | 1930.7 | 1291 | 1301 | 300.5 |
| C | 9 | 54 | 253482 | 839.27 | 1291 | 1301 | 300.5 |
| C | 9 | 16 | 32282 | 103.11 | 1291 | 1301 | 300.5 |
| D | 13 | 235 | 425369 | 1368.68 | 1289 | 1250 | 309.9 |
| D | 14 | 34 | 305203 | 980.89 | 1289 | 1250 | 309.9 |
| D | 12 | 233 | 150179 | 480.61 | 1289 | 1250 | 309.9 |
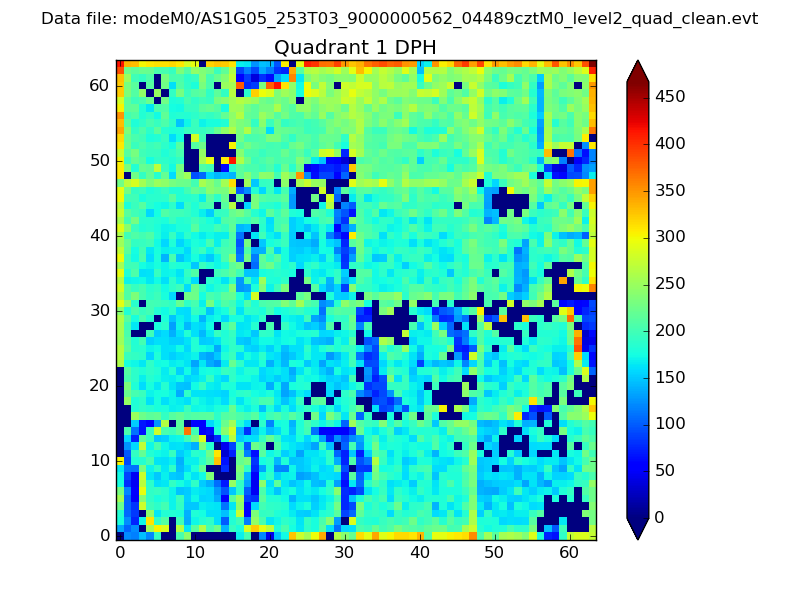
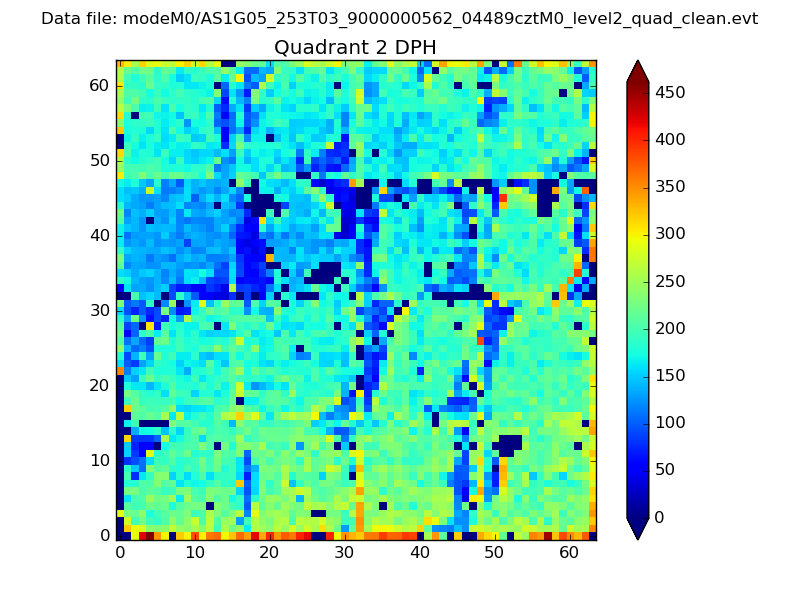
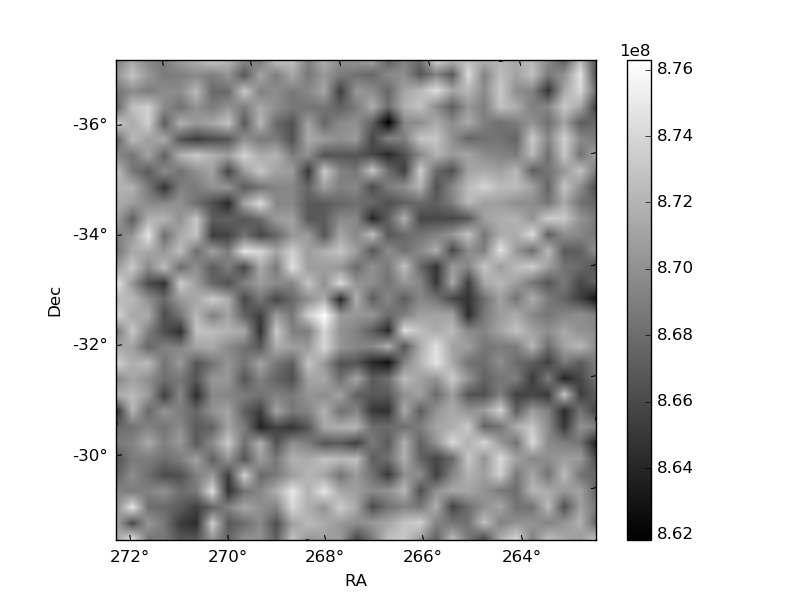
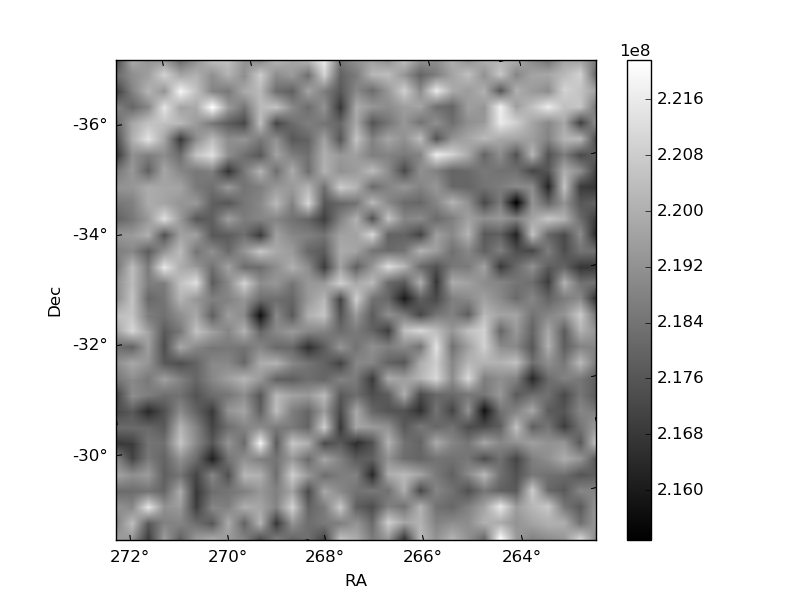
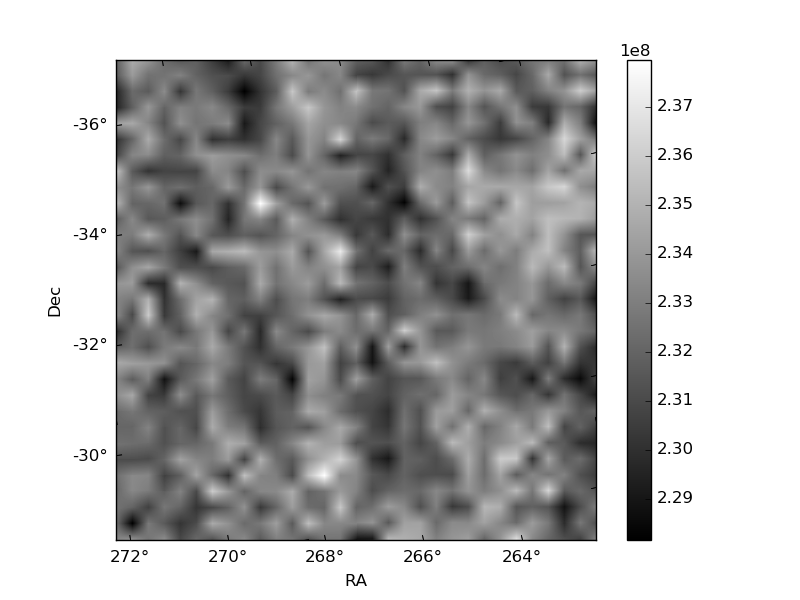
Histogram calculated using DETX and DETY for each event in the final _common_clean file
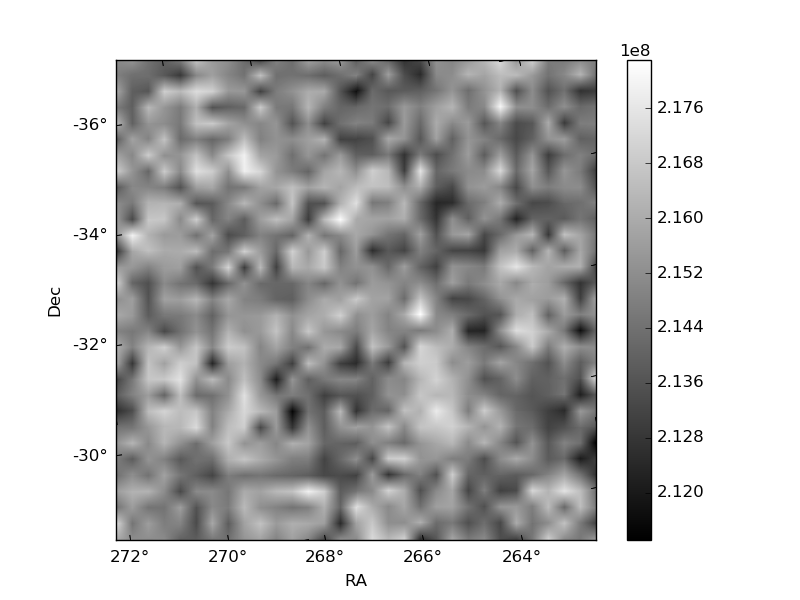
| Quadrant A | 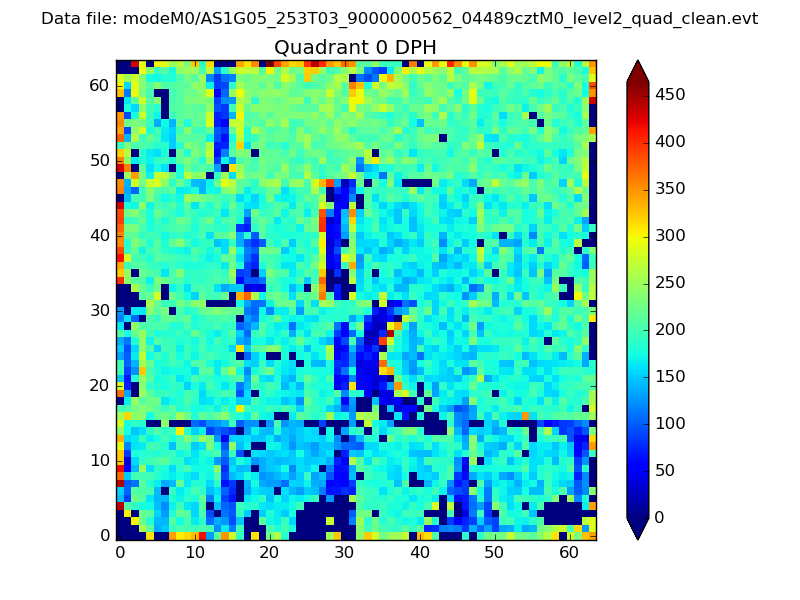 |
 |
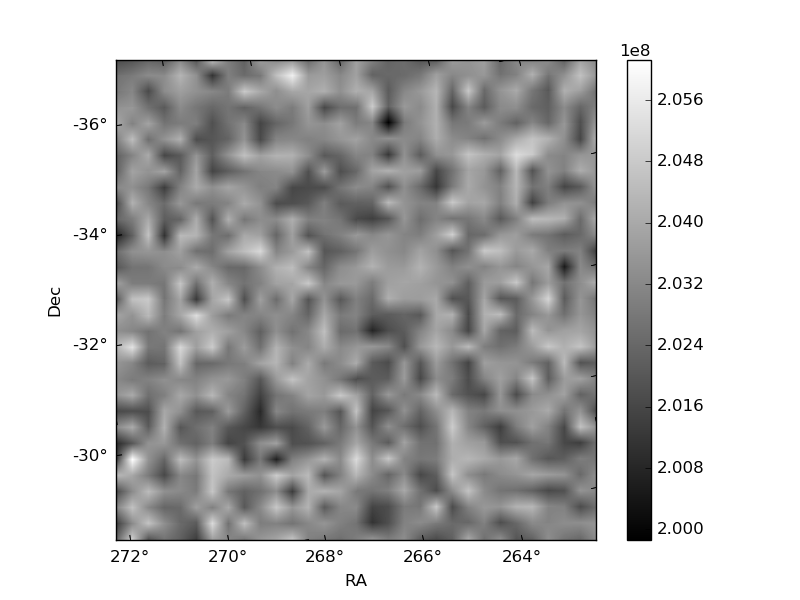
Quadrant B |
|---|---|---|---|
| Quadrant D | 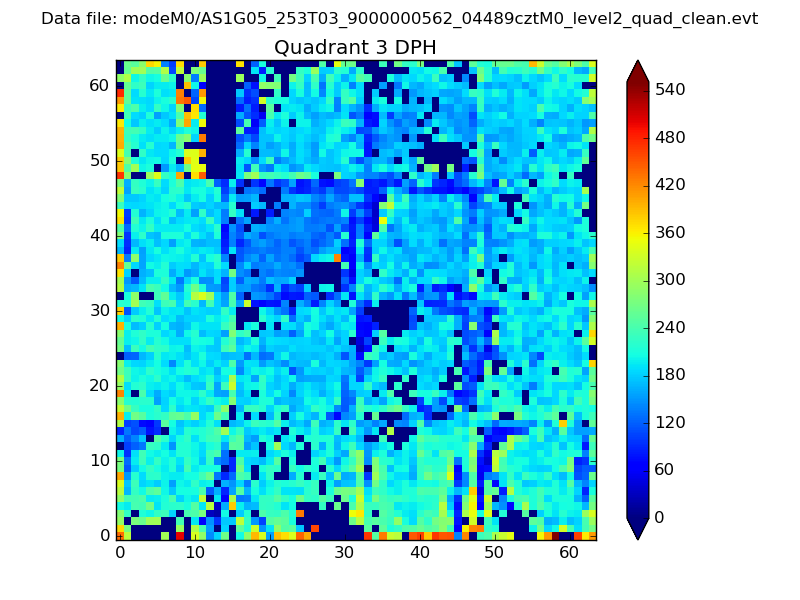 |
 |
Quadrant C |
| Plot type | Count rate plots | Images |
|---|---|---|
| Comparison with Poisson distribution Blue bars denote a histogram of data divided into 1 sec bins. Red curve is a Poisson curve with rate = median count rate of data. |
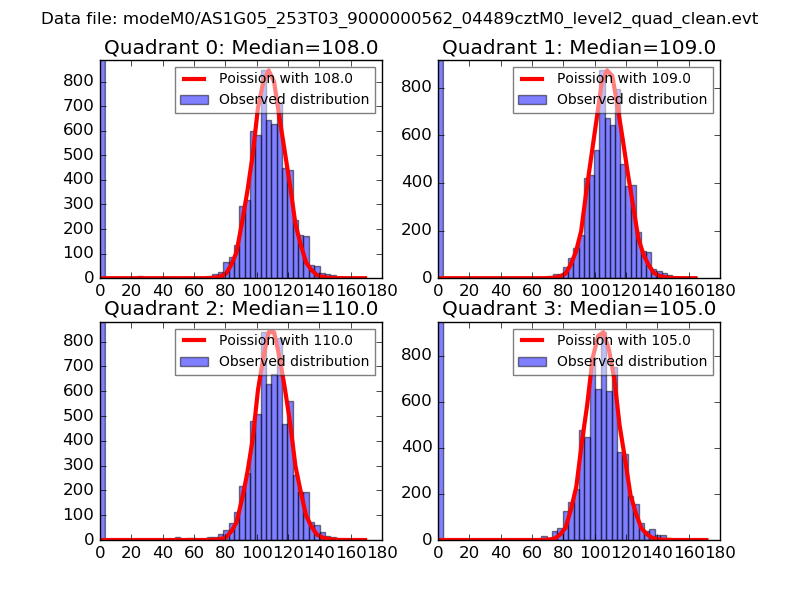 |
 |
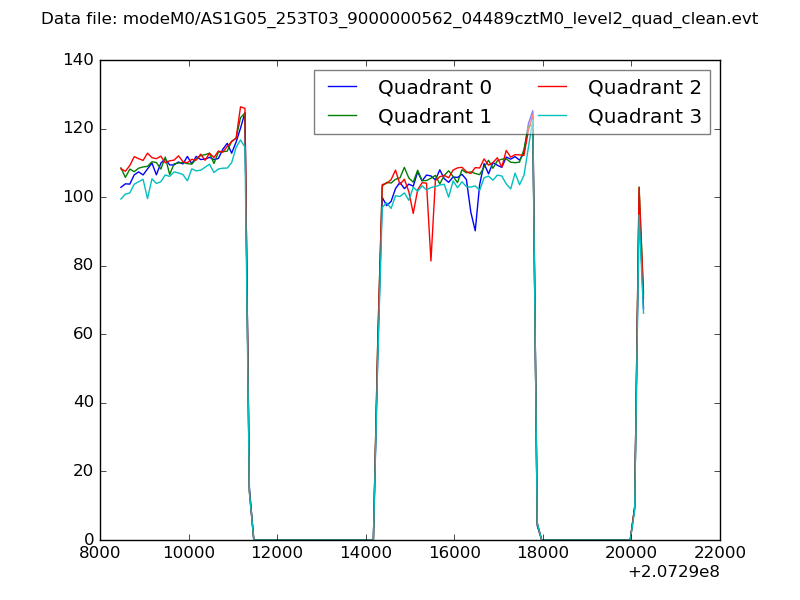
| Quadrant-wise count rates Data is divided into 100 sec bins |
 |
|
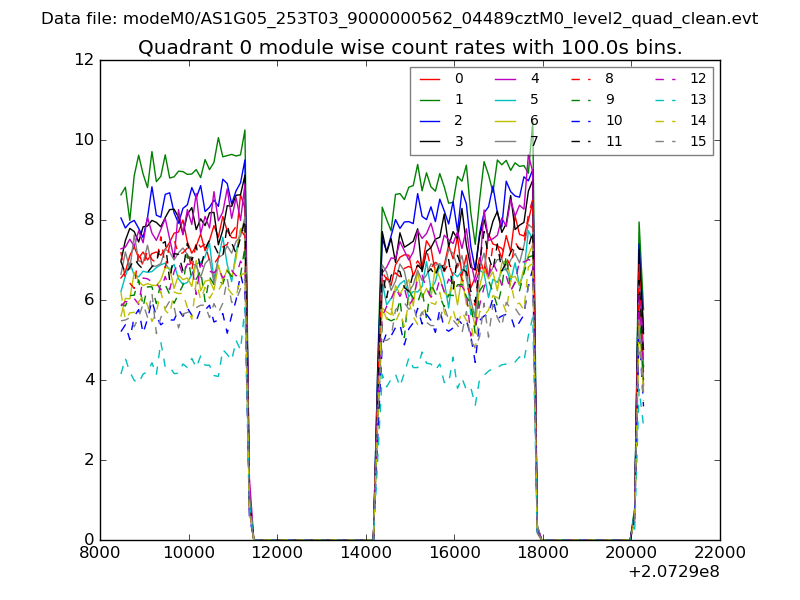
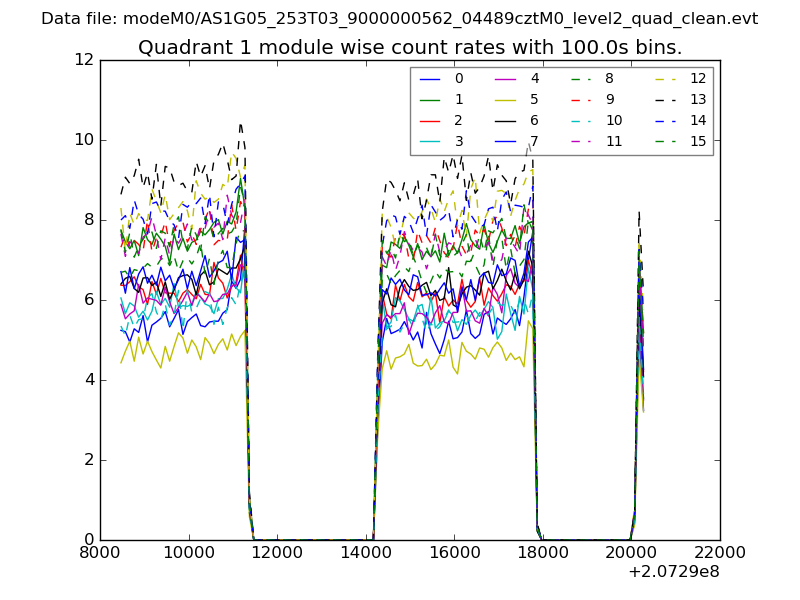
| Module-wise count rates for Quadrant A Data is divided into 100 sec bins |
 |
 |
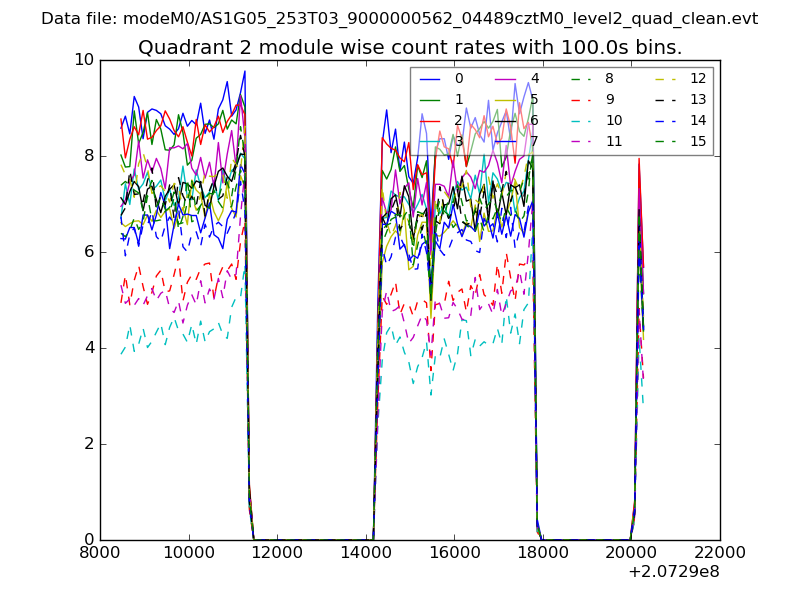
| Module-wise count rates for Quadrant B Data is divided into 100 sec bins |
 |
 |
| Module-wise count rates for Quadrant C Data is divided into 100 sec bins |
 |
 |
| Module-wise count rates for Quadrant D Data is divided into 100 sec bins |
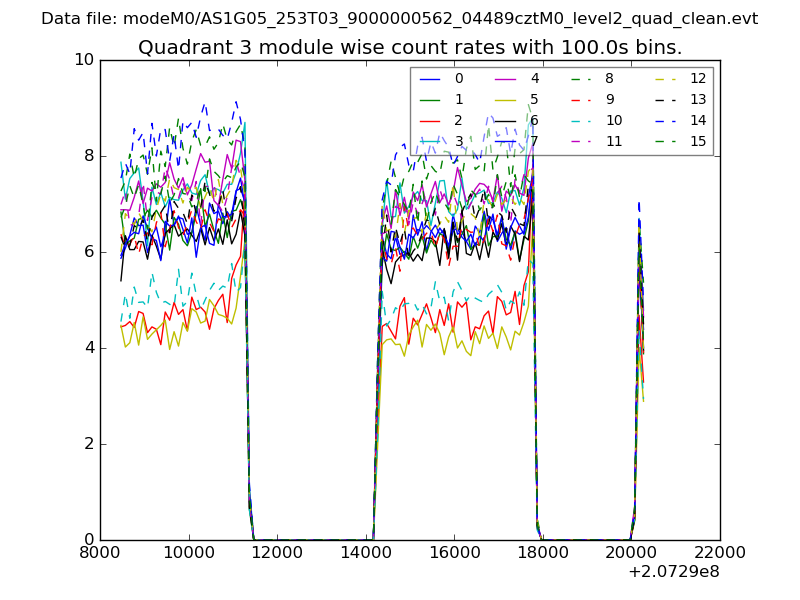 |
 |
| Parameter | Plot |
|---|---|
| CZT HV Monitor | 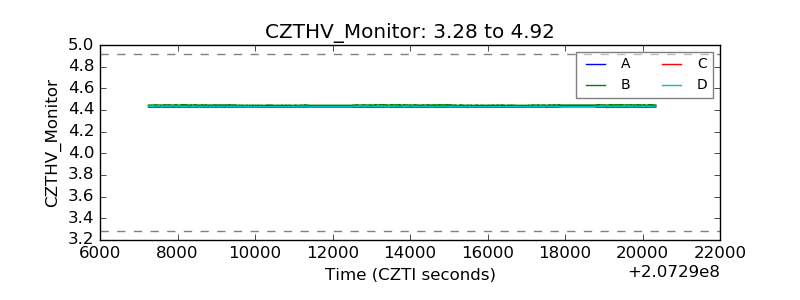 |
| D_VDD | 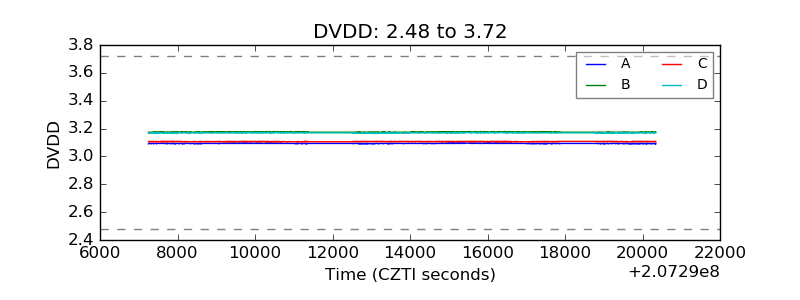 |
| Temperature 1 | 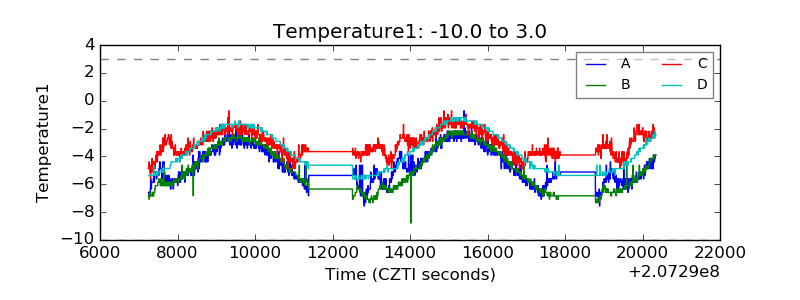 |
| Veto HV Monitor | 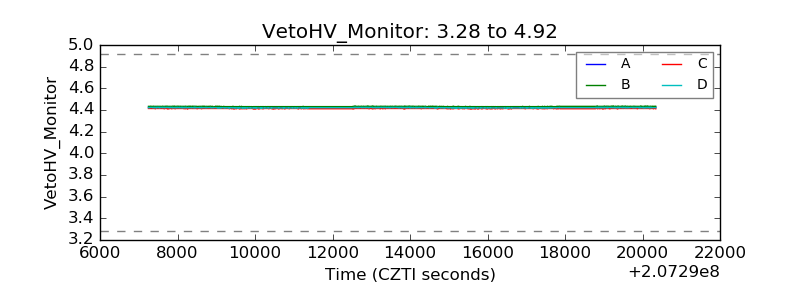 |
| Veto LLD | 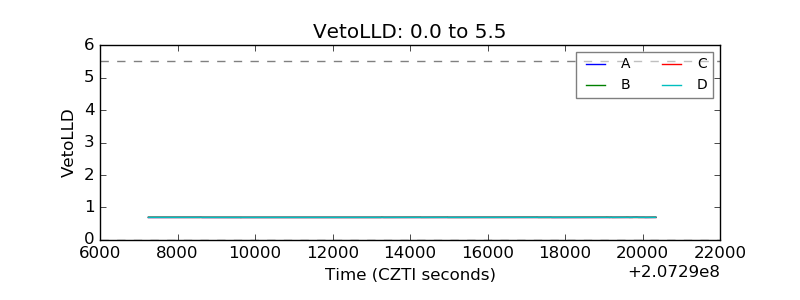 |
| Alpha Counter | 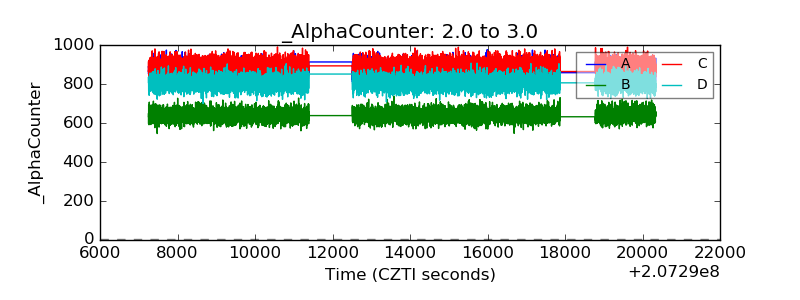 |
| _CPM_Rate | 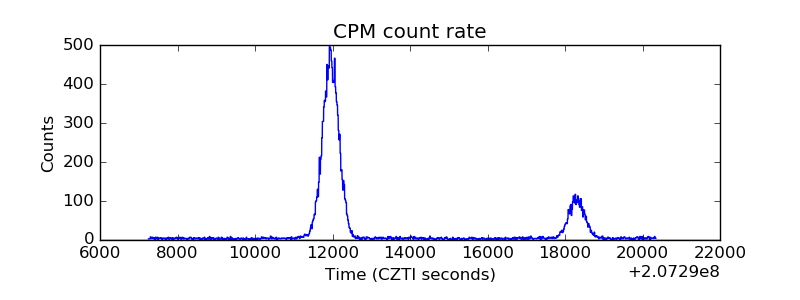 |
| CZT Counter | 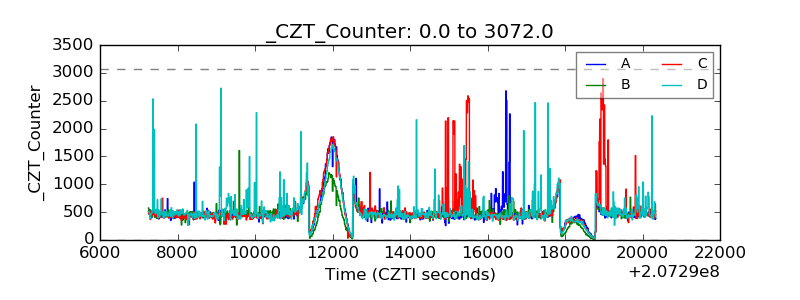 |
| +2.5 Volts monitor |  |
| +5 Volts monitor |  |
| _ROLL_ROT | 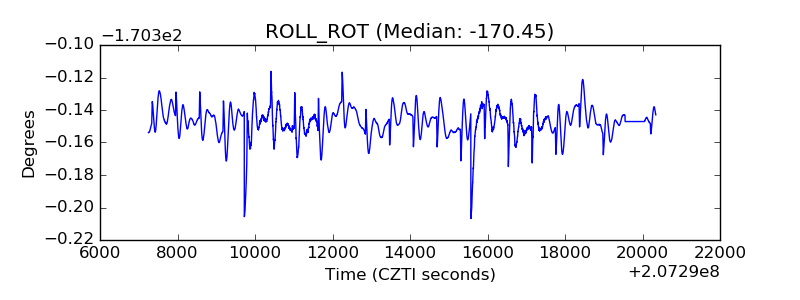 |
| _Roll_DEC | 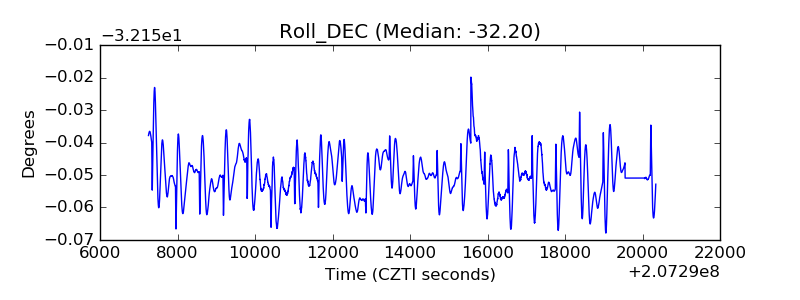 |
| _Roll_RA | 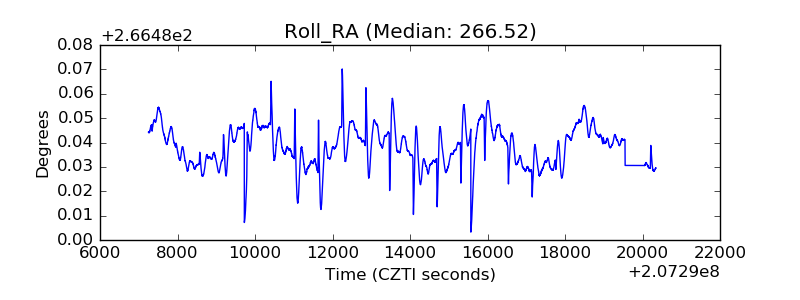 |
| Veto Counter | 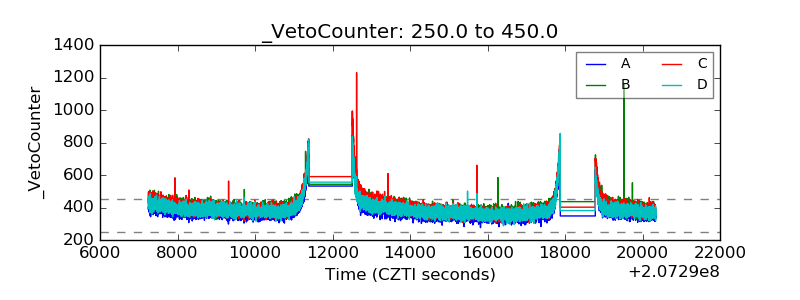 |