| Param | Original file | Final file |
|---|---|---|
| Filename | modeM0/AS1G05_253T03_9000000562_04491cztM0_level2.evt | modeM0/AS1G05_253T03_9000000562_04491cztM0_level2_quad_clean.evt |
| Size (bytes) | 516,222,720 | 78,312,960 |
| Size | 492.3 MB | 74.7 MB |
| Events in quadrant A | 4,102,409 | 461,740 |
| Events in quadrant B | 3,614,927 | 470,959 |
| Events in quadrant C | 3,398,363 | 475,723 |
| Events in quadrant D | 4,018,064 | 451,109 |
| Mode SS | |||
|---|---|---|---|
| Quadrant | BADHDUFLAG | Total packets | Discarded packets |
| A | 0 | 148 | 0 |
| B | 0 | 148 | 0 |
| C | 0 | 148 | 0 |
| D | 0 | 148 | 0 |
| Mode M0 | |||
|---|---|---|---|
| Quadrant | BADHDUFLAG | Total packets | Discarded packets |
| A | 0 | 17311 | 2 |
| B | 0 | 15625 | 3 |
| C | 0 | 15275 | 1 |
| D | 0 | 17168 | 5 |
| Quadrant | Total seconds | Saturated seconds | Saturation percentage |
|---|---|---|---|
| A | 7351 | 514 | 6.992246% |
| B | 7350 | 303 | 4.122449% |
| C | 7351 | 190 | 2.584682% |
| D | 7349 | 325 | 4.422370% |
Noise dominated data is calculated using 1-second bins in cleaned event files. If a bin has >2000 counts, and if more than 50% of those come from <1% of pixels, then it is considered to be noise-dominated and hence unusable.
| Quadrant | # 1 sec bins | Bins with >0 counts | Bins with >2000 counts | High rate bins dominated by noise | Noise dominated (total time) | Noise dominated (detector-on time) | Marked lightcurve |
|---|---|---|---|---|---|---|---|
| A | 7366 | 7352 | 134 | 134 | 1.82% | 1.82% | 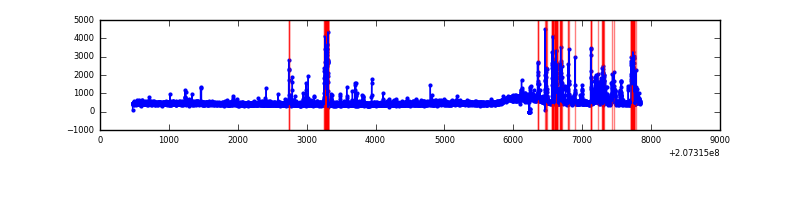 |
| B | 7366 | 7352 | 7 | 7 | 0.10% | 0.10% | 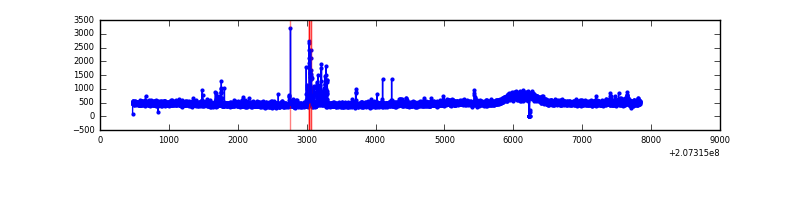 |
| C | 7366 | 7352 | 0 | 0 | 0.00% | 0.00% | 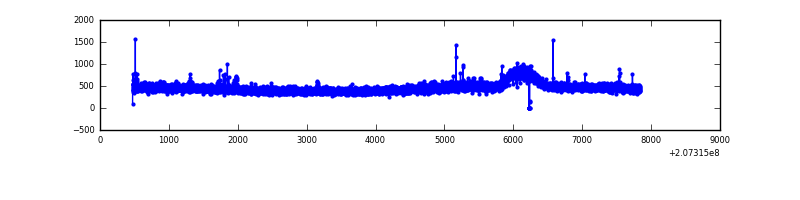 |
| D | 7366 | 7352 | 88 | 88 | 1.19% | 1.20% | 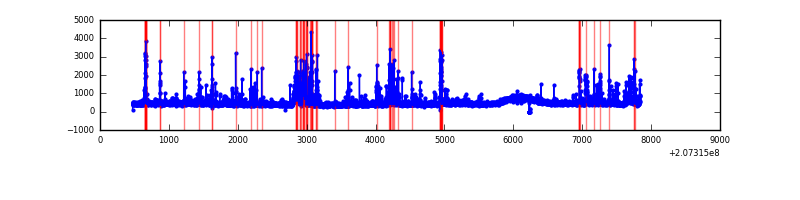 |
Top three noisy pixels from each quadrant. If the there are fewer than three noisy pixels in the level2.evt file, extra rows are filled as -1
| Pixel properties | Quadrant properties | ||||||
|---|---|---|---|---|---|---|---|
| Quadrant | DetID | PixID | Counts | Sigma | Mean | Median | Sigma |
| A | 0 | 13 | 545463 | 3042.19 | 861 | 840 | 179.0 |
| A | 0 | 118 | 157735 | 876.39 | 861 | 840 | 179.0 |
| A | 7 | 16 | 39764 | 217.42 | 861 | 840 | 179.0 |
| B | 8 | 3 | 93578 | 547.39 | 880 | 857 | 169.4 |
| B | 15 | 204 | 61887 | 360.29 | 880 | 857 | 169.4 |
| B | 4 | 170 | 27318 | 156.21 | 880 | 857 | 169.4 |
| C | 14 | 48 | 23913 | 115.11 | 854 | 856 | 200.3 |
| C | 9 | 54 | 14608 | 68.65 | 854 | 856 | 200.3 |
| C | 9 | 16 | 7273 | 32.04 | 854 | 856 | 200.3 |
| D | 13 | 235 | 307915 | 1485.22 | 847 | 821 | 206.8 |
| D | 14 | 34 | 171573 | 825.82 | 847 | 821 | 206.8 |
| D | 2 | 136 | 86275 | 413.29 | 847 | 821 | 206.8 |
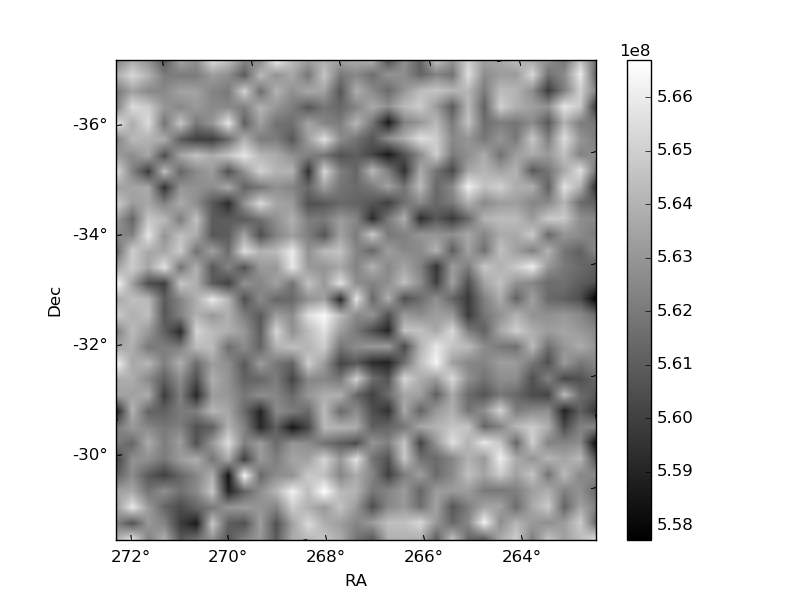
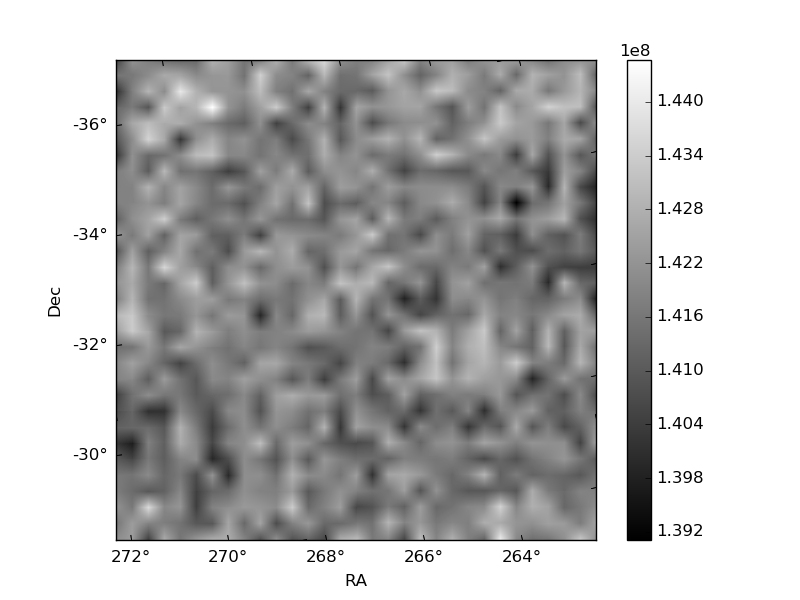
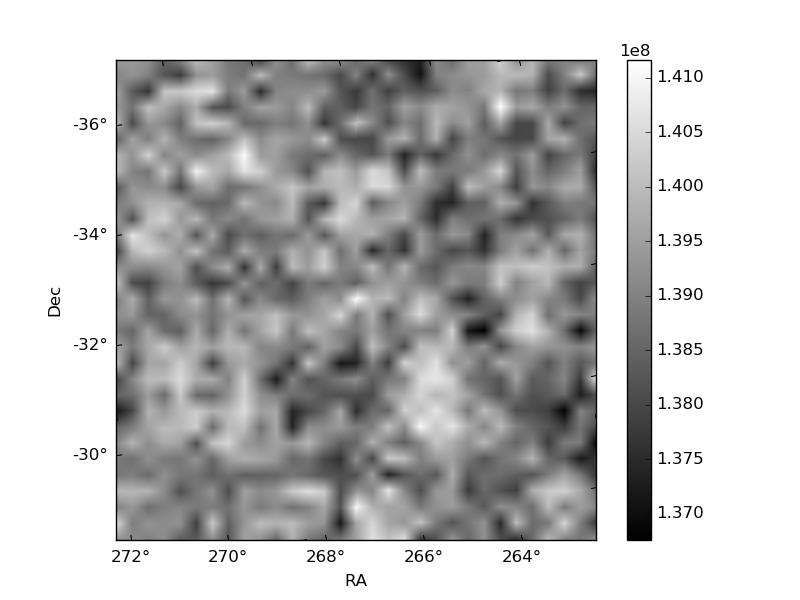
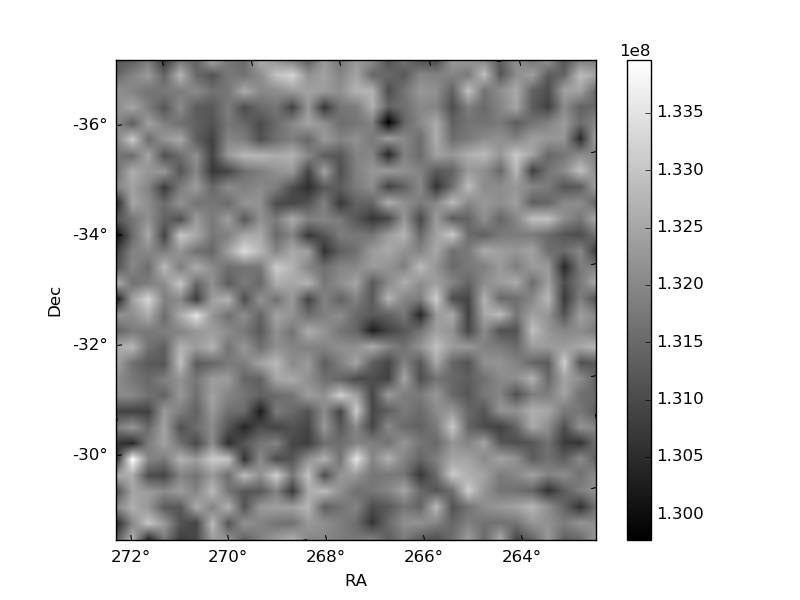
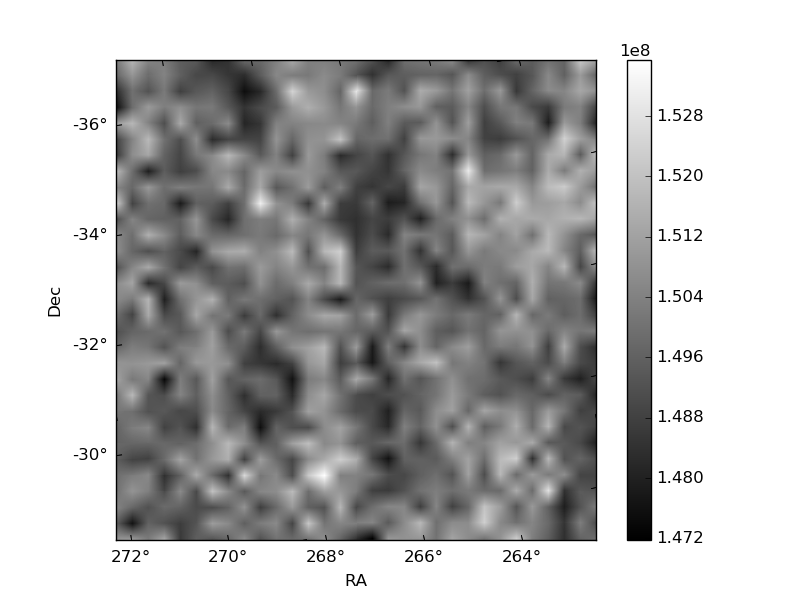
Histogram calculated using DETX and DETY for each event in the final _common_clean file
| Quadrant A | 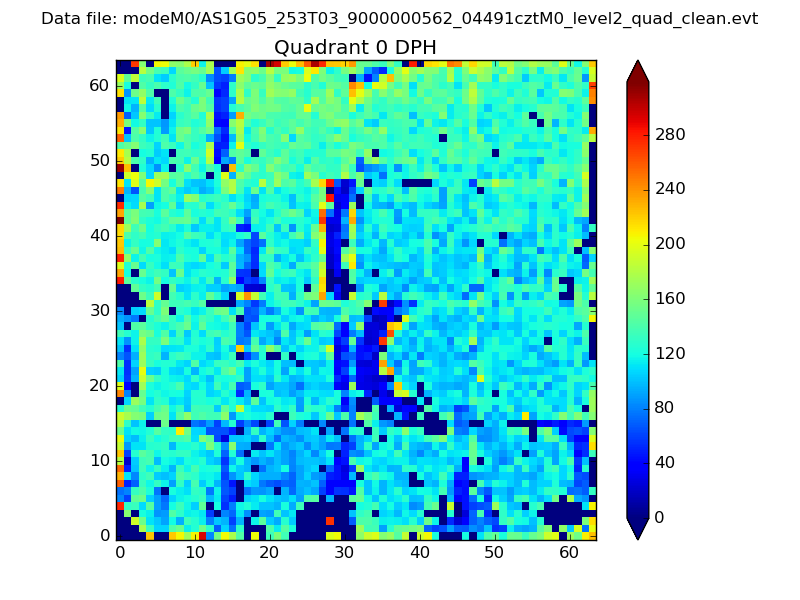 |
 |
Quadrant B |
|---|---|---|---|
| Quadrant D | 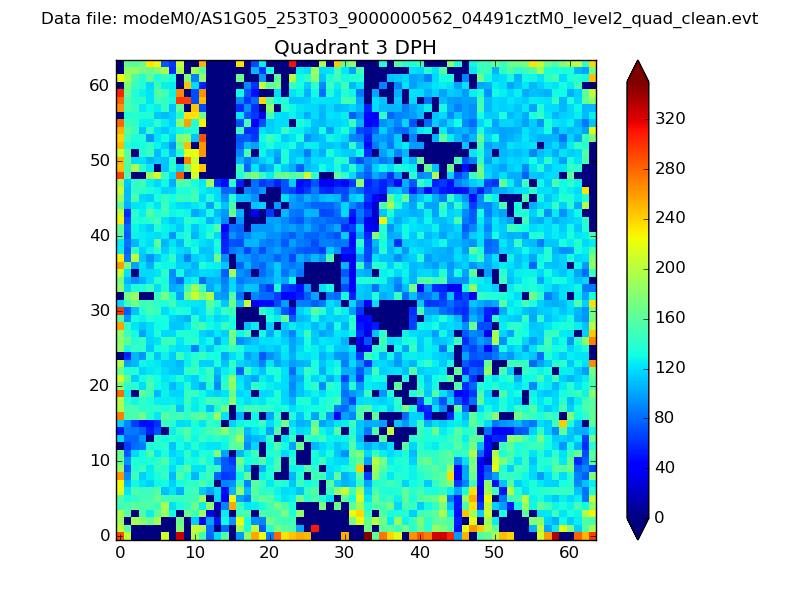 |
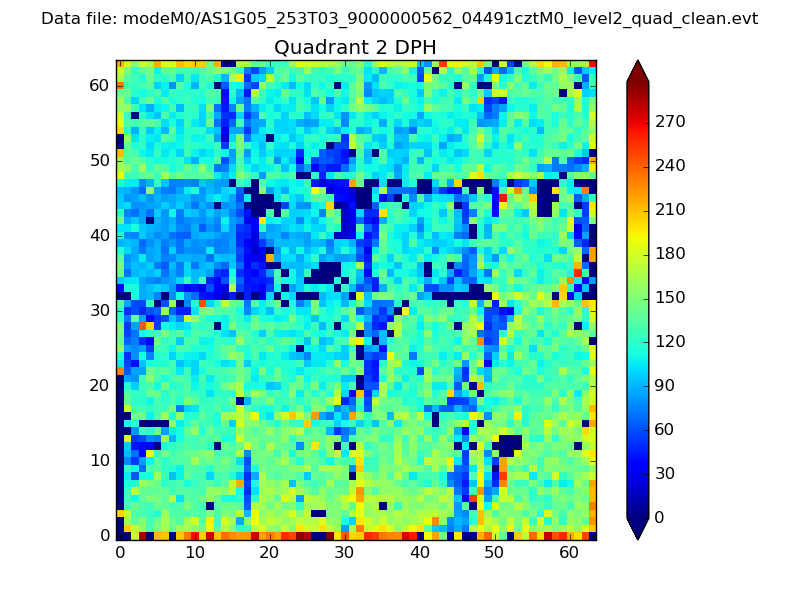 |
Quadrant C |
| Plot type | Count rate plots | Images |
|---|---|---|
| Comparison with Poisson distribution Blue bars denote a histogram of data divided into 1 sec bins. Red curve is a Poisson curve with rate = median count rate of data. |
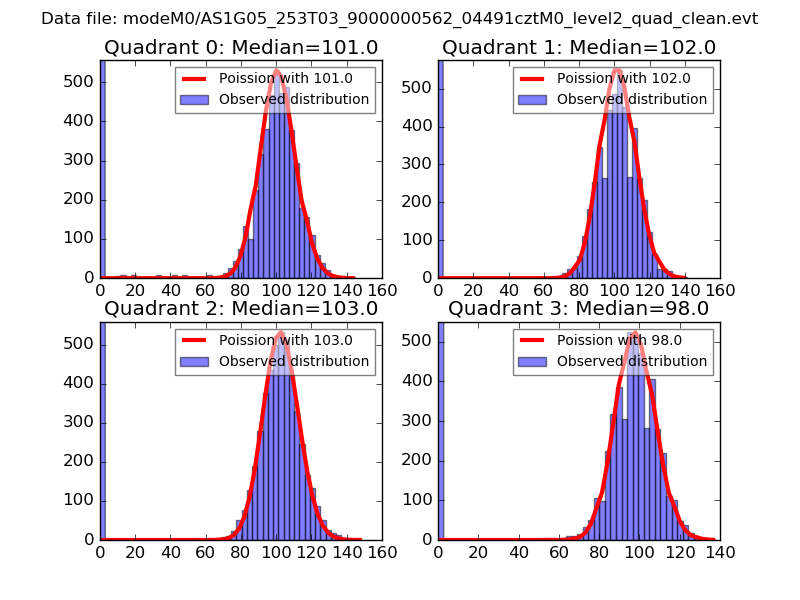 |
 |
| Quadrant-wise count rates Data is divided into 100 sec bins |
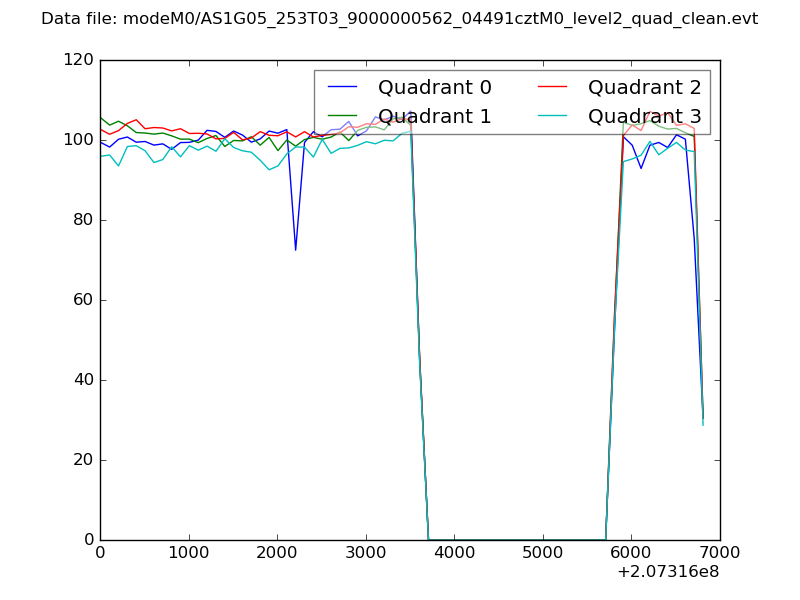 |
|
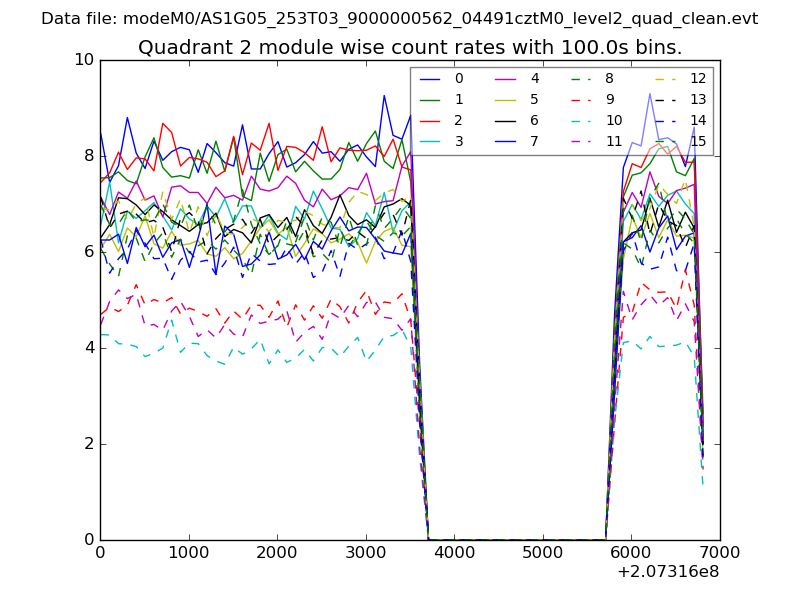
| Module-wise count rates for Quadrant A Data is divided into 100 sec bins |
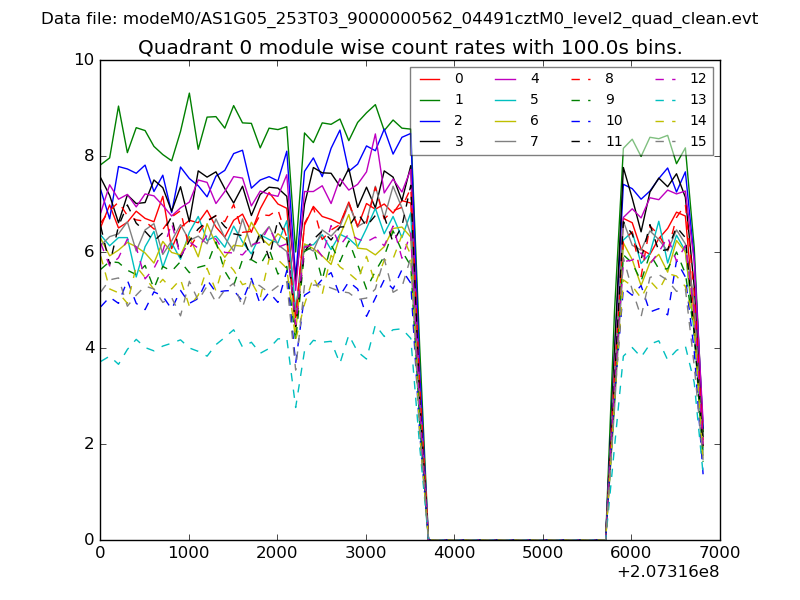 |
 |
| Module-wise count rates for Quadrant B Data is divided into 100 sec bins |
 |
 |
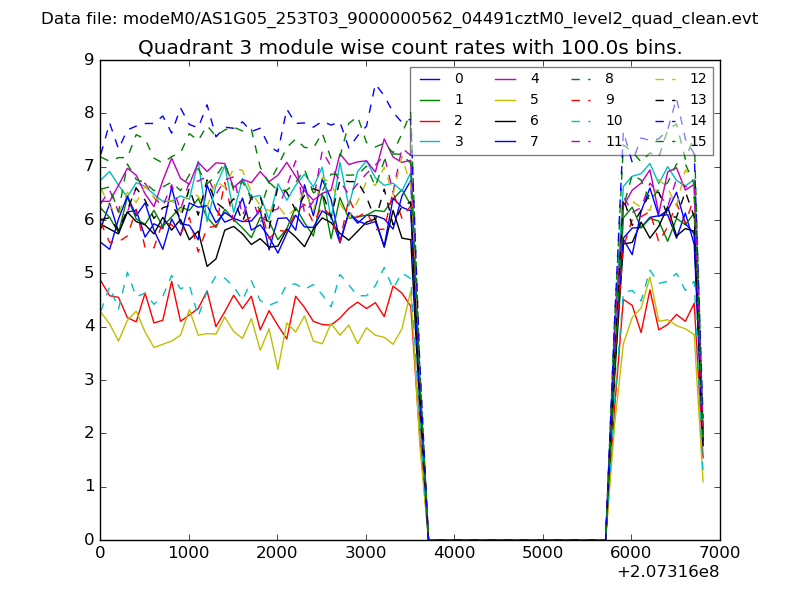
| Module-wise count rates for Quadrant C Data is divided into 100 sec bins |
 |
 |
| Module-wise count rates for Quadrant D Data is divided into 100 sec bins |
 |
 |
| Parameter | Plot |
|---|---|
| CZT HV Monitor | 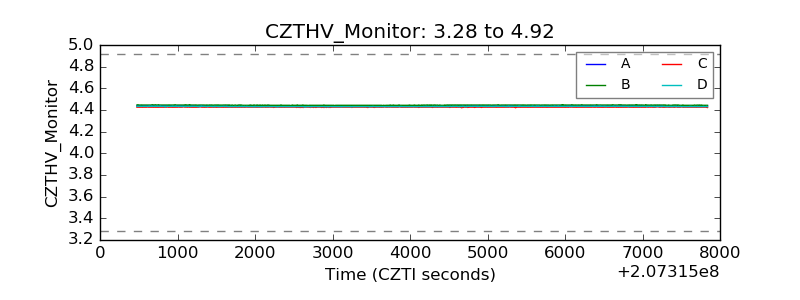 |
| D_VDD | 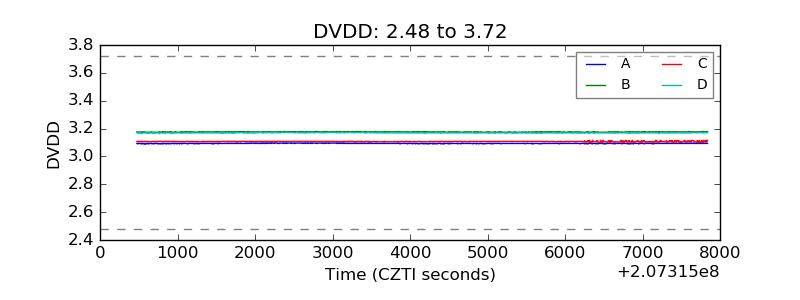 |
| Temperature 1 | 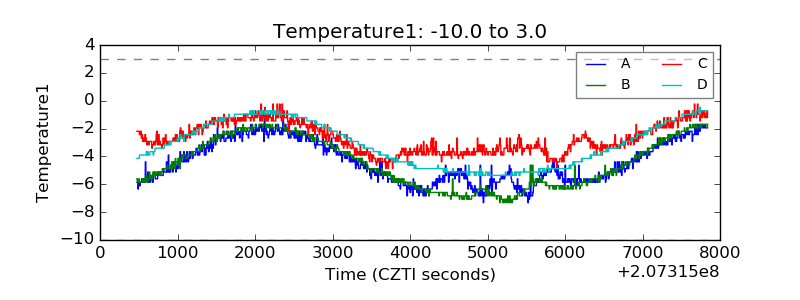 |
| Veto HV Monitor | 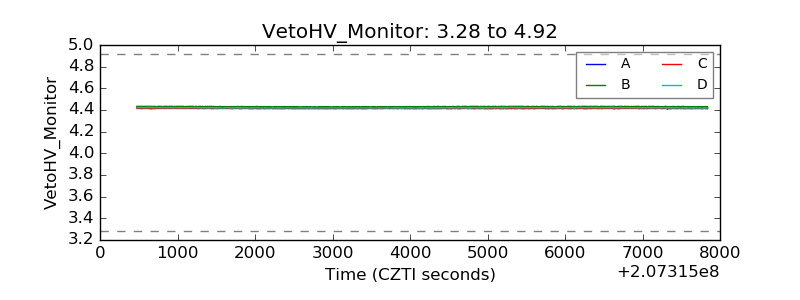 |
| Veto LLD | 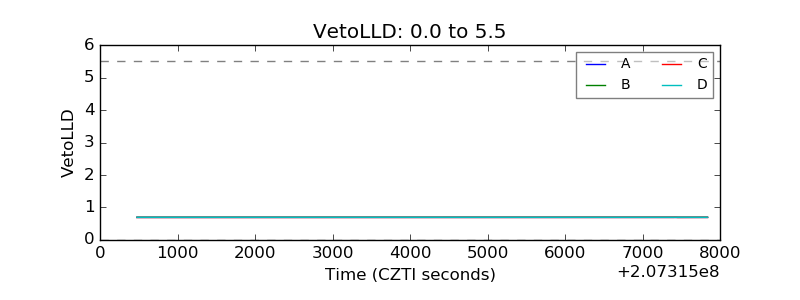 |
| Alpha Counter | 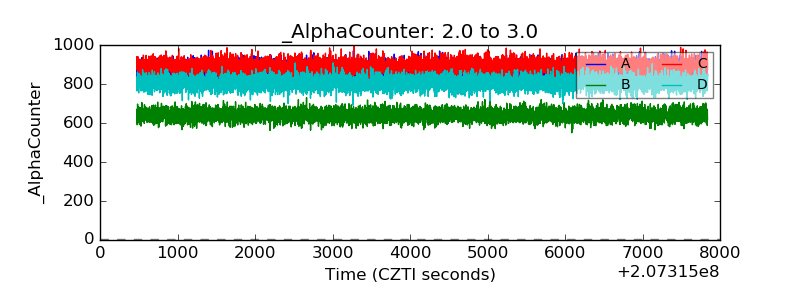 |
| _CPM_Rate | 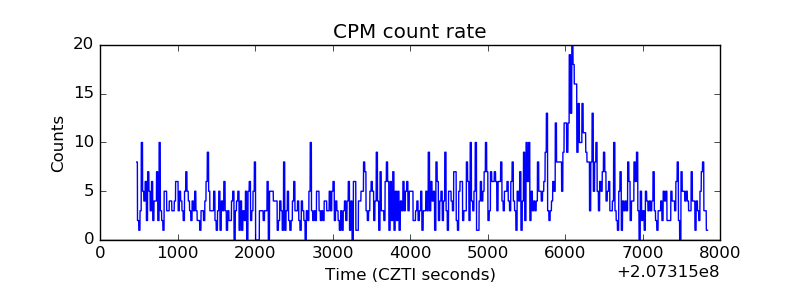 |
| CZT Counter | 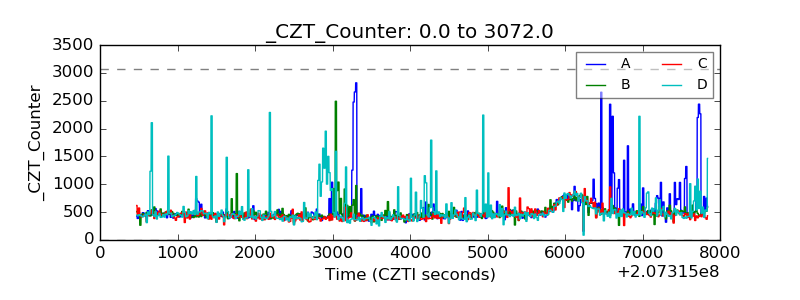 |
| +2.5 Volts monitor |  |
| +5 Volts monitor | 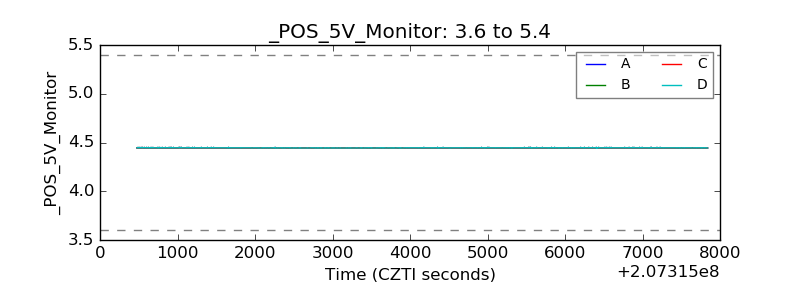 |
| _ROLL_ROT | 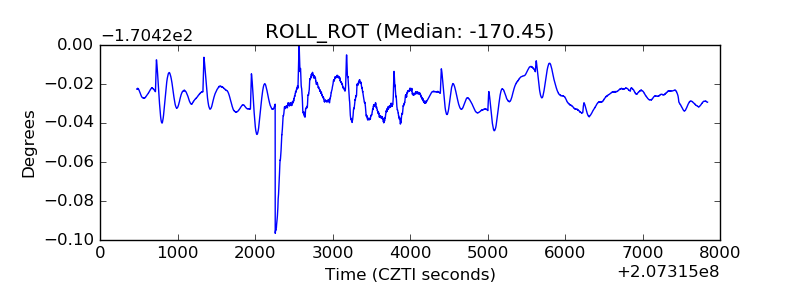 |
| _Roll_DEC | 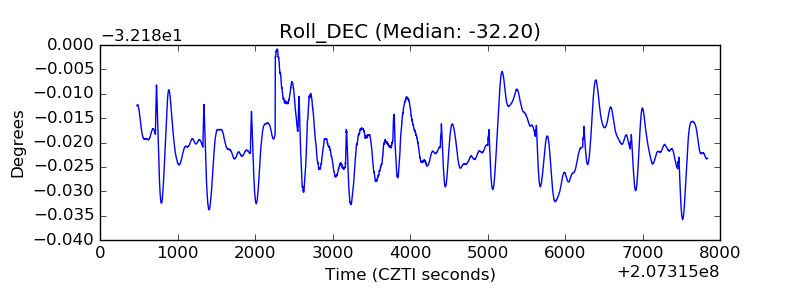 |
| _Roll_RA | 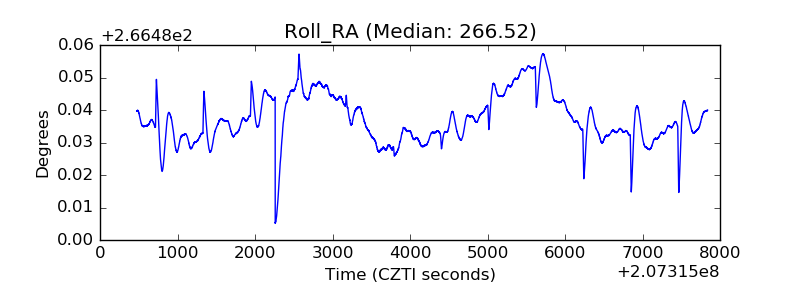 |
| Veto Counter | 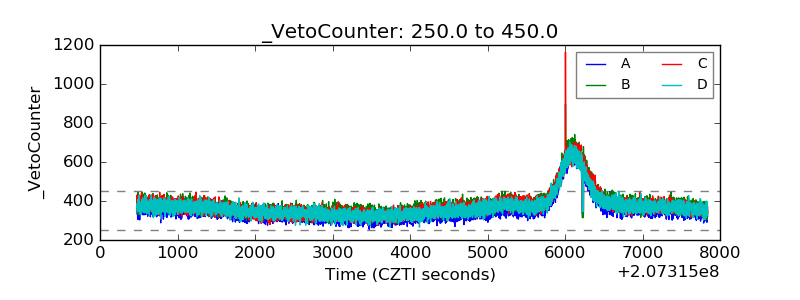 |