| Param | Original file | Final file |
|---|---|---|
| Filename | modeM0/AS1G05_253T03_9000000562_04495cztM0_level2.evt | modeM0/AS1G05_253T03_9000000562_04495cztM0_level2_quad_clean.evt |
| Size (bytes) | 743,040 | 437,760 |
| Size | 725.6 KB | 427.5 KB |
| Events in quadrant A | 7,301 | 1,491 |
| Events in quadrant B | 6,112 | 1,349 |
| Events in quadrant C | 2,200 | 548 |
| Events in quadrant D | 2,981 | 604 |
| Mode SS | |||
|---|---|---|---|
| Quadrant | BADHDUFLAG | Total packets | Discarded packets |
| A | 0 | 23 | 23 |
| B | 0 | 24 | 22 |
| C | 0 | 22 | 20 |
| D | 0 | 22 | 20 |
| Mode M0 | |||
|---|---|---|---|
| Quadrant | BADHDUFLAG | Total packets | Discarded packets |
| A | 0 | 2462 | 2432 |
| B | 0 | 2267 | 2241 |
| C | 0 | 2353 | 2343 |
| D | 0 | 2521 | 2509 |
| Quadrant | Total seconds | Saturated seconds | Saturation percentage |
|---|---|---|---|
| A | 15 | 0 | 0.000000% |
| B | 13 | 0 | 0.000000% |
| C | 5 | 0 | 0.000000% |
| D | 6 | 0 | 0.000000% |
Noise dominated data is calculated using 1-second bins in cleaned event files. If a bin has >2000 counts, and if more than 50% of those come from <1% of pixels, then it is considered to be noise-dominated and hence unusable.
| Quadrant | # 1 sec bins | Bins with >0 counts | Bins with >2000 counts | High rate bins dominated by noise | Noise dominated (total time) | Noise dominated (detector-on time) | Marked lightcurve |
|---|---|---|---|---|---|---|---|
| A | 580 | 28 | 0 | 0 | 0.00% | 0.00% |  |
| B | 886 | 24 | 0 | 0 | 0.00% | 0.00% |  |
| C | 693 | 9 | 0 | 0 | 0.00% | 0.00% |  |
| D | 607 | 11 | 0 | 0 | 0.00% | 0.00% |  |
Top three noisy pixels from each quadrant. If the there are fewer than three noisy pixels in the level2.evt file, extra rows are filled as -1
| Pixel properties | Quadrant properties | ||||||
|---|---|---|---|---|---|---|---|
| Quadrant | DetID | PixID | Counts | Sigma | Mean | Median | Sigma |
| A | 0 | 13 | 283 | 261.28 | 1 | 1 | 1.1 |
| A | 8 | 15 | 224 | 206.61 | 1 | 1 | 1.1 |
| A | 0 | 50 | 53 | 48.18 | 1 | 1 | 1.1 |
| B | 15 | 204 | 76 | 80.39 | 1 | 1 | 0.9 |
| B | 4 | 48 | 64 | 67.53 | 1 | 1 | 0.9 |
| B | 15 | 54 | 36 | 37.51 | 1 | 1 | 0.9 |
| C | 14 | 48 | 22 | 32.89 | 0 | 0 | 0.7 |
| C | 9 | 247 | 18 | 26.91 | 0 | 0 | 0.7 |
| C | 14 | 67 | 4 | 5.98 | 0 | 0 | 0.7 |
| D | 14 | 34 | 225 | 279.56 | 0 | 0 | 0.8 |
| D | 2 | 63 | 62 | 77.03 | 0 | 0 | 0.8 |
| D | 12 | 22 | 15 | 18.64 | 0 | 0 | 0.8 |
Histogram calculated using DETX and DETY for each event in the final _common_clean file
| Quadrant A |  |
 |
Quadrant B |
|---|---|---|---|
| Quadrant D |  |
 |
Quadrant C |
| Plot type | Count rate plots | Images |
|---|---|---|
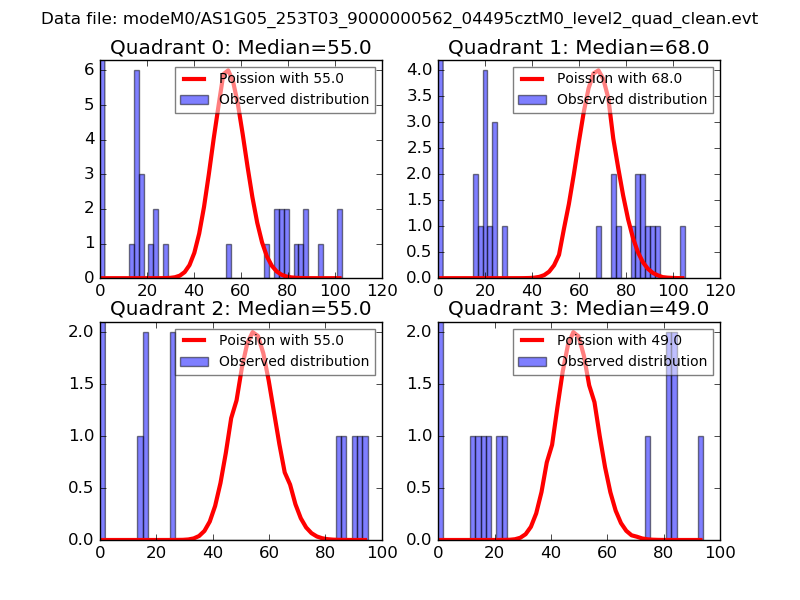
| Comparison with Poisson distribution Blue bars denote a histogram of data divided into 1 sec bins. Red curve is a Poisson curve with rate = median count rate of data. |
 |
 |
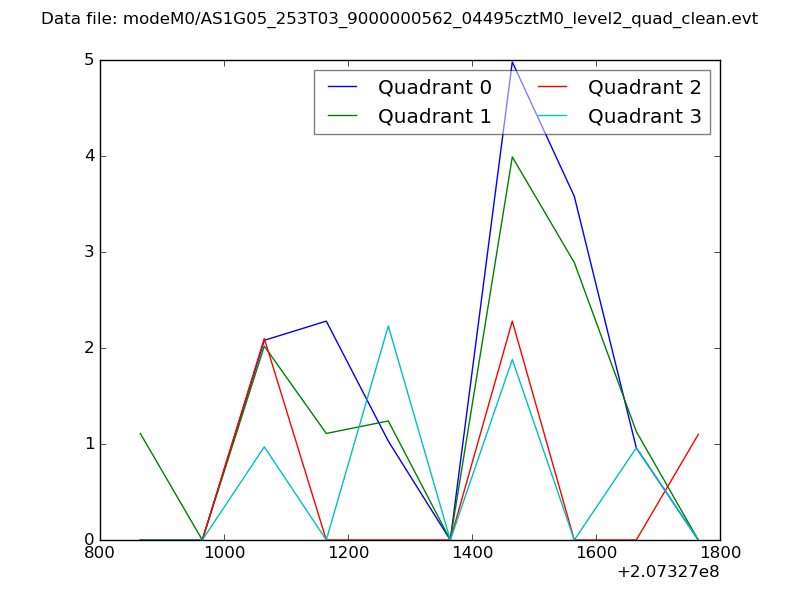
| Quadrant-wise count rates Data is divided into 100 sec bins |
 |
|
| Module-wise count rates for Quadrant A Data is divided into 100 sec bins |
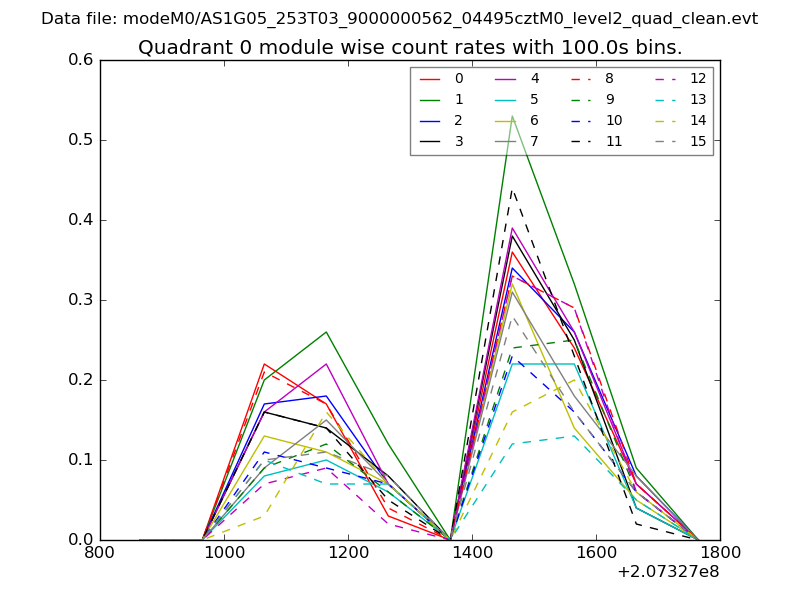 |
 |
| Module-wise count rates for Quadrant B Data is divided into 100 sec bins |
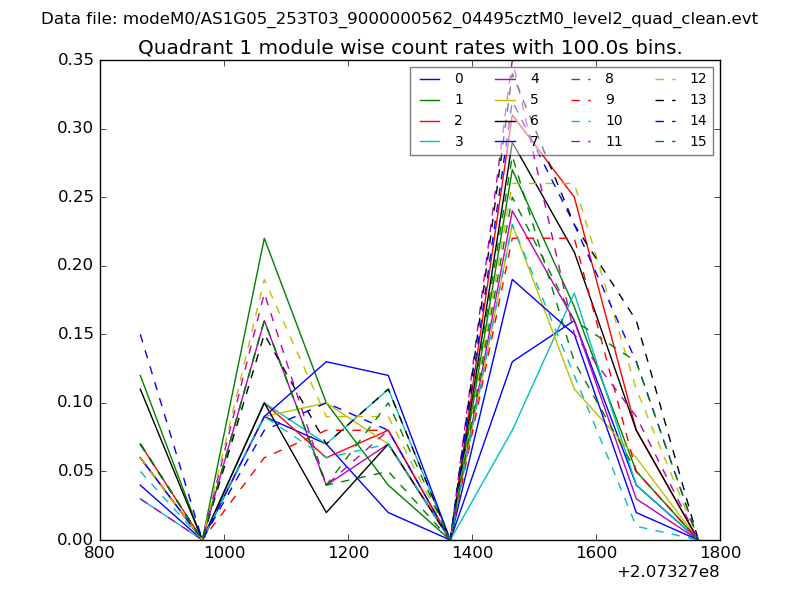 |
 |
| Module-wise count rates for Quadrant C Data is divided into 100 sec bins |
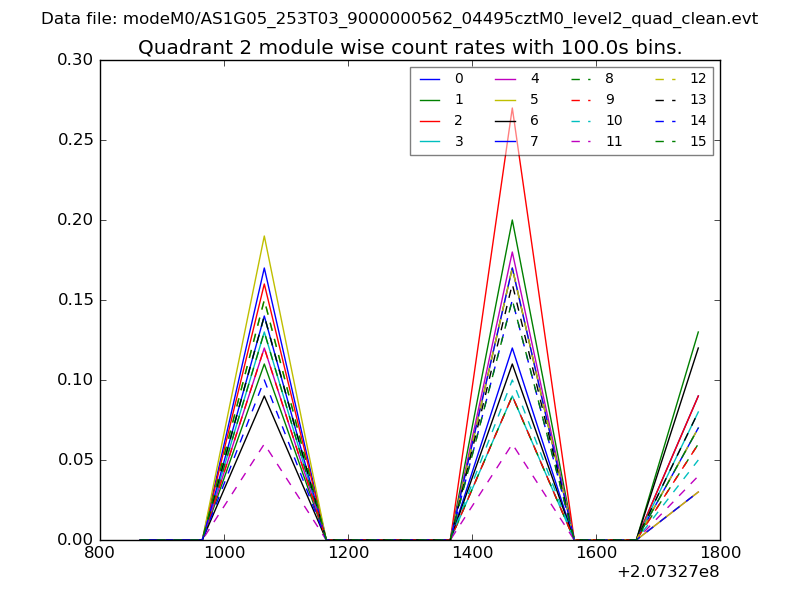 |
 |
| Module-wise count rates for Quadrant D Data is divided into 100 sec bins |
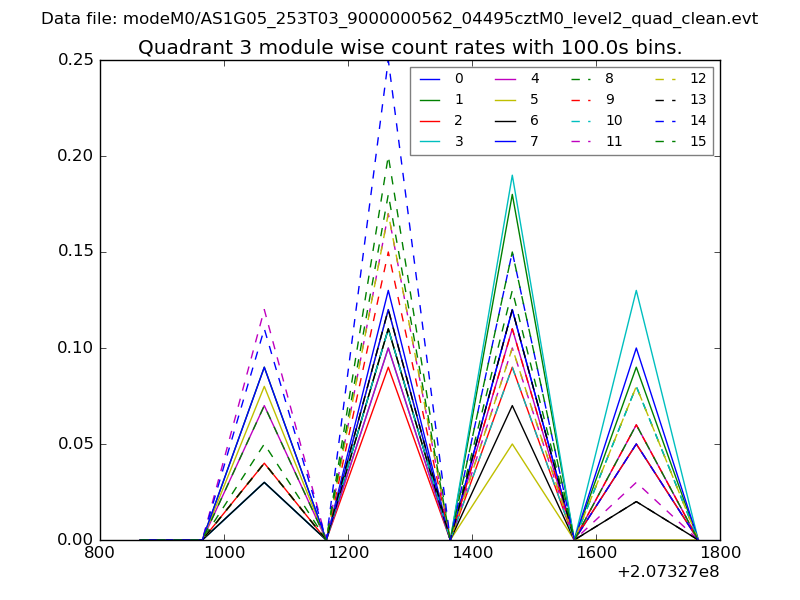 |
 |
| Parameter | Plot |
|---|---|
| CZT HV Monitor | 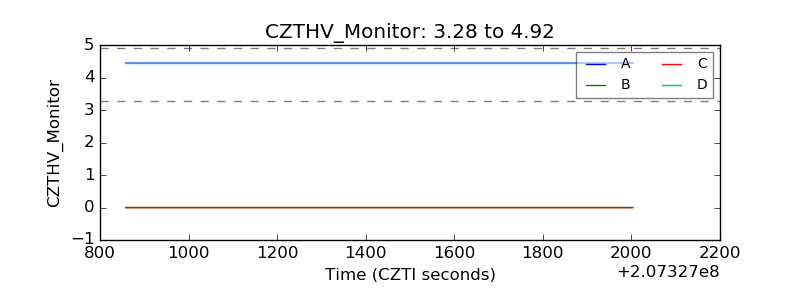 |
| D_VDD | 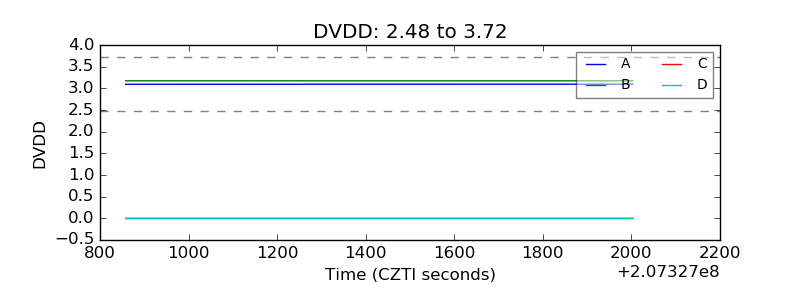 |
| Temperature 1 | 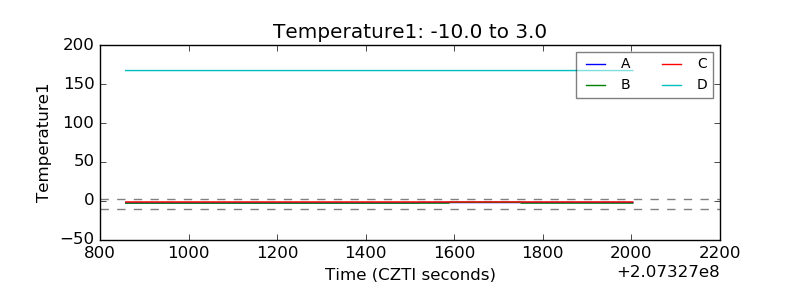 |
| Veto HV Monitor | 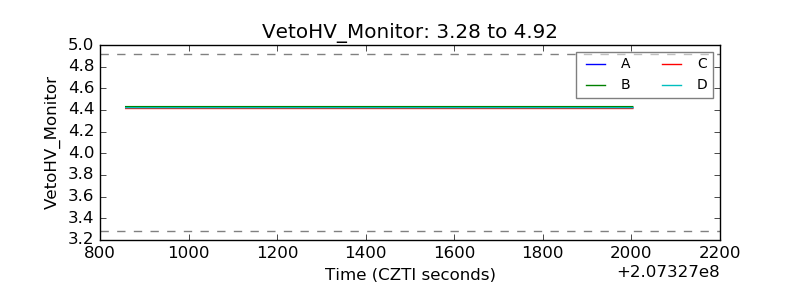 |
| Veto LLD | 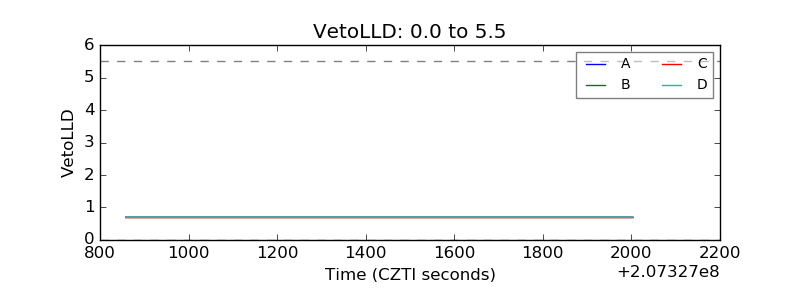 |
| Alpha Counter | 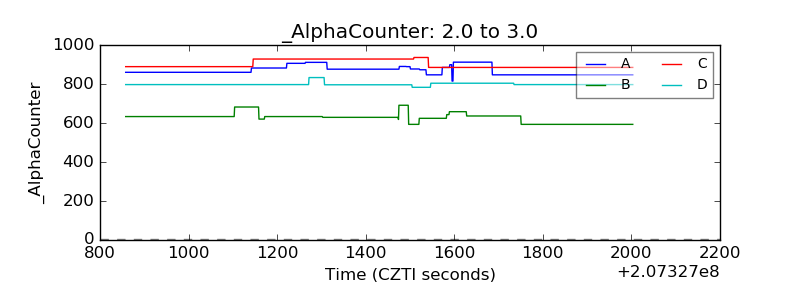 |
| _CPM_Rate | 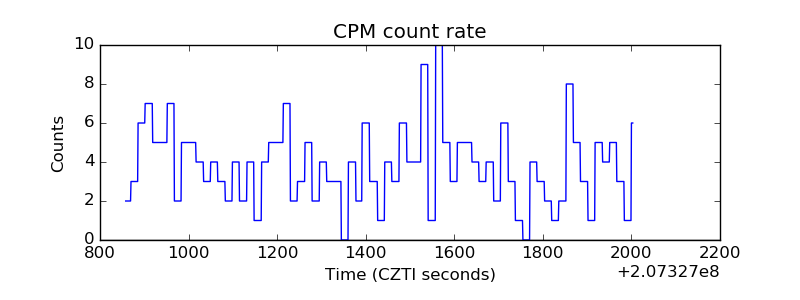 |
| CZT Counter | 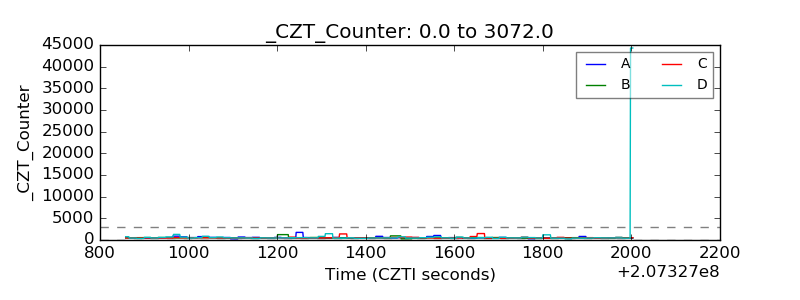 |
| +2.5 Volts monitor |  |
| +5 Volts monitor | 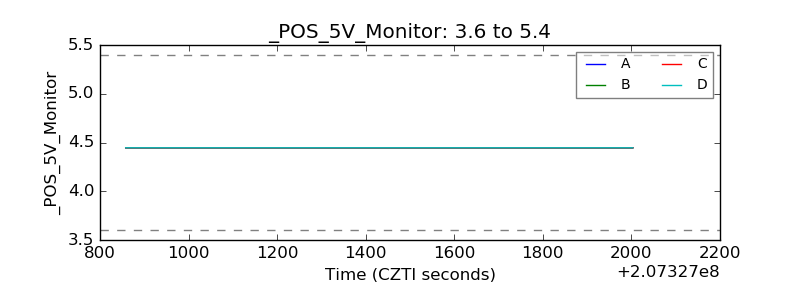 |
| _ROLL_ROT | 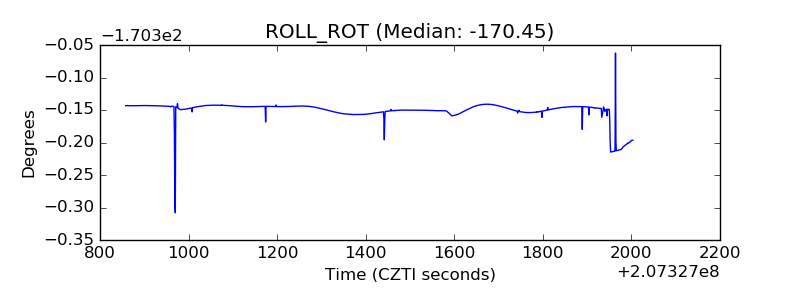 |
| _Roll_DEC | 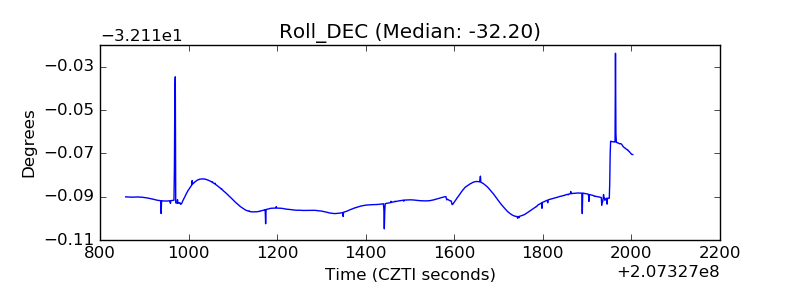 |
| _Roll_RA | 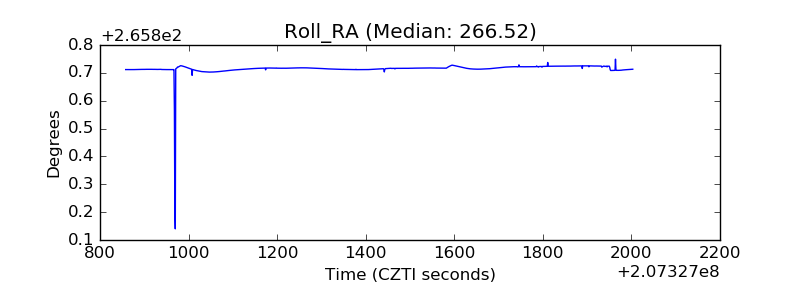 |
| Veto Counter | 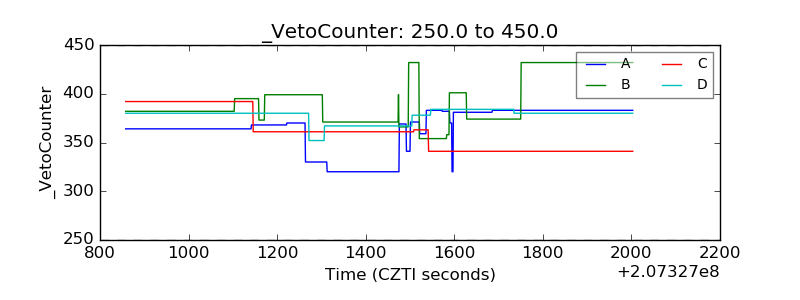 |