| Param | Original file | Final file |
|---|---|---|
| Filename | modeM0/AS1G05_253T03_9000000562_04496cztM0_level2.evt | modeM0/AS1G05_253T03_9000000562_04496cztM0_level2_quad_clean.evt |
| Size (bytes) | 1,152,869,760 | 171,613,440 |
| Size | 1.1 GB | 163.7 MB |
| Events in quadrant A | 8,551,138 | 1,016,390 |
| Events in quadrant B | 8,071,482 | 1,025,790 |
| Events in quadrant C | 7,673,780 | 1,028,045 |
| Events in quadrant D | 9,495,864 | 982,482 |
| Mode SS | |||
|---|---|---|---|
| Quadrant | BADHDUFLAG | Total packets | Discarded packets |
| A | 0 | 342 | 6 |
| B | 0 | 342 | 0 |
| C | 0 | 342 | 4 |
| D | 0 | 342 | 0 |
| Mode M9 | |||
|---|---|---|---|
| Quadrant | BADHDUFLAG | Total packets | Discarded packets |
| A | 0 | 18 | 0 |
| B | 0 | 18 | 1 |
| C | 0 | 18 | 0 |
| D | 0 | 18 | 0 |
| Mode M0 | |||
|---|---|---|---|
| Quadrant | BADHDUFLAG | Total packets | Discarded packets |
| A | 0 | 37125 | 267 |
| B | 0 | 35206 | 262 |
| C | 0 | 35017 | 309 |
| D | 0 | 40472 | 301 |
| Quadrant | Total seconds | Saturated seconds | Saturation percentage |
|---|---|---|---|
| A | 16593 | 312 | 1.880311% |
| B | 16587 | 139 | 0.838006% |
| C | 16584 | 128 | 0.771828% |
| D | 16581 | 397 | 2.394307% |
Noise dominated data is calculated using 1-second bins in cleaned event files. If a bin has >2000 counts, and if more than 50% of those come from <1% of pixels, then it is considered to be noise-dominated and hence unusable.
| Quadrant | # 1 sec bins | Bins with >0 counts | Bins with >2000 counts | High rate bins dominated by noise | Noise dominated (total time) | Noise dominated (detector-on time) | Marked lightcurve |
|---|---|---|---|---|---|---|---|
| A | 18576 | 16706 | 153 | 153 | 0.82% | 0.92% | 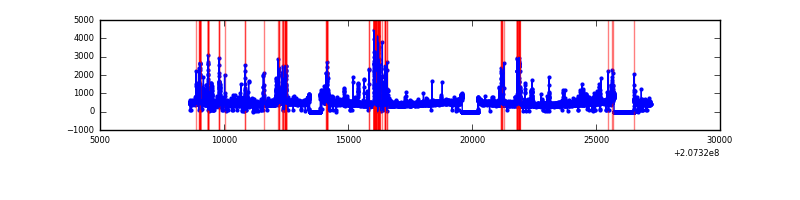 |
| B | 18576 | 16701 | 13 | 13 | 0.07% | 0.08% |  |
| C | 18576 | 16702 | 52 | 52 | 0.28% | 0.31% | 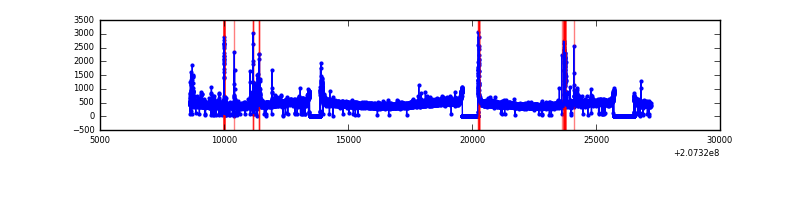 |
| D | 18576 | 16706 | 264 | 264 | 1.42% | 1.58% | 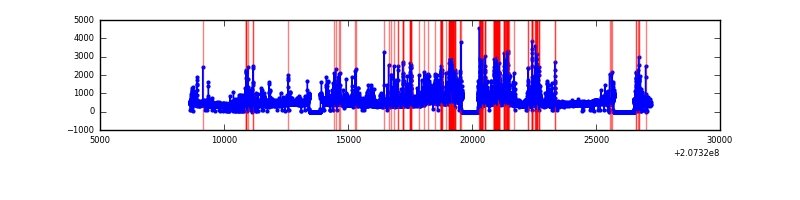 |
Top three noisy pixels from each quadrant. If the there are fewer than three noisy pixels in the level2.evt file, extra rows are filled as -1
| Pixel properties | Quadrant properties | ||||||
|---|---|---|---|---|---|---|---|
| Quadrant | DetID | PixID | Counts | Sigma | Mean | Median | Sigma |
| A | 0 | 13 | 409035 | 1042.05 | 1890 | 1845 | 390.8 |
| A | 0 | 50 | 383366 | 976.36 | 1890 | 1845 | 390.8 |
| A | 0 | 118 | 238845 | 606.51 | 1890 | 1845 | 390.8 |
| B | 15 | 204 | 326424 | 876.79 | 1922 | 1871 | 370.2 |
| B | 8 | 3 | 158881 | 424.17 | 1922 | 1871 | 370.2 |
| B | 4 | 80 | 68398 | 179.73 | 1922 | 1871 | 370.2 |
| C | 9 | 247 | 223368 | 514.83 | 1842 | 1852 | 430.3 |
| C | 9 | 54 | 124475 | 284.99 | 1842 | 1852 | 430.3 |
| C | 9 | 16 | 67703 | 153.04 | 1842 | 1852 | 430.3 |
| D | 14 | 34 | 1667542 | 3792.91 | 1817 | 1759 | 439.2 |
| D | 13 | 235 | 450781 | 1022.4 | 1817 | 1759 | 439.2 |
| D | 12 | 36 | 151812 | 341.66 | 1817 | 1759 | 439.2 |
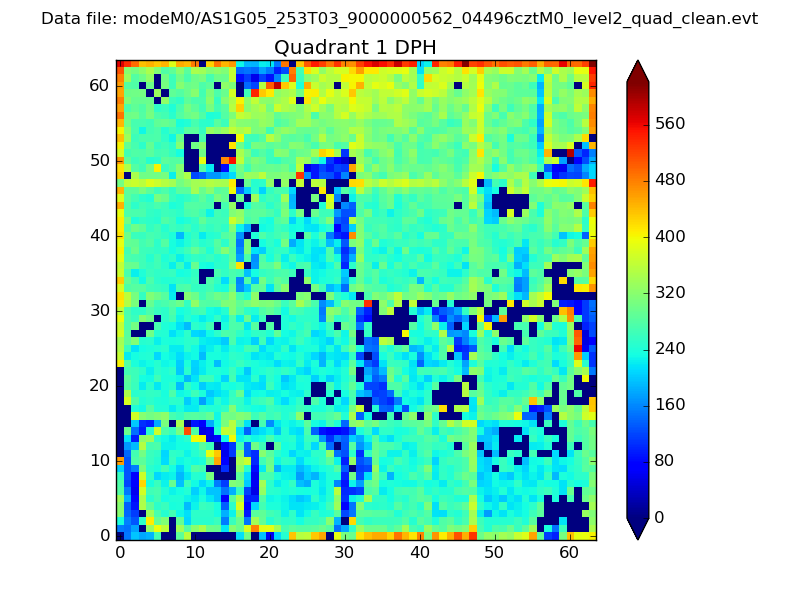
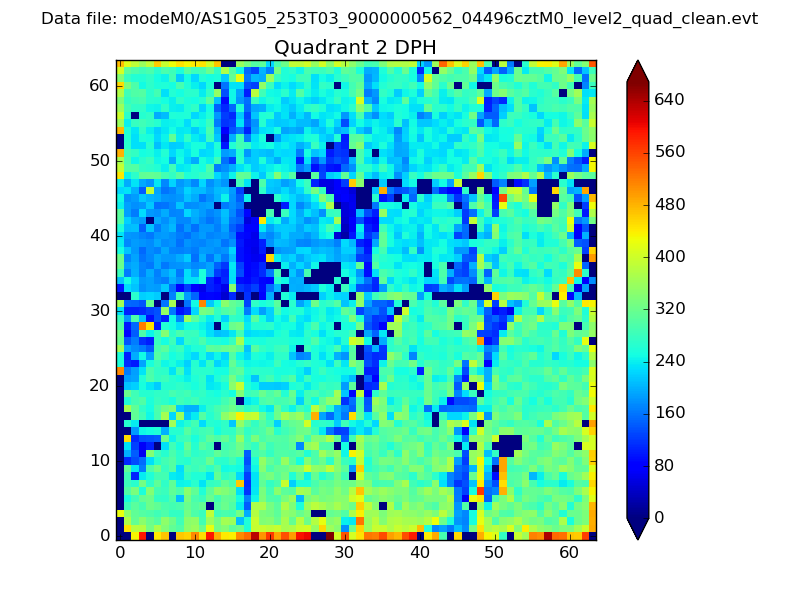
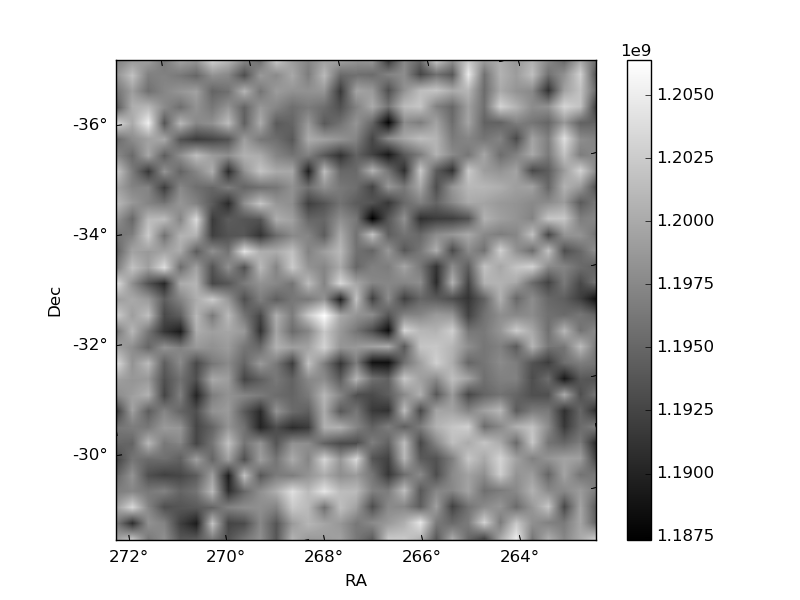
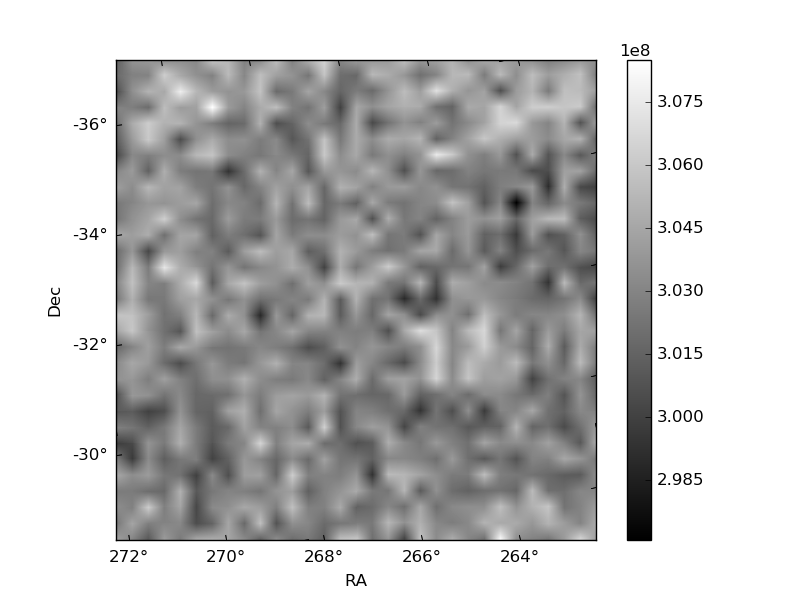
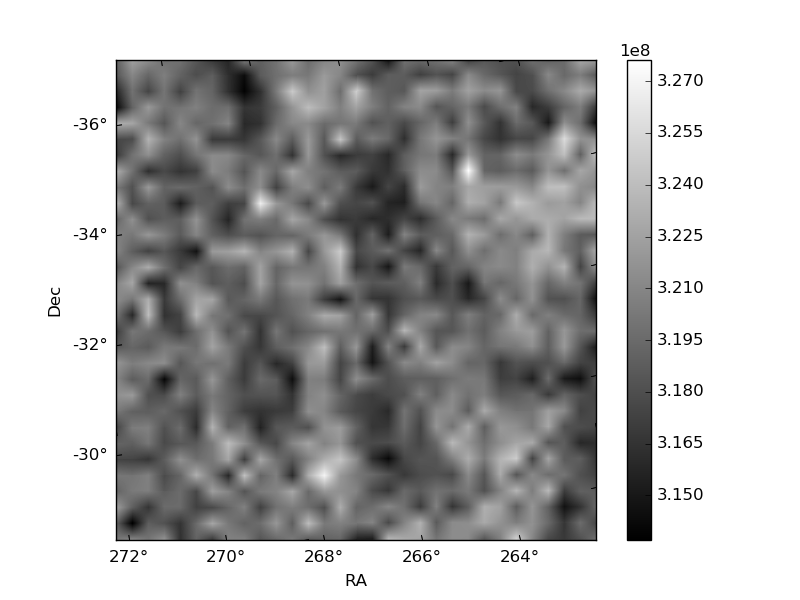
Histogram calculated using DETX and DETY for each event in the final _common_clean file
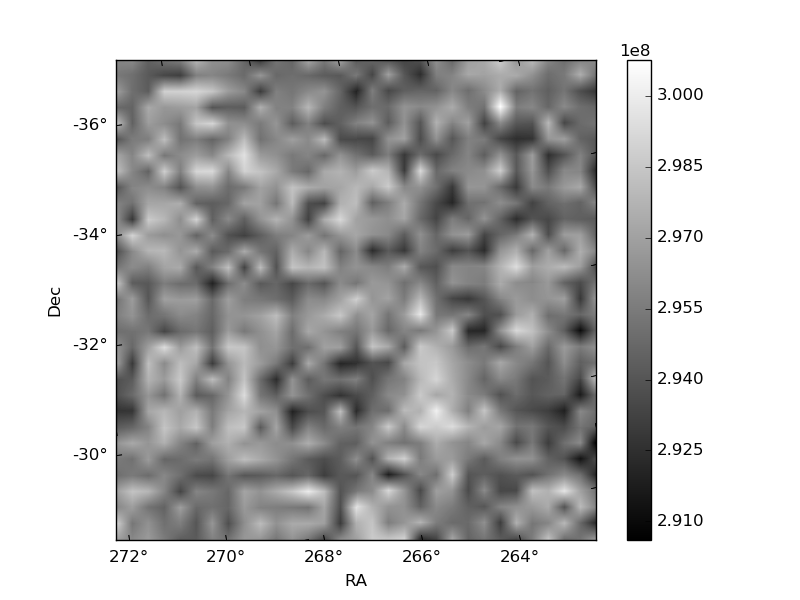
| Quadrant A | 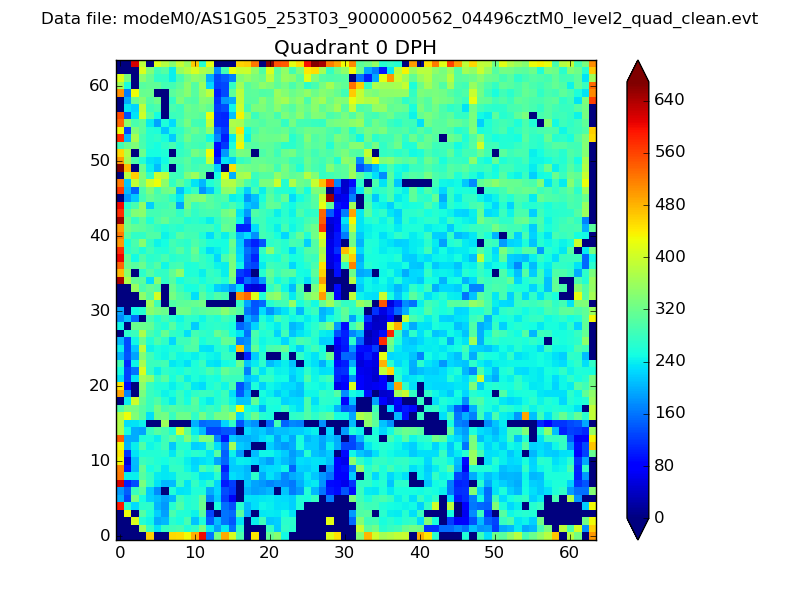 |
 |
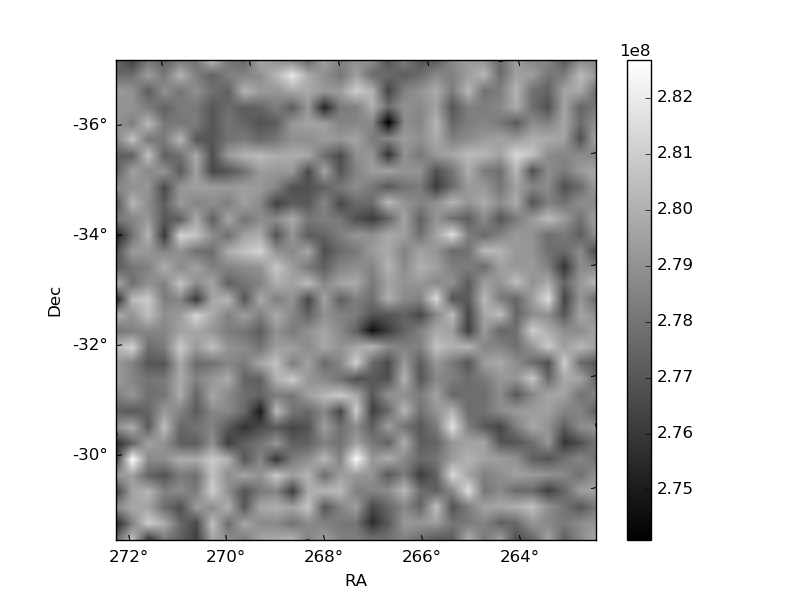
Quadrant B |
|---|---|---|---|
| Quadrant D | 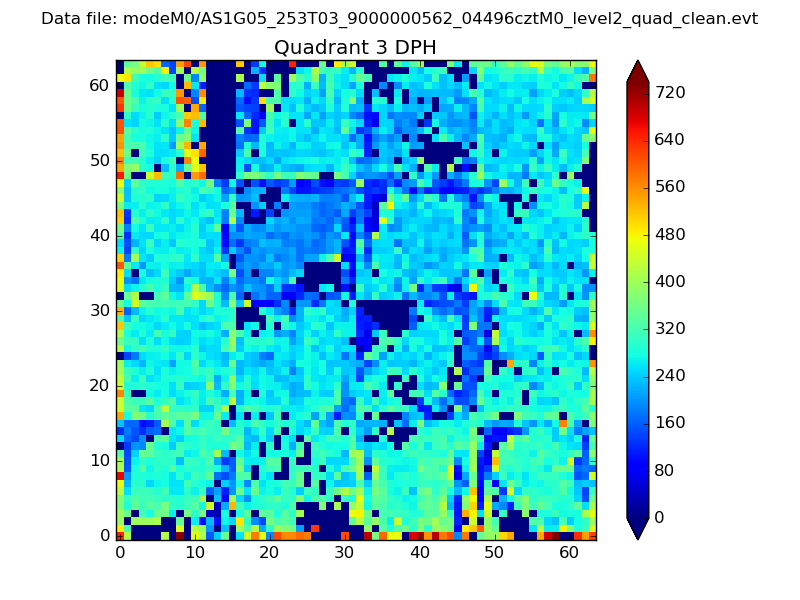 |
 |
Quadrant C |
| Plot type | Count rate plots | Images |
|---|---|---|
| Comparison with Poisson distribution Blue bars denote a histogram of data divided into 1 sec bins. Red curve is a Poisson curve with rate = median count rate of data. |
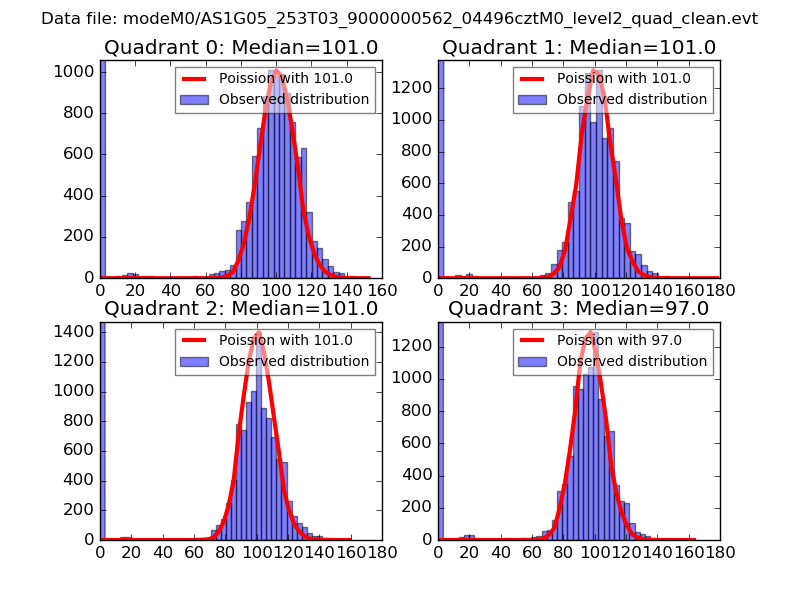 |
 |
| Quadrant-wise count rates Data is divided into 100 sec bins |
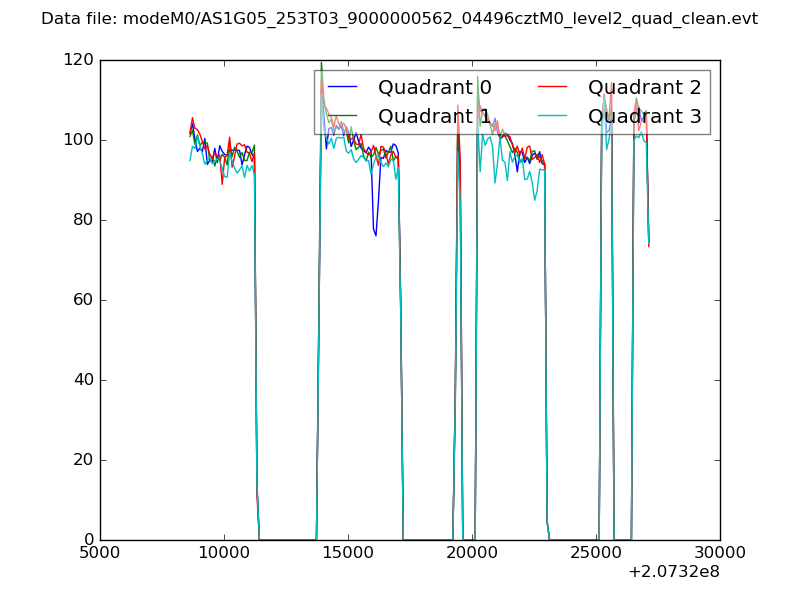 |
|
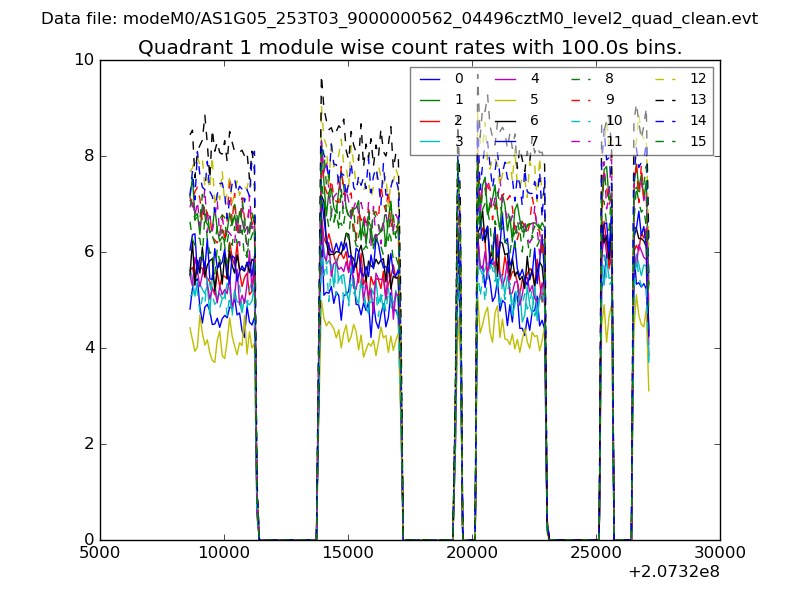
| Module-wise count rates for Quadrant A Data is divided into 100 sec bins |
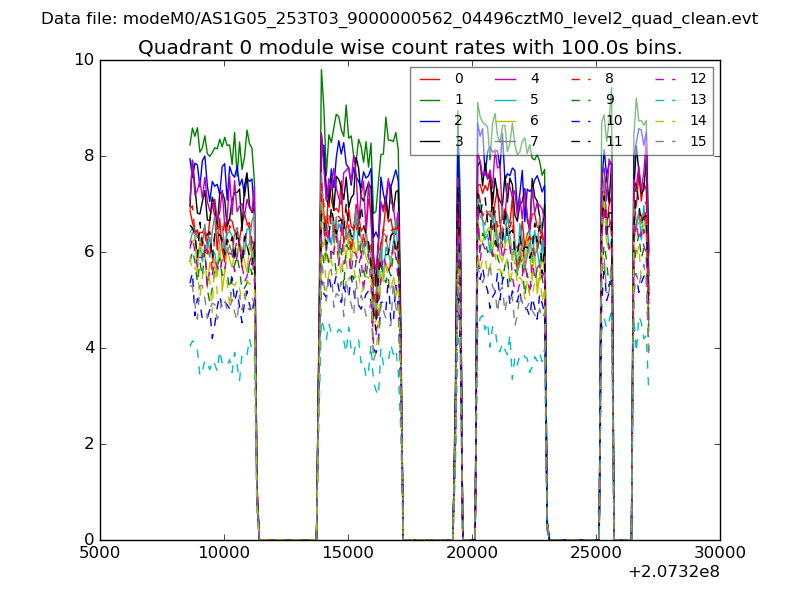 |
 |
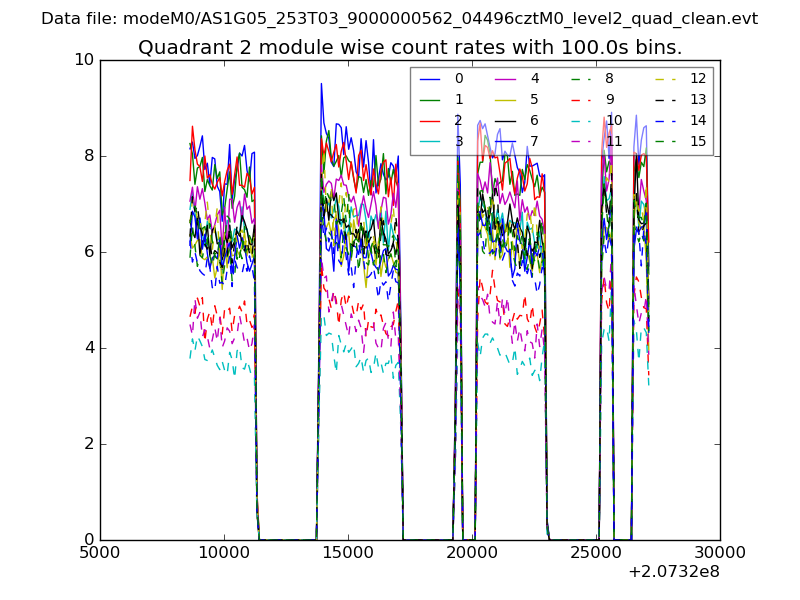
| Module-wise count rates for Quadrant B Data is divided into 100 sec bins |
 |
 |
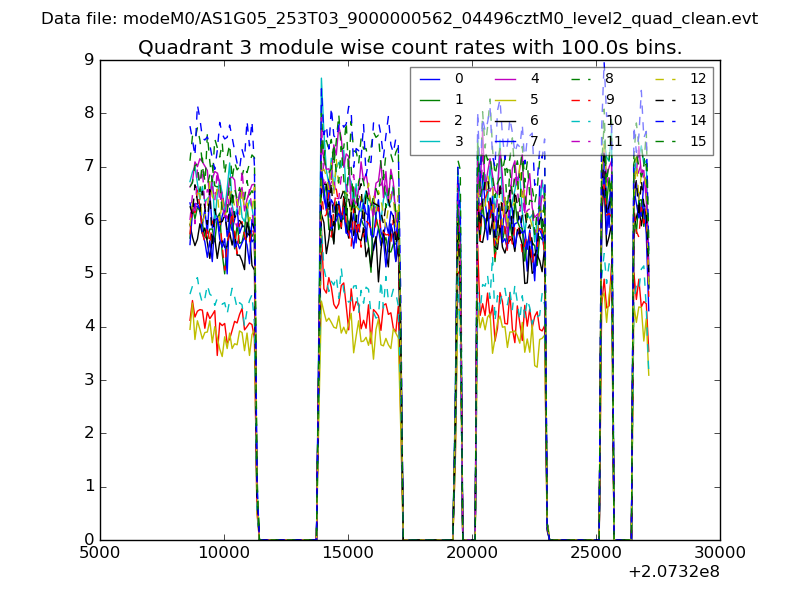
| Module-wise count rates for Quadrant C Data is divided into 100 sec bins |
 |
 |
| Module-wise count rates for Quadrant D Data is divided into 100 sec bins |
 |
 |
| Parameter | Plot |
|---|---|
| CZT HV Monitor | 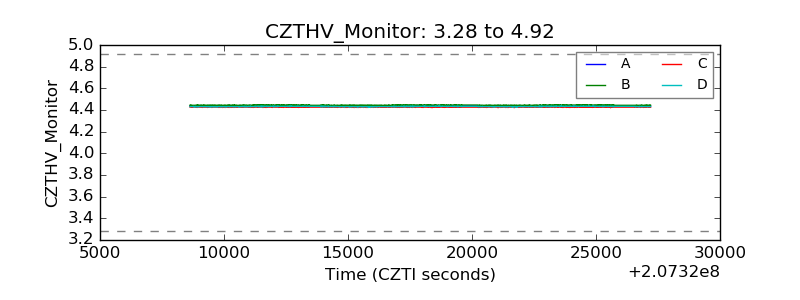 |
| D_VDD | 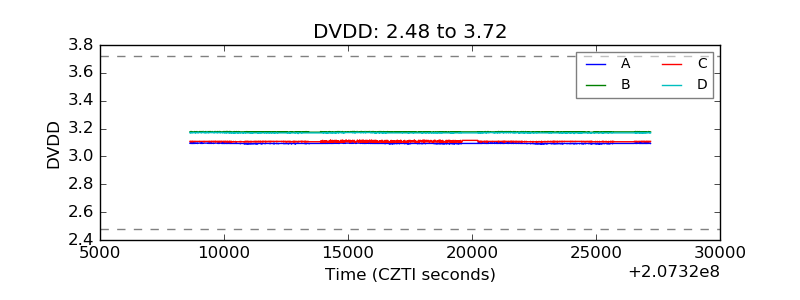 |
| Temperature 1 | 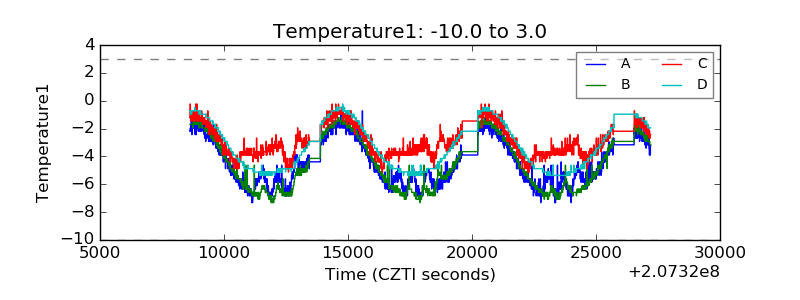 |
| Veto HV Monitor | 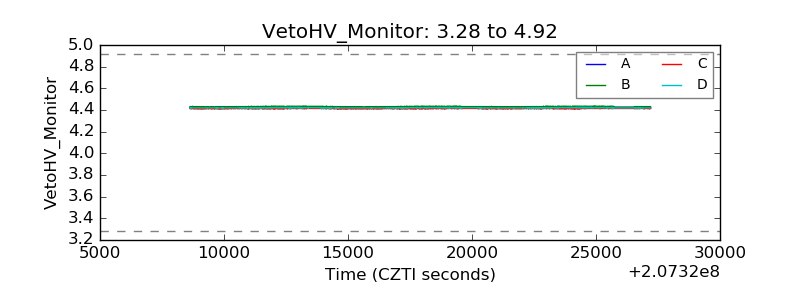 |
| Veto LLD | 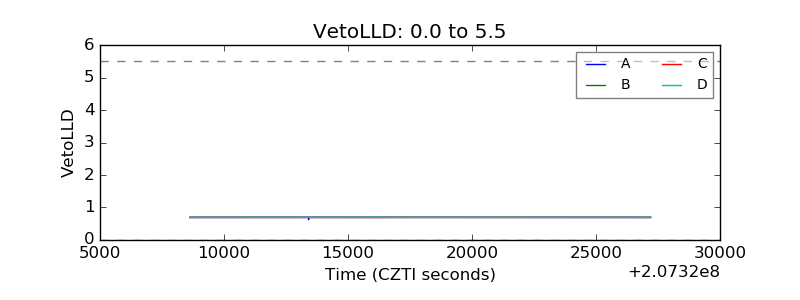 |
| Alpha Counter | 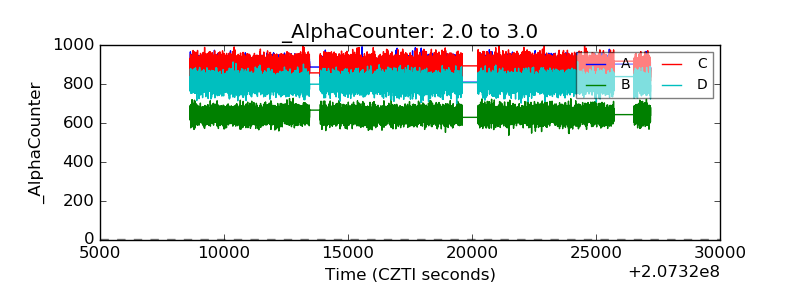 |
| _CPM_Rate | 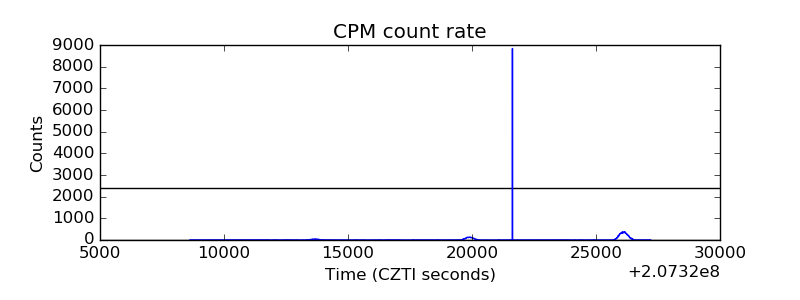 |
| CZT Counter | 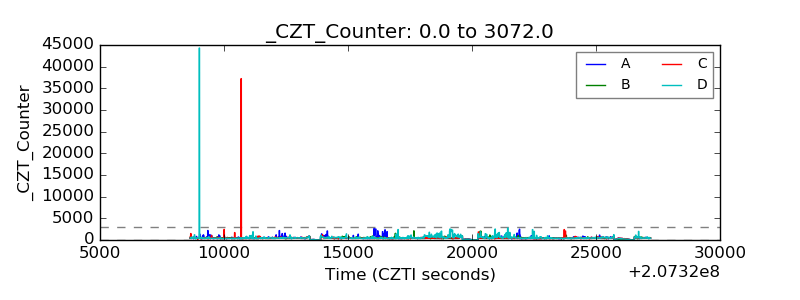 |
| +2.5 Volts monitor | 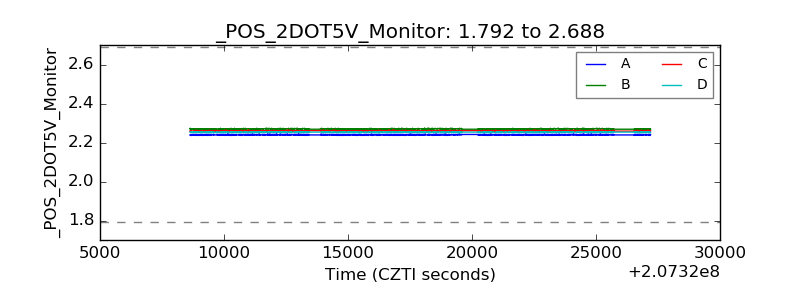 |
| +5 Volts monitor |  |
| _ROLL_ROT | 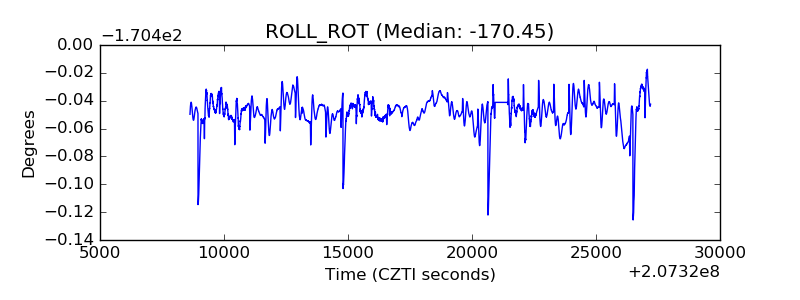 |
| _Roll_DEC | 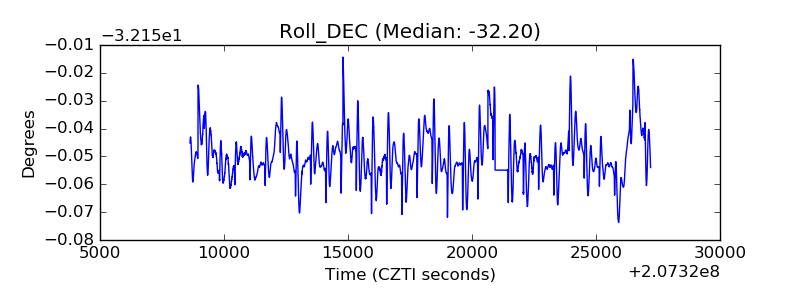 |
| _Roll_RA | 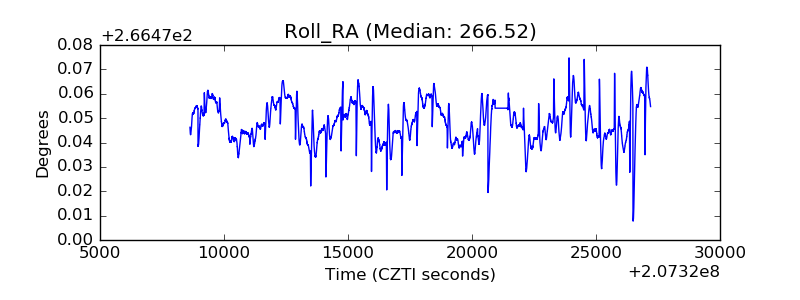 |
| Veto Counter | 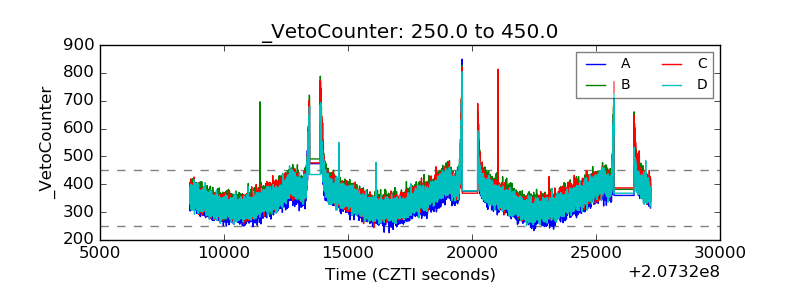 |