| Param | Original file | Final file |
|---|---|---|
| Filename | modeM0/AS1SLEW_01234_9000000561_04471cztM0_level2.evt | modeM0/AS1SLEW_01234_9000000561_04471cztM0_level2_quad_clean.evt |
| Size (bytes) | 35,015,040 | 1,811,520 |
| Size | 33.4 MB | 1.7 MB |
| Events in quadrant A | 237,907 | 3,162 |
| Events in quadrant B | 246,726 | 3,252 |
| Events in quadrant C | 238,440 | 3,284 |
| Events in quadrant D | 301,192 | 3,127 |
| Mode M0 | |||
|---|---|---|---|
| Quadrant | BADHDUFLAG | Total packets | Discarded packets |
| A | 0 | 973 | 4 |
| B | 0 | 994 | 6 |
| C | 0 | 975 | 2 |
| D | 0 | 1207 | 14 |
| Mode SS | |||
|---|---|---|---|
| Quadrant | BADHDUFLAG | Total packets | Discarded packets |
| A | 0 | 10 | 0 |
| B | 0 | 10 | 2 |
| C | 0 | 10 | 0 |
| D | 0 | 10 | 0 |
| Quadrant | Total seconds | Saturated seconds | Saturation percentage |
|---|---|---|---|
| A | 480 | 0 | 0.000000% |
| B | 479 | 0 | 0.000000% |
| C | 481 | 0 | 0.000000% |
| D | 476 | 5 | 1.050420% |
Noise dominated data is calculated using 1-second bins in cleaned event files. If a bin has >2000 counts, and if more than 50% of those come from <1% of pixels, then it is considered to be noise-dominated and hence unusable.
| Quadrant | # 1 sec bins | Bins with >0 counts | Bins with >2000 counts | High rate bins dominated by noise | Noise dominated (total time) | Noise dominated (detector-on time) | Marked lightcurve |
|---|---|---|---|---|---|---|---|
| A | 482 | 482 | 0 | 0 | 0.00% | 0.00% |  |
| B | 482 | 482 | 0 | 0 | 0.00% | 0.00% | 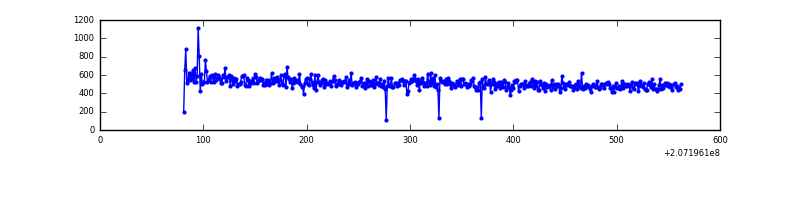 |
| C | 482 | 482 | 0 | 0 | 0.00% | 0.00% | 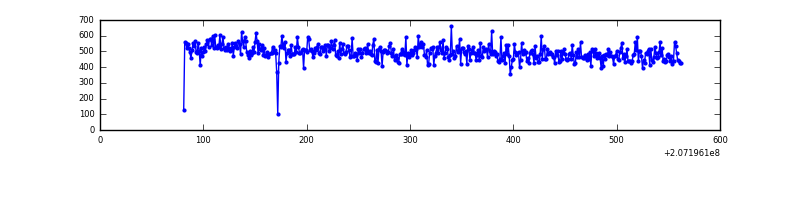 |
| D | 482 | 482 | 5 | 5 | 1.04% | 1.04% | 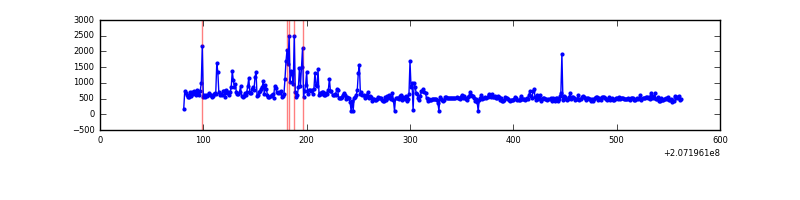 |
Top three noisy pixels from each quadrant. If the there are fewer than three noisy pixels in the level2.evt file, extra rows are filled as -1
| Pixel properties | Quadrant properties | ||||||
|---|---|---|---|---|---|---|---|
| Quadrant | DetID | PixID | Counts | Sigma | Mean | Median | Sigma |
| A | 0 | 118 | 876 | 55.75 | 61 | 59 | 14.7 |
| A | 12 | 194 | 668 | 41.55 | 61 | 59 | 14.7 |
| A | 0 | 226 | 640 | 39.64 | 61 | 59 | 14.7 |
| B | 4 | 48 | 1821 | 124.47 | 63 | 62 | 14.1 |
| B | 12 | 111 | 1005 | 66.73 | 63 | 62 | 14.1 |
| B | 11 | 111 | 751 | 48.75 | 63 | 62 | 14.1 |
| C | 14 | 48 | 524 | 28.87 | 60 | 60 | 16.1 |
| C | 13 | 61 | 500 | 27.38 | 60 | 60 | 16.1 |
| C | 14 | 67 | 246 | 11.57 | 60 | 60 | 16.1 |
| D | 13 | 235 | 41841 | 2646.38 | 57 | 55 | 15.8 |
| D | 12 | 79 | 29190 | 1845.17 | 57 | 55 | 15.8 |
| D | 5 | 97 | 3275 | 203.93 | 57 | 55 | 15.8 |
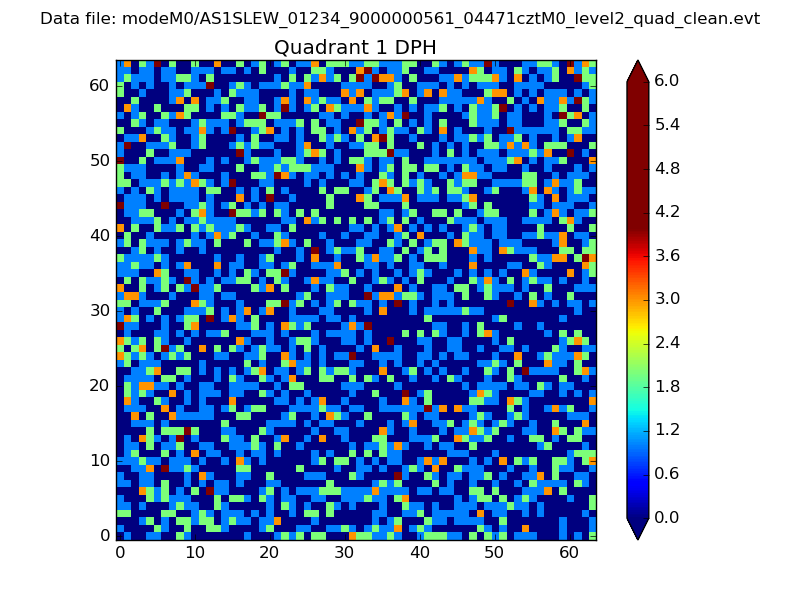
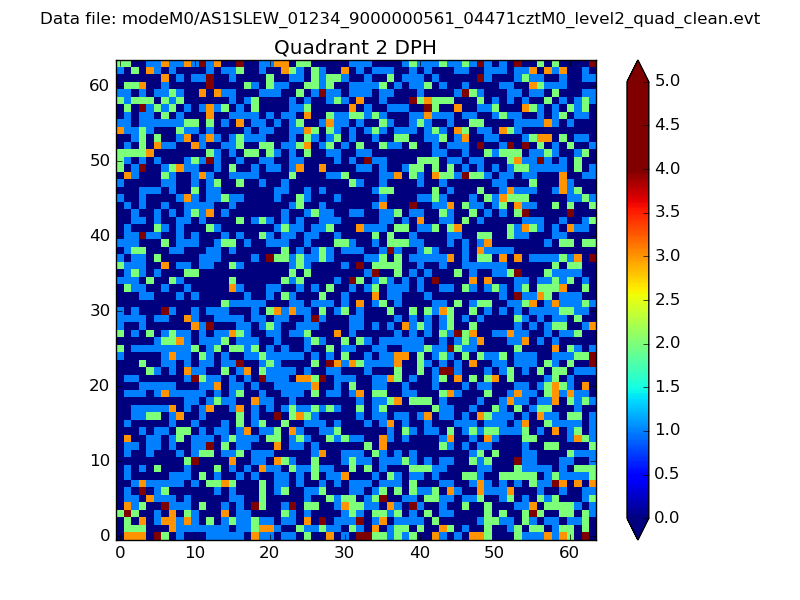
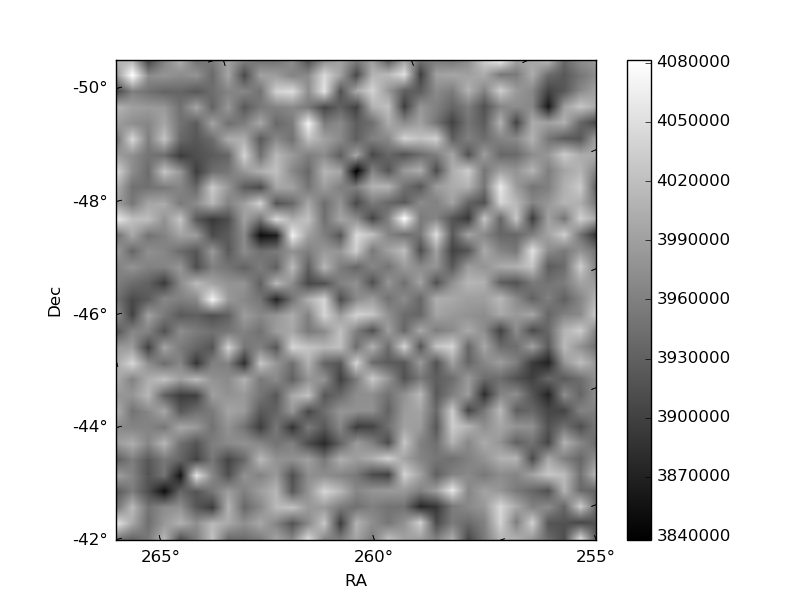
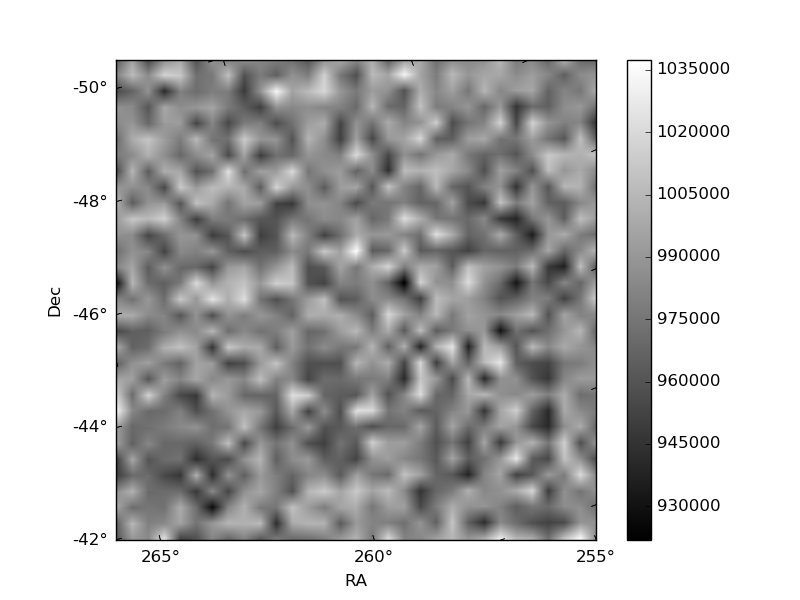
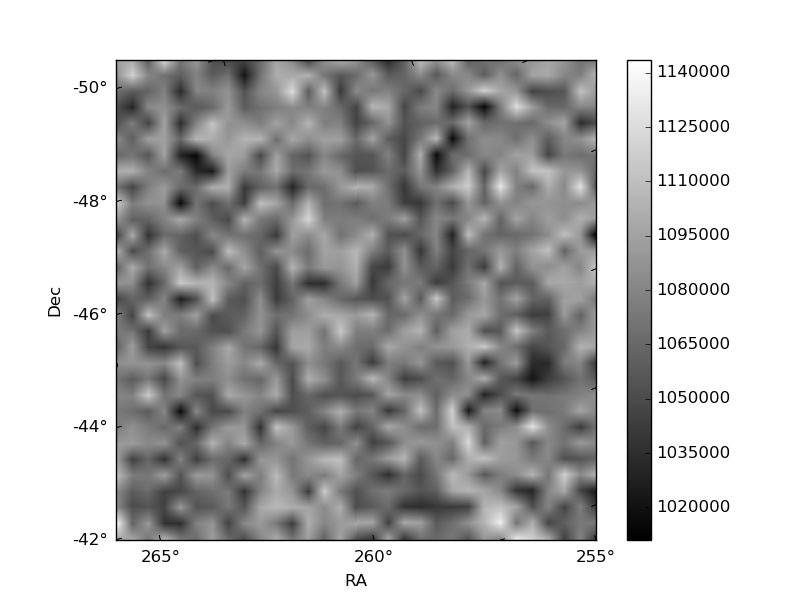
Histogram calculated using DETX and DETY for each event in the final _common_clean file
| Quadrant A | 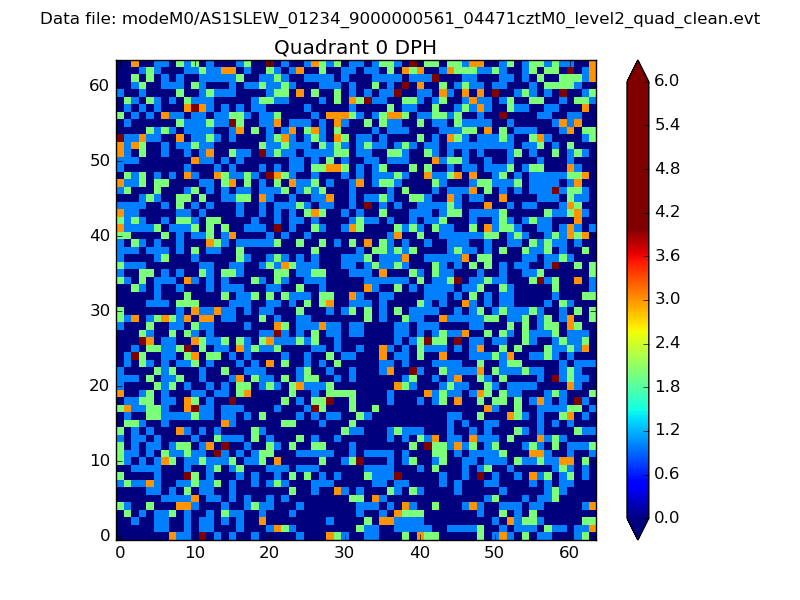 |
 |
Quadrant B |
|---|---|---|---|
| Quadrant D | 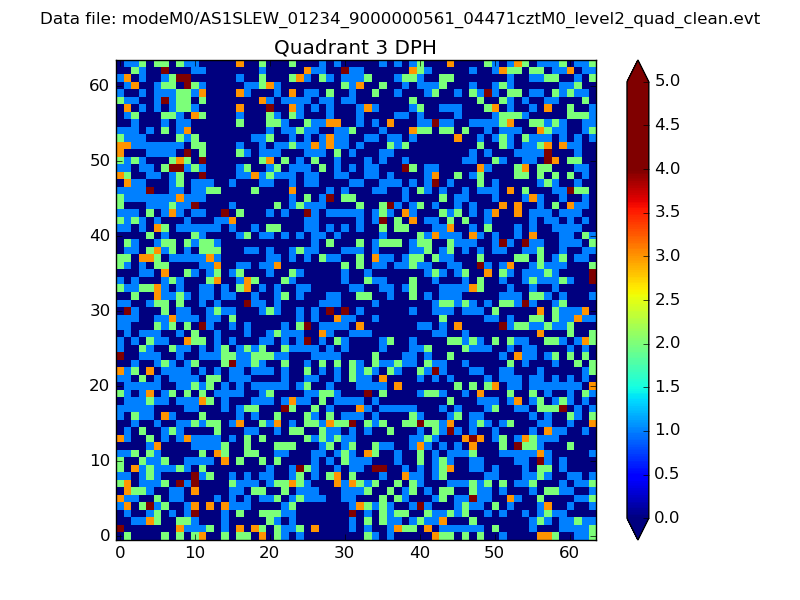 |
 |
Quadrant C |
| Plot type | Count rate plots | Images |
|---|---|---|
| Comparison with Poisson distribution Blue bars denote a histogram of data divided into 1 sec bins. Red curve is a Poisson curve with rate = median count rate of data. |
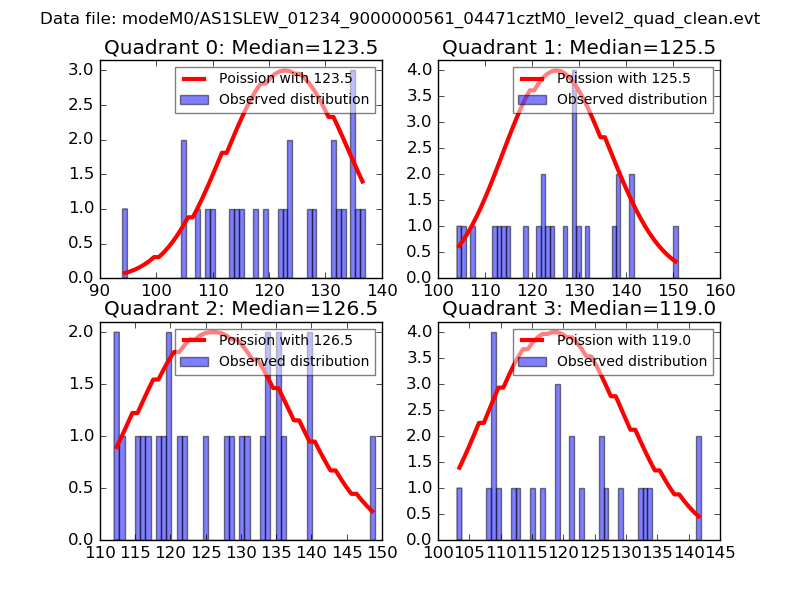 |
 |
| Quadrant-wise count rates Data is divided into 100 sec bins |
 |
|
| Module-wise count rates for Quadrant A Data is divided into 100 sec bins |
 |
 |
| Module-wise count rates for Quadrant B Data is divided into 100 sec bins |
 |
 |
| Module-wise count rates for Quadrant C Data is divided into 100 sec bins |
 |
 |
| Module-wise count rates for Quadrant D Data is divided into 100 sec bins |
 |
 |
| Parameter | Plot |
|---|---|
| CZT HV Monitor | 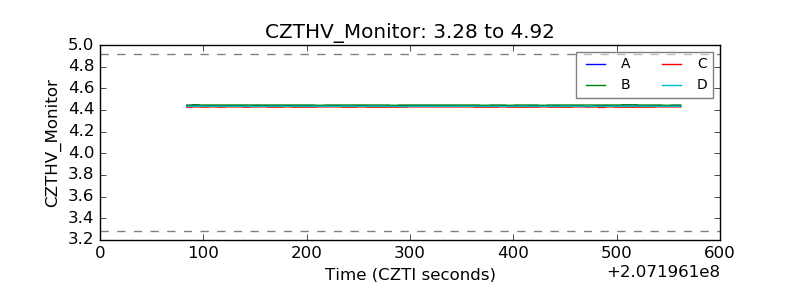 |
| D_VDD | 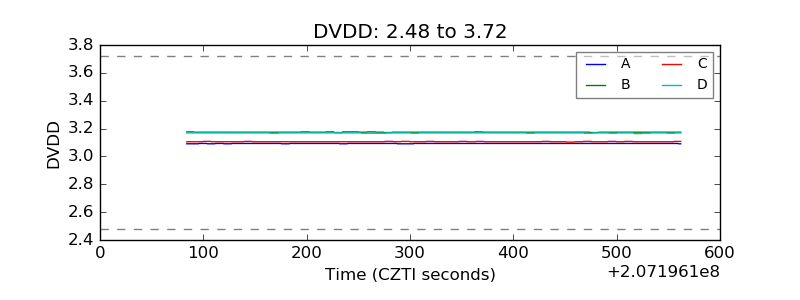 |
| Temperature 1 | 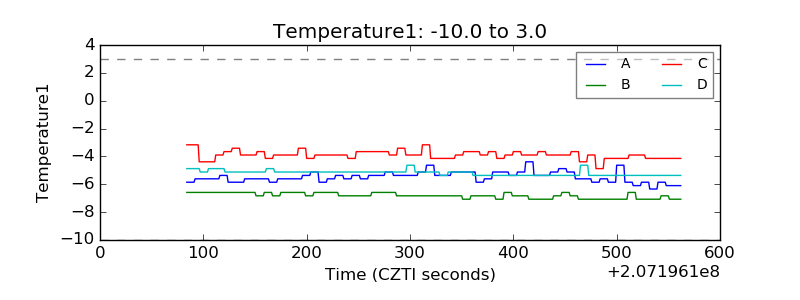 |
| Veto HV Monitor | 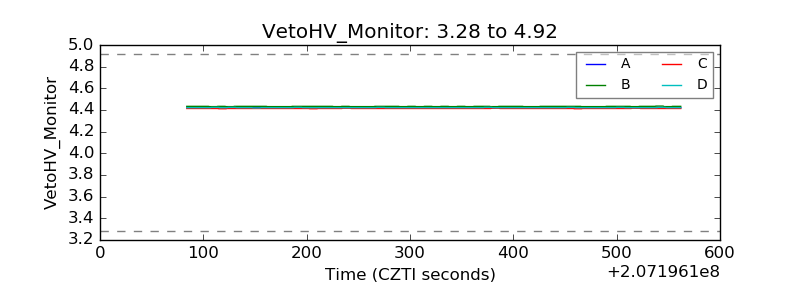 |
| Veto LLD | 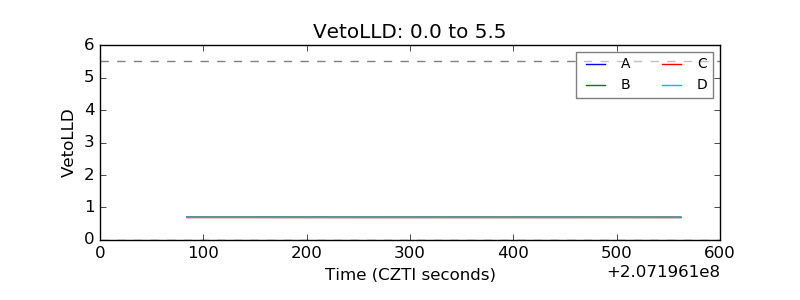 |
| Alpha Counter | 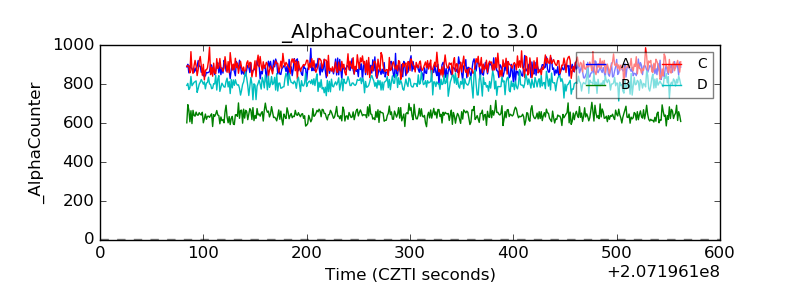 |
| _CPM_Rate | 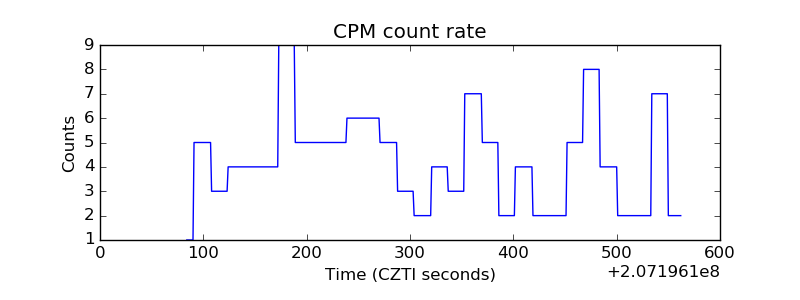 |
| CZT Counter | 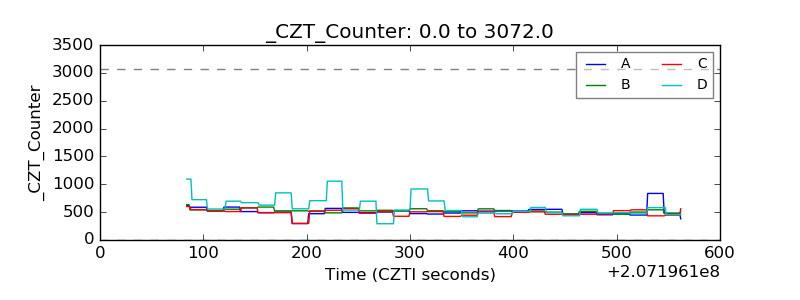 |
| +2.5 Volts monitor |  |
| +5 Volts monitor |  |
| _ROLL_ROT | 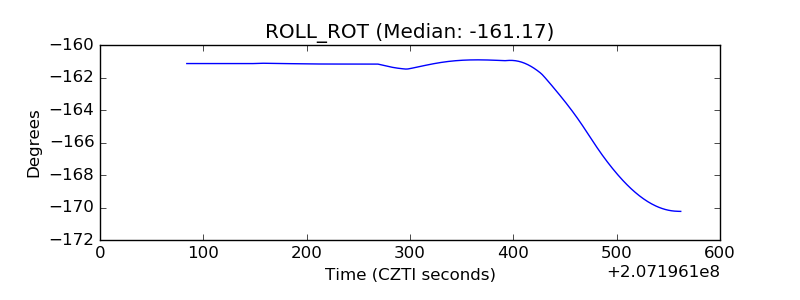 |
| _Roll_DEC | 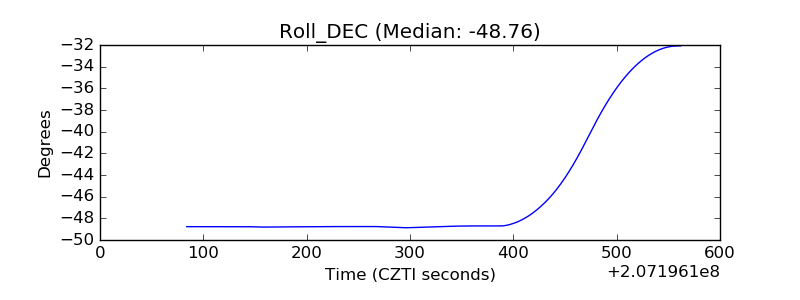 |
| _Roll_RA | 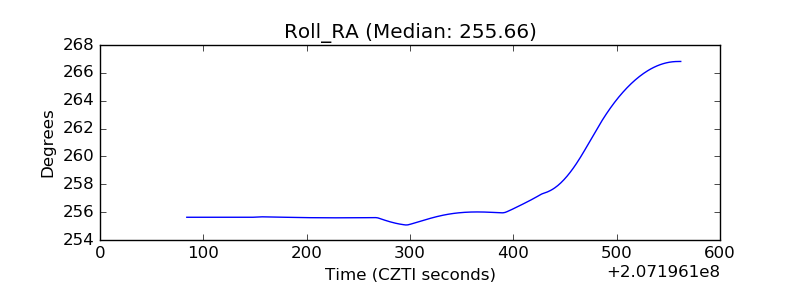 |
| Veto Counter | 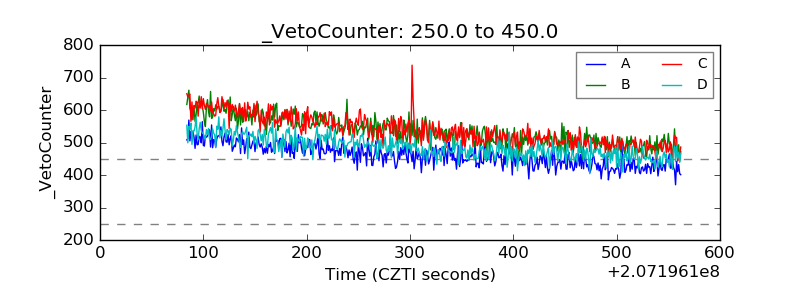 |