| Param | Original file | Final file |
|---|---|---|
| Filename | modeM0/AS1G05_173T01_9000000564cztM0_level2.fits | modeM0/AS1G05_173T01_9000000564cztM0_level2_quad_clean.evt |
| Size (bytes) | 101,603,520 | 81,279,360 |
| Size | 96.9 MB | 77.5 MB |
| Events in quadrant A | 598,458 | 434,606 |
| Events in quadrant B | 586,794 | 442,861 |
| Events in quadrant C | 599,402 | 420,256 |
| Events in quadrant D | 516,798 | 386,988 |
| Mode SS | |||
|---|---|---|---|
| Quadrant | BADHDUFLAG | Total packets | Discarded packets |
| A | 0 | 228 | 0 |
| B | 0 | 228 | 0 |
| C | 0 | 228 | 0 |
| D | 0 | 228 | 0 |
| Mode M0 | |||
|---|---|---|---|
| Quadrant | BADHDUFLAG | Total packets | Discarded packets |
| A | 0 | 24021 | 0 |
| B | 0 | 23080 | 0 |
| C | 0 | 23119 | 0 |
| D | 0 | 24550 | 0 |
| Mode M9 | |||
|---|---|---|---|
| Quadrant | BADHDUFLAG | Total packets | Discarded packets |
| A | 0 | 22 | 0 |
| B | 0 | 22 | 0 |
| C | 0 | 22 | 0 |
| D | 0 | 22 | 0 |
| Quadrant | Total seconds | Saturated seconds | Saturation percentage |
|---|---|---|---|
| A | 11210 | 101 | 0.900981% |
| B | 11209 | 72 | 0.642341% |
| C | 11210 | 60 | 0.535236% |
| D | 11210 | 160 | 1.427297% |
Noise dominated data is calculated using 1-second bins in cleaned event files. If a bin has >2000 counts, and if more than 50% of those come from <1% of pixels, then it is considered to be noise-dominated and hence unusable.
| Quadrant | # 1 sec bins | Bins with >0 counts | Bins with >2000 counts | High rate bins dominated by noise | Noise dominated (total time) | Noise dominated (detector-on time) | Marked lightcurve |
|---|---|---|---|---|---|---|---|
| A | 13320 | 11215 | 0 | 0 | 0.00% | 0.00% |  |
| B | 13320 | 11215 | 0 | 0 | 0.00% | 0.00% | 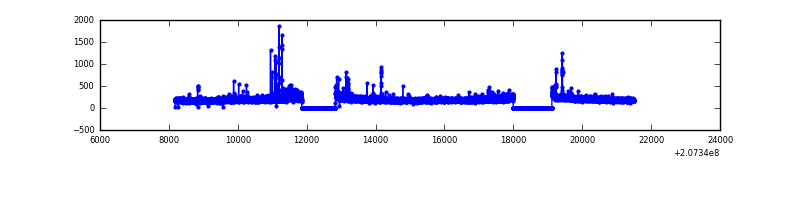 |
| C | 13320 | 11214 | 0 | 0 | 0.00% | 0.00% |  |
| D | 13320 | 11215 | 0 | 0 | 0.00% | 0.00% |  |
Top three noisy pixels from each quadrant. If the there are fewer than three noisy pixels in the level2.evt file, extra rows are filled as -1
| Pixel properties | Quadrant properties | ||||||
|---|---|---|---|---|---|---|---|
| Quadrant | DetID | PixID | Counts | Sigma | Mean | Median | Sigma |
| A | 14 | 188 | 565 | 10.0 | 155 | 145 | 42.0 |
| A | 7 | 110 | 537 | 9.34 | 155 | 145 | 42.0 |
| A | 0 | 29 | 485 | 8.1 | 155 | 145 | 42.0 |
| B | 2 | 9 | 500 | 10.26 | 155 | 147 | 34.4 |
| B | 12 | 226 | 429 | 8.2 | 155 | 147 | 34.4 |
| B | 14 | 254 | 408 | 7.59 | 155 | 147 | 34.4 |
| C | 1 | 80 | 437 | 6.63 | 158 | 147 | 43.8 |
| C | 1 | 81 | 421 | 6.26 | 158 | 147 | 43.8 |
| C | 12 | 241 | 410 | 6.01 | 158 | 147 | 43.8 |
| D | 11 | 82 | 423 | 7.21 | 147 | 134 | 40.1 |
| D | 7 | 5 | 384 | 6.24 | 147 | 134 | 40.1 |
| D | 3 | 30 | 380 | 6.14 | 147 | 134 | 40.1 |
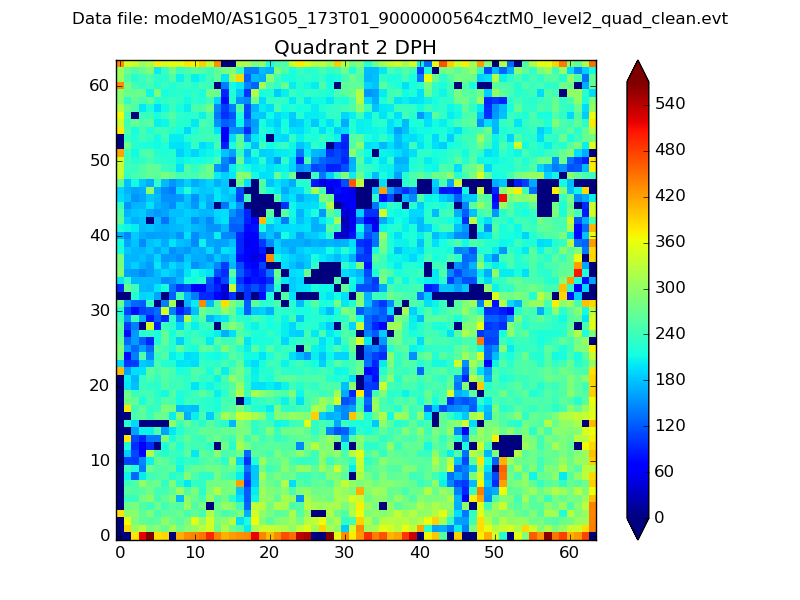
Histogram calculated using DETX and DETY for each event in the final _common_clean file
| Quadrant A |  |
 |
Quadrant B |
|---|---|---|---|
| Quadrant D | 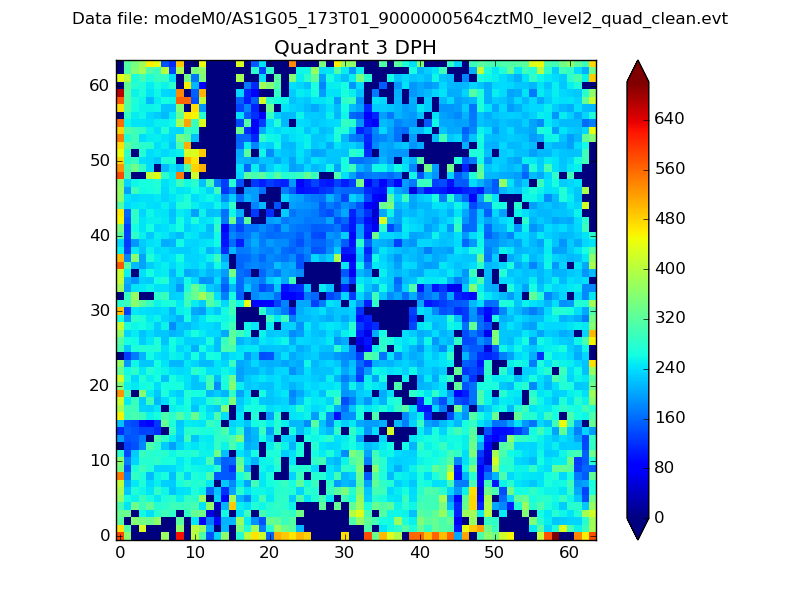 |
 |
Quadrant C |
| Plot type | Count rate plots | Images |
|---|---|---|
| Comparison with Poisson distribution Blue bars denote a histogram of data divided into 1 sec bins. Red curve is a Poisson curve with rate = median count rate of data. |
 |
 |
| Quadrant-wise count rates Data is divided into 100 sec bins |
 |
|
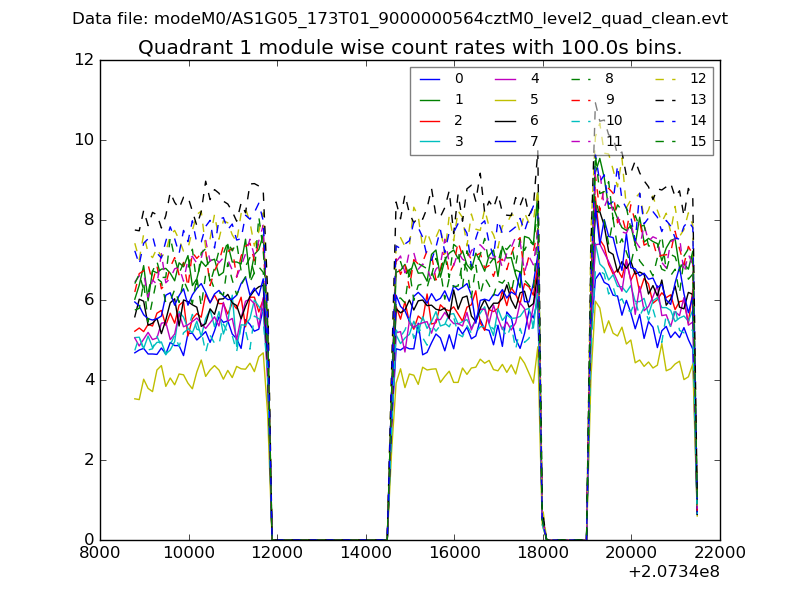
| Module-wise count rates for Quadrant A Data is divided into 100 sec bins |
 |
 |
| Module-wise count rates for Quadrant B Data is divided into 100 sec bins |
 |
 |
| Module-wise count rates for Quadrant C Data is divided into 100 sec bins |
 |
 |
| Module-wise count rates for Quadrant D Data is divided into 100 sec bins |
 |
 |
| Parameter | Plot |
|---|---|
| CZT HV Monitor |  |
| D_VDD |  |
| Temperature 1 |  |
| Veto HV Monitor |  |
| Veto LLD |  |
| Alpha Counter |  |
| _CPM_Rate |  |
| CZT Counter |  |
| +2.5 Volts monitor |  |
| +5 Volts monitor |  |
| _ROLL_ROT |  |
| _Roll_DEC |  |
| _Roll_RA | 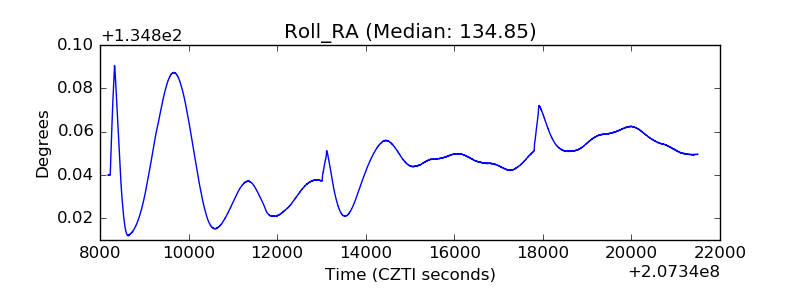 |
| Veto Counter |  |