| Param | Original file | Final file |
|---|---|---|
| Filename | modeM0/AS1G05_173T01_9000000564_04498cztM0_level2.evt | modeM0/AS1G05_173T01_9000000564_04498cztM0_level2_quad_clean.evt |
| Size (bytes) | 434,232,000 | 59,921,280 |
| Size | 414.1 MB | 57.1 MB |
| Events in quadrant A | 3,341,145 | 340,070 |
| Events in quadrant B | 3,059,466 | 345,308 |
| Events in quadrant C | 3,051,268 | 342,430 |
| Events in quadrant D | 3,254,209 | 330,215 |
| Mode SS | |||
|---|---|---|---|
| Quadrant | BADHDUFLAG | Total packets | Discarded packets |
| A | 0 | 132 | 0 |
| B | 0 | 132 | 0 |
| C | 0 | 132 | 0 |
| D | 0 | 132 | 0 |
| Mode M0 | |||
|---|---|---|---|
| Quadrant | BADHDUFLAG | Total packets | Discarded packets |
| A | 0 | 14353 | 3 |
| B | 0 | 13498 | 2 |
| C | 0 | 13646 | 2 |
| D | 0 | 14478 | 2 |
| Mode M9 | |||
|---|---|---|---|
| Quadrant | BADHDUFLAG | Total packets | Discarded packets |
| A | 0 | 17 | 0 |
| B | 0 | 17 | 0 |
| C | 0 | 17 | 0 |
| D | 0 | 18 | 0 |
| Quadrant | Total seconds | Saturated seconds | Saturation percentage |
|---|---|---|---|
| A | 6542 | 65 | 0.993580% |
| B | 6542 | 34 | 0.519719% |
| C | 6542 | 41 | 0.626720% |
| D | 6542 | 110 | 1.681443% |
Noise dominated data is calculated using 1-second bins in cleaned event files. If a bin has >2000 counts, and if more than 50% of those come from <1% of pixels, then it is considered to be noise-dominated and hence unusable.
| Quadrant | # 1 sec bins | Bins with >0 counts | Bins with >2000 counts | High rate bins dominated by noise | Noise dominated (total time) | Noise dominated (detector-on time) | Marked lightcurve |
|---|---|---|---|---|---|---|---|
| A | 7667 | 6543 | 38 | 38 | 0.50% | 0.58% | 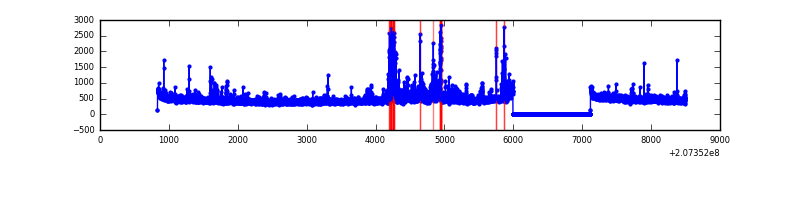 |
| B | 7667 | 6543 | 0 | 0 | 0.00% | 0.00% | 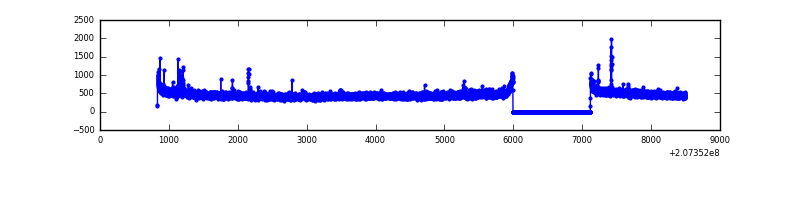 |
| C | 7667 | 6543 | 22 | 22 | 0.29% | 0.34% | 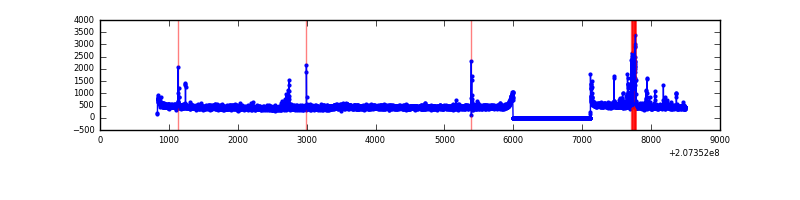 |
| D | 7667 | 6543 | 65 | 65 | 0.85% | 0.99% | 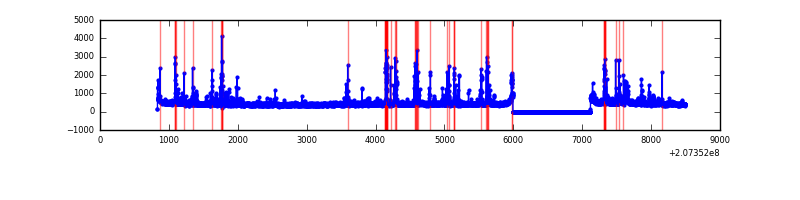 |
Top three noisy pixels from each quadrant. If the there are fewer than three noisy pixels in the level2.evt file, extra rows are filled as -1
| Pixel properties | Quadrant properties | ||||||
|---|---|---|---|---|---|---|---|
| Quadrant | DetID | PixID | Counts | Sigma | Mean | Median | Sigma |
| A | 0 | 13 | 393316 | 2558.97 | 755 | 739 | 153.4 |
| A | 7 | 16 | 27852 | 176.73 | 755 | 739 | 153.4 |
| A | 0 | 50 | 8625 | 51.4 | 755 | 739 | 153.4 |
| B | 15 | 204 | 32360 | 216.47 | 766 | 749 | 146.0 |
| B | 4 | 80 | 29001 | 193.47 | 766 | 749 | 146.0 |
| B | 12 | 111 | 12860 | 82.94 | 766 | 749 | 146.0 |
| C | 9 | 247 | 124454 | 724.97 | 735 | 737 | 170.7 |
| C | 14 | 67 | 27656 | 157.74 | 735 | 737 | 170.7 |
| C | 9 | 54 | 15884 | 88.76 | 735 | 737 | 170.7 |
| D | 13 | 235 | 326451 | 1903.86 | 724 | 705 | 171.1 |
| D | 9 | 35 | 60942 | 352.06 | 724 | 705 | 171.1 |
| D | 2 | 136 | 55488 | 320.19 | 724 | 705 | 171.1 |
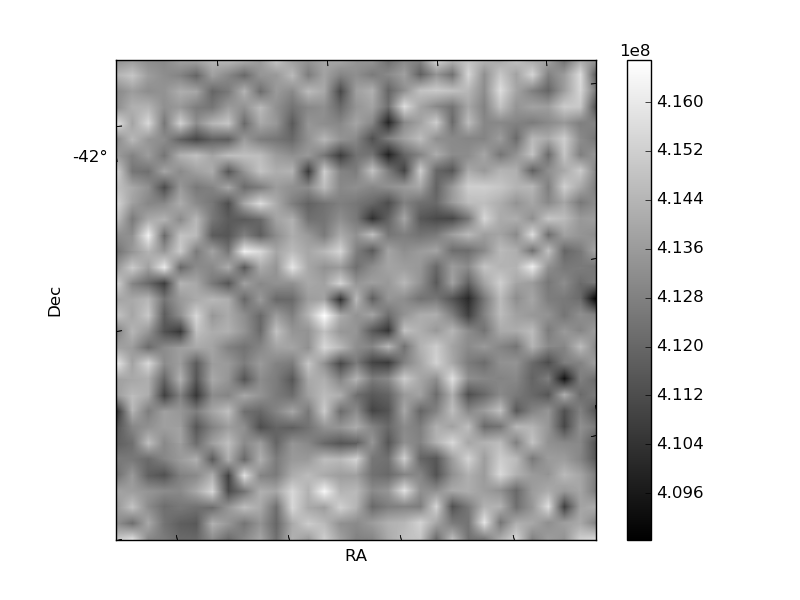
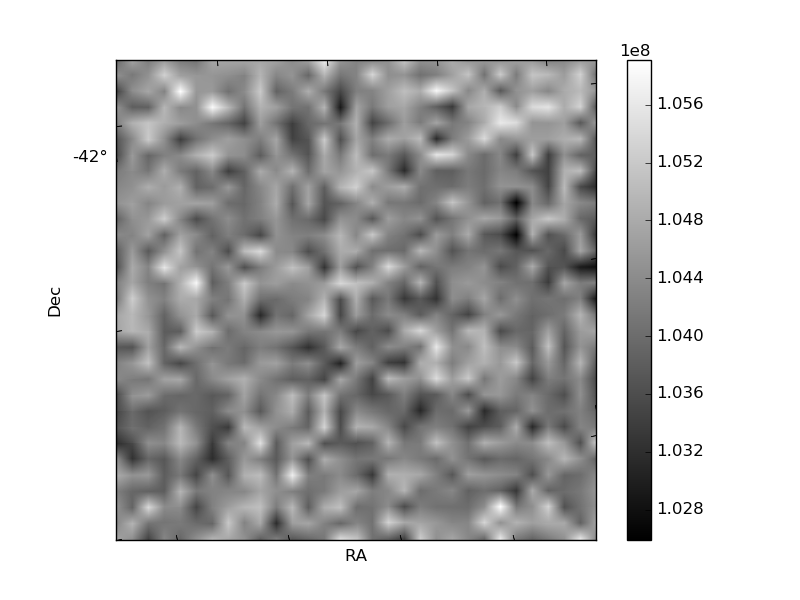
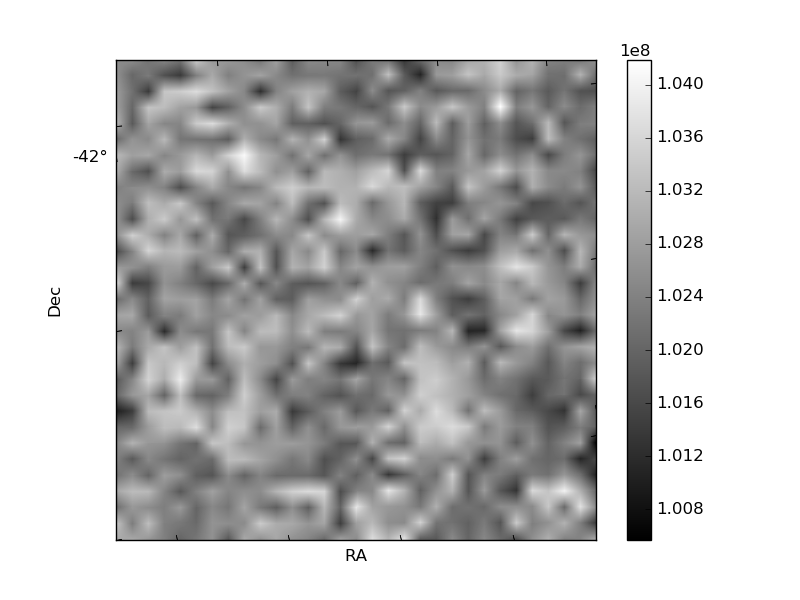
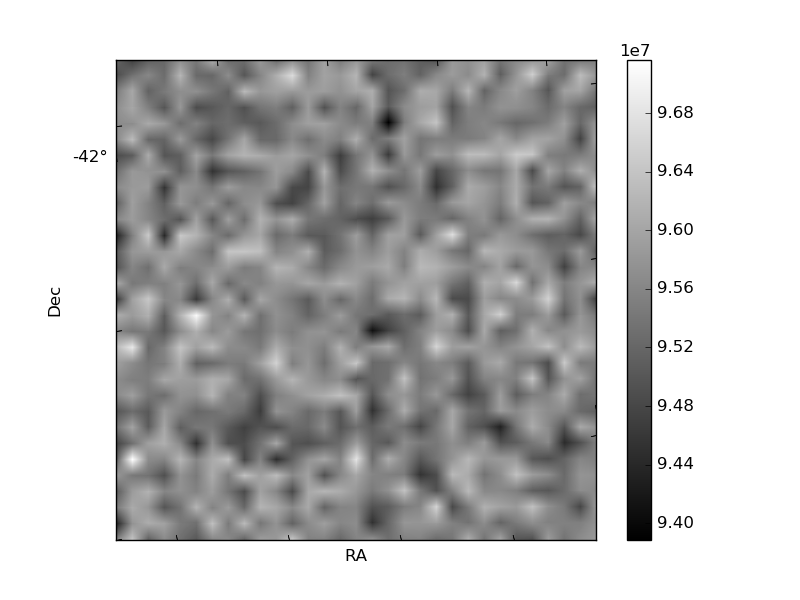
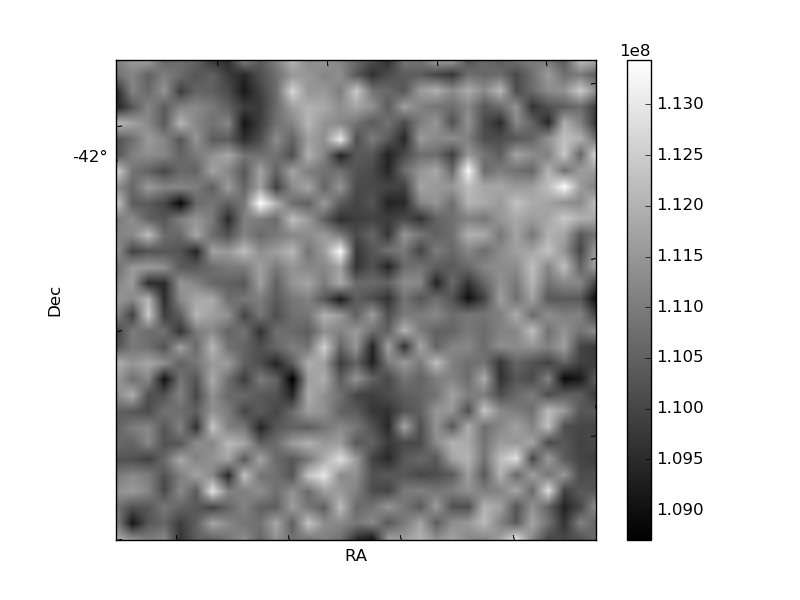
Histogram calculated using DETX and DETY for each event in the final _common_clean file
| Quadrant A | 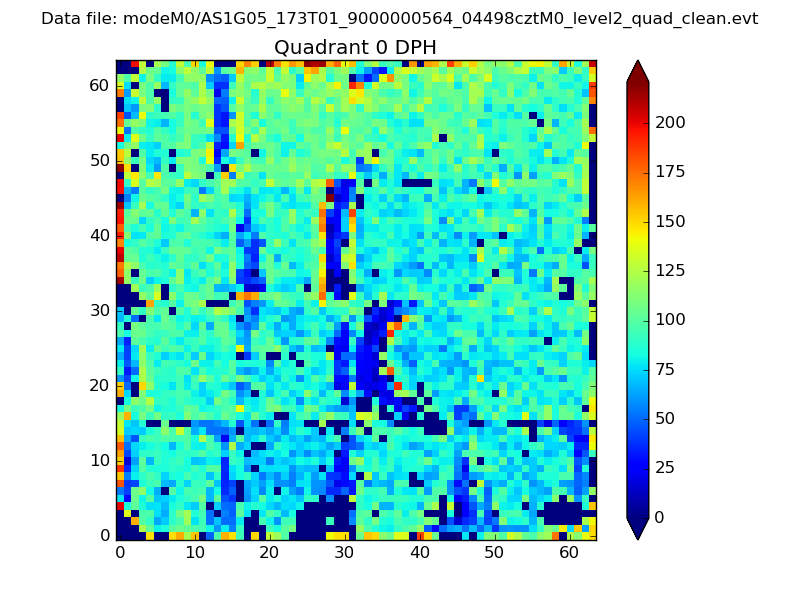 |
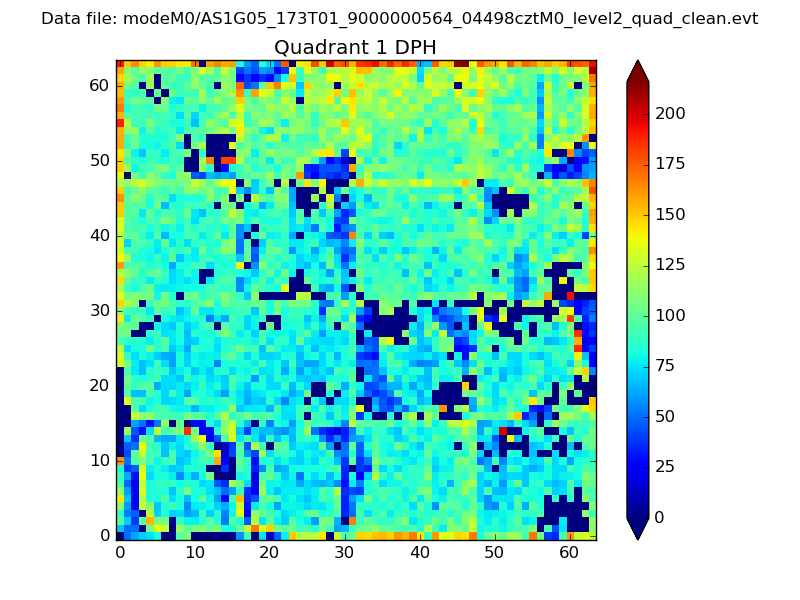 |
Quadrant B |
|---|---|---|---|
| Quadrant D | 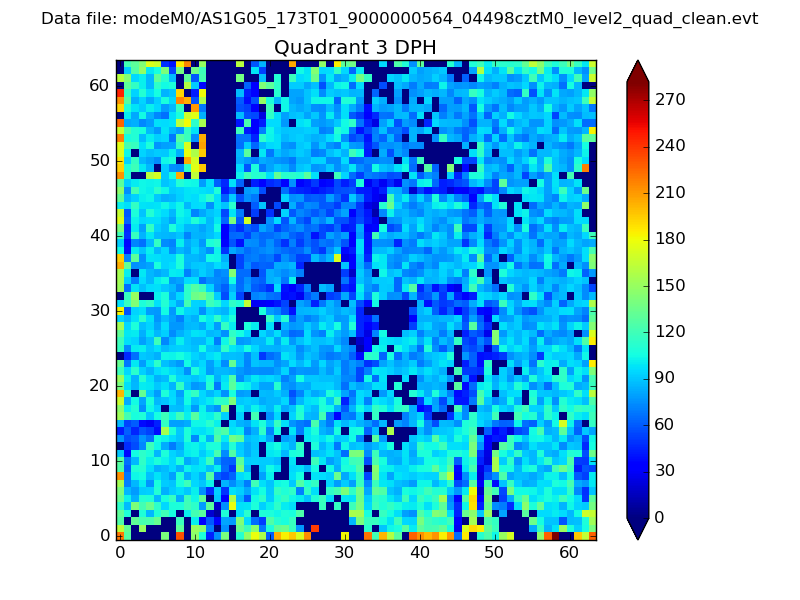 |
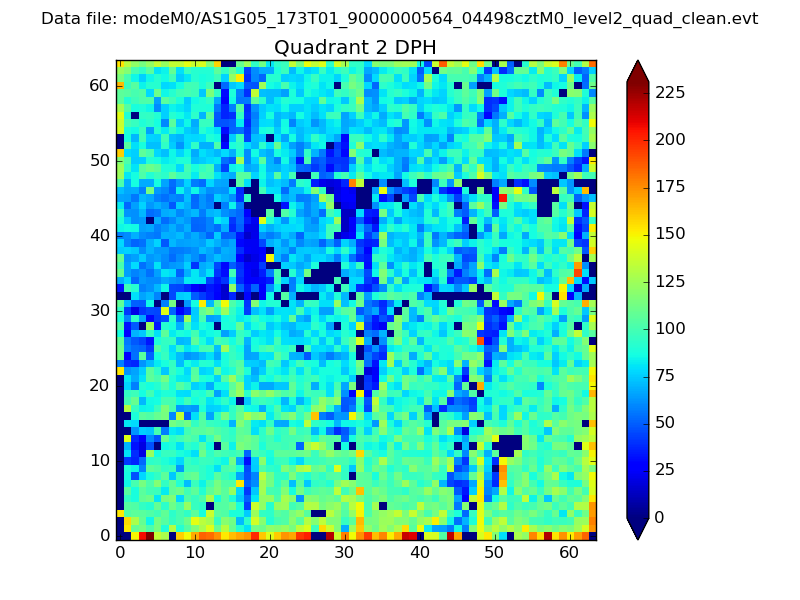 |
Quadrant C |
| Plot type | Count rate plots | Images |
|---|---|---|
| Comparison with Poisson distribution Blue bars denote a histogram of data divided into 1 sec bins. Red curve is a Poisson curve with rate = median count rate of data. |
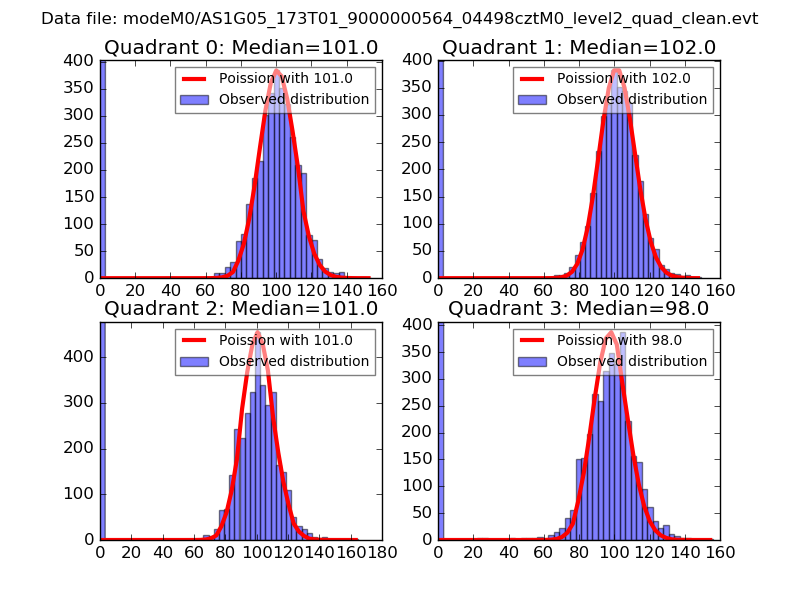 |
 |
| Quadrant-wise count rates Data is divided into 100 sec bins |
 |
|
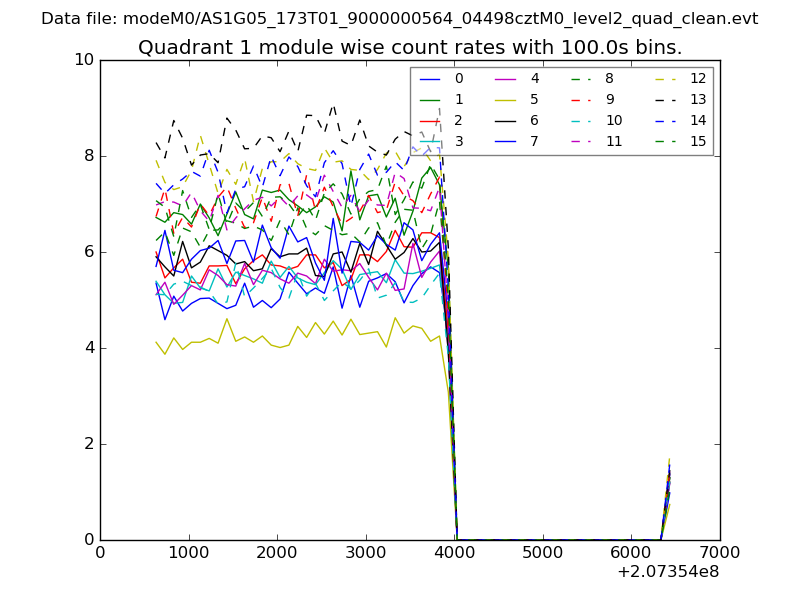
| Module-wise count rates for Quadrant A Data is divided into 100 sec bins |
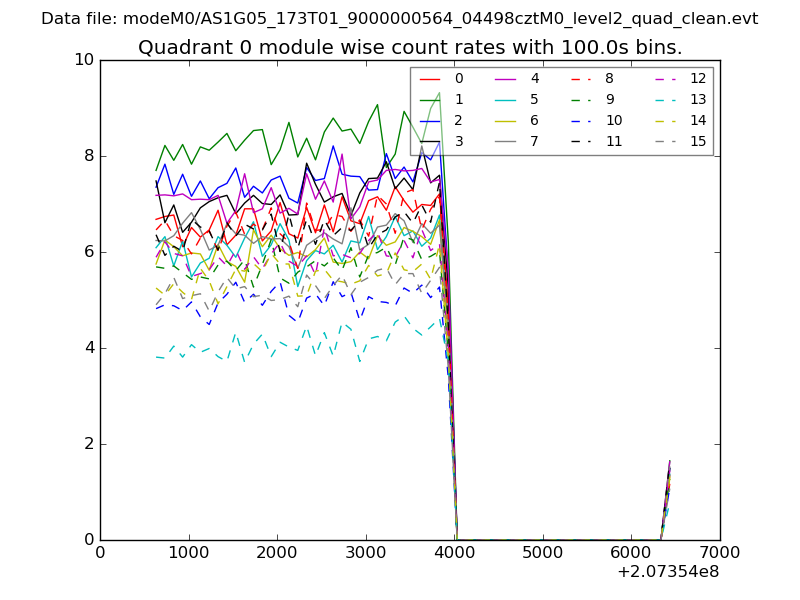 |
 |
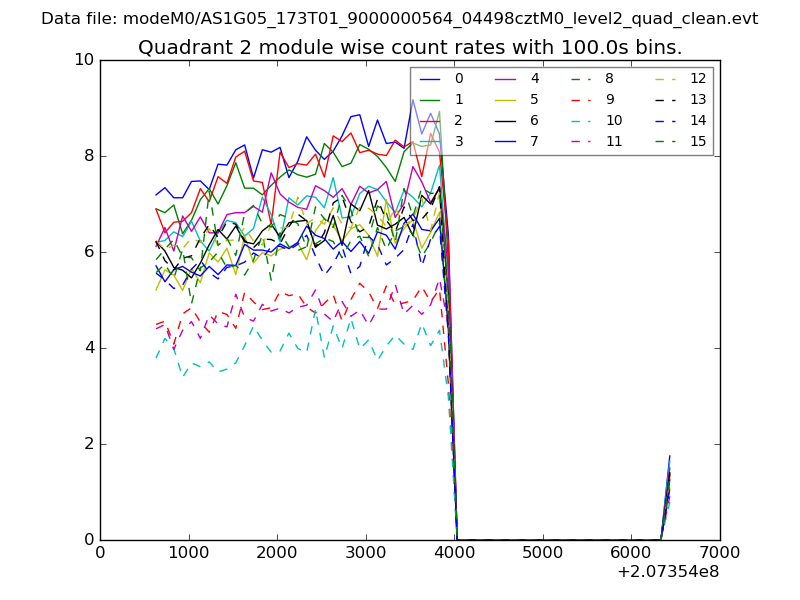
| Module-wise count rates for Quadrant B Data is divided into 100 sec bins |
 |
 |
| Module-wise count rates for Quadrant C Data is divided into 100 sec bins |
 |
 |
| Module-wise count rates for Quadrant D Data is divided into 100 sec bins |
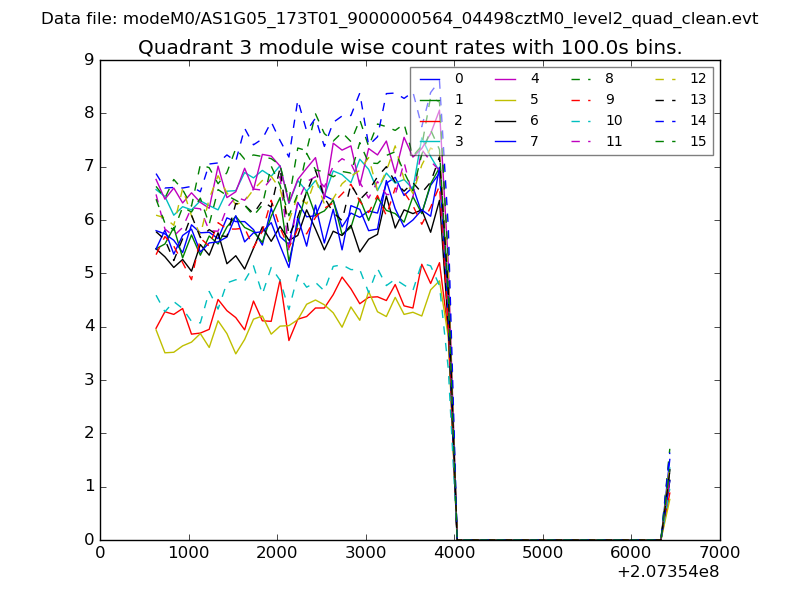 |
 |
| Parameter | Plot |
|---|---|
| CZT HV Monitor | 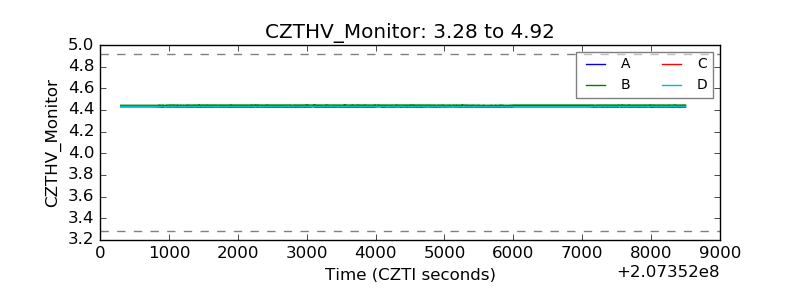 |
| D_VDD | 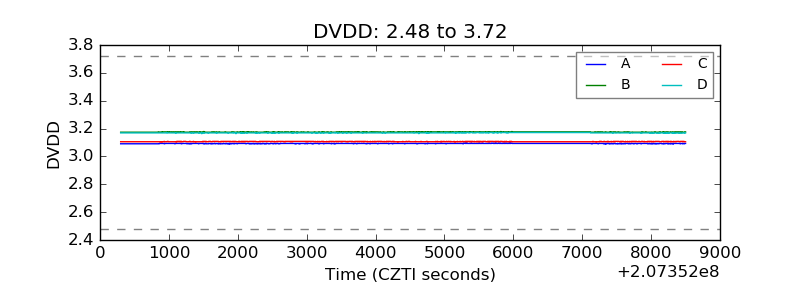 |
| Temperature 1 | 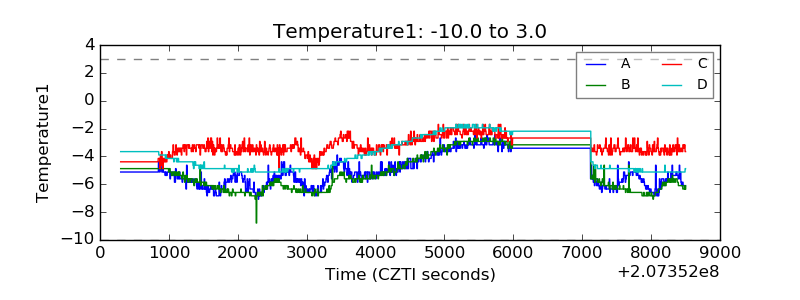 |
| Veto HV Monitor | 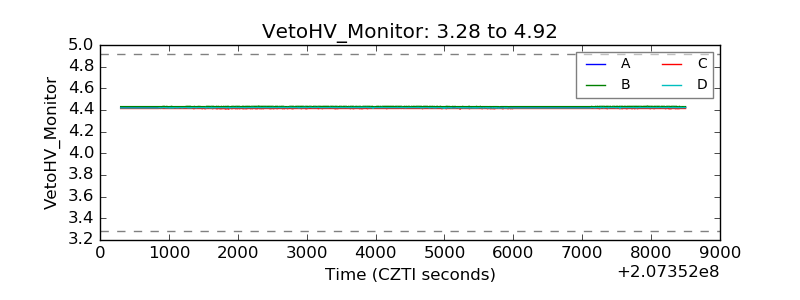 |
| Veto LLD | 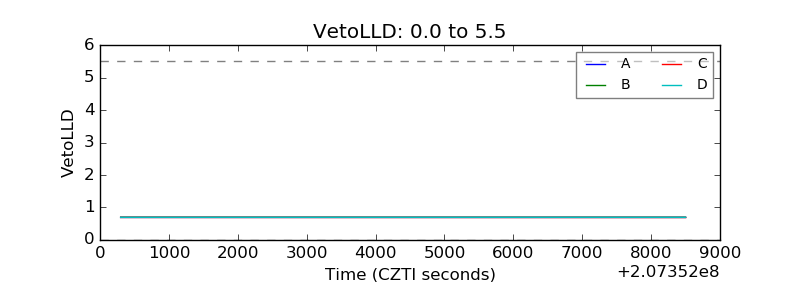 |
| Alpha Counter | 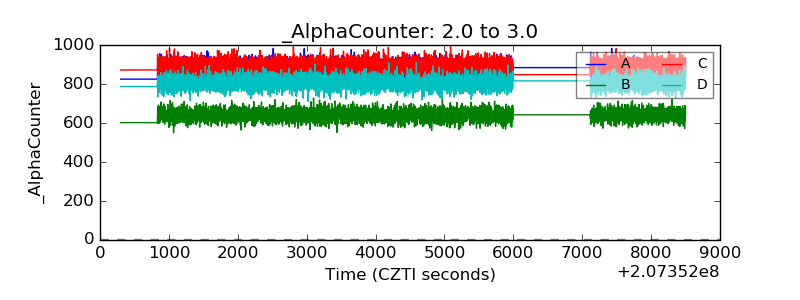 |
| _CPM_Rate | 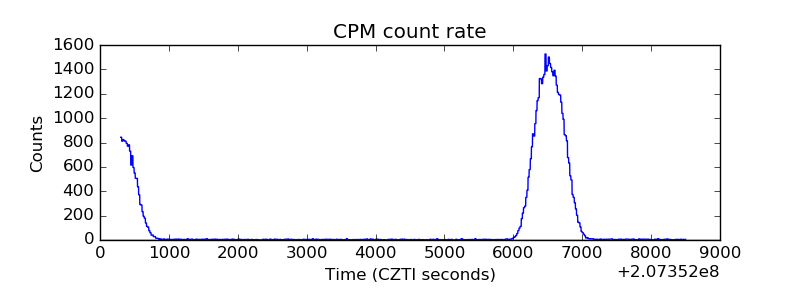 |
| CZT Counter | 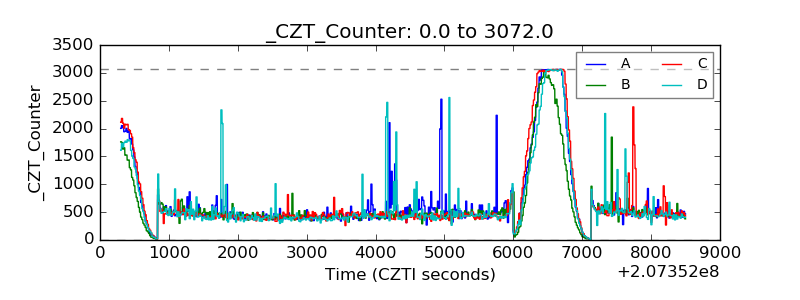 |
| +2.5 Volts monitor |  |
| +5 Volts monitor |  |
| _ROLL_ROT | 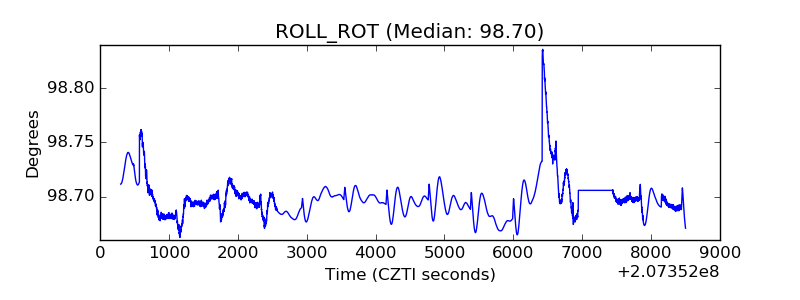 |
| _Roll_DEC | 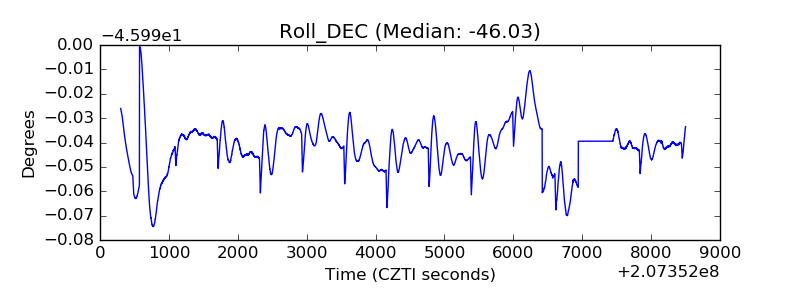 |
| _Roll_RA | 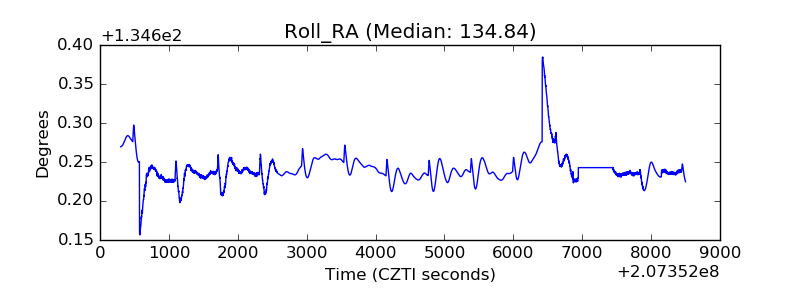 |
| Veto Counter | 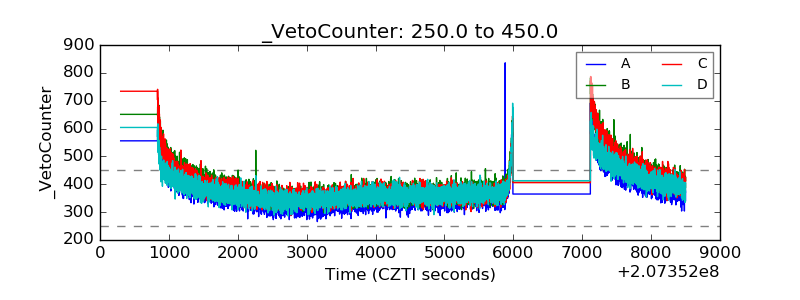 |