| Param | Original file | Final file |
|---|---|---|
| Filename | modeM0/AS1G05_083T03_9000000566cztM0_level2.fits | modeM0/AS1G05_083T03_9000000566cztM0_level2_quad_clean.evt |
| Size (bytes) | 385,378,560 | 406,961,280 |
| Size | 367.5 MB | 388.1 MB |
| Events in quadrant A | 2,314,000 | 2,471,230 |
| Events in quadrant B | 2,216,310 | 2,414,251 |
| Events in quadrant C | 2,309,724 | 2,404,138 |
| Events in quadrant D | 1,970,968 | 2,177,647 |
| Mode SS | |||
|---|---|---|---|
| Quadrant | BADHDUFLAG | Total packets | Discarded packets |
| A | 0 | 964 | 0 |
| B | 0 | 964 | 0 |
| C | 0 | 964 | 0 |
| D | 0 | 964 | 0 |
| Mode M0 | |||
|---|---|---|---|
| Quadrant | BADHDUFLAG | Total packets | Discarded packets |
| A | 0 | 100215 | 0 |
| B | 0 | 110301 | 0 |
| C | 0 | 91514 | 0 |
| D | 0 | 108225 | 0 |
| Mode M9 | |||
|---|---|---|---|
| Quadrant | BADHDUFLAG | Total packets | Discarded packets |
| A | 0 | 77 | 0 |
| B | 0 | 77 | 0 |
| C | 0 | 77 | 0 |
| D | 0 | 77 | 0 |
| Quadrant | Total seconds | Saturated seconds | Saturation percentage |
|---|---|---|---|
| A | 41228 | 1954 | 4.739497% |
| B | 41244 | 2577 | 6.248182% |
| C | 41230 | 848 | 2.056755% |
| D | 41247 | 2021 | 4.899750% |
Noise dominated data is calculated using 1-second bins in cleaned event files. If a bin has >2000 counts, and if more than 50% of those come from <1% of pixels, then it is considered to be noise-dominated and hence unusable.
| Quadrant | # 1 sec bins | Bins with >0 counts | Bins with >2000 counts | High rate bins dominated by noise | Noise dominated (total time) | Noise dominated (detector-on time) | Marked lightcurve |
|---|---|---|---|---|---|---|---|
| A | 60885 | 41331 | 0 | 0 | 0.00% | 0.00% | 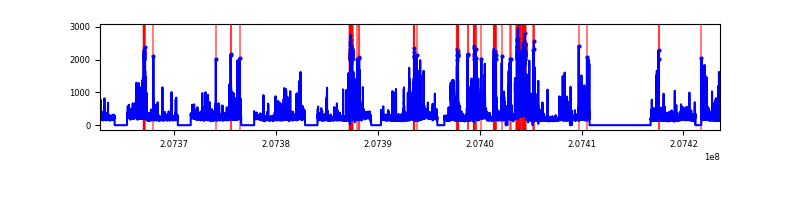 |
| B | 60885 | 41306 | 0 | 0 | 0.00% | 0.00% | 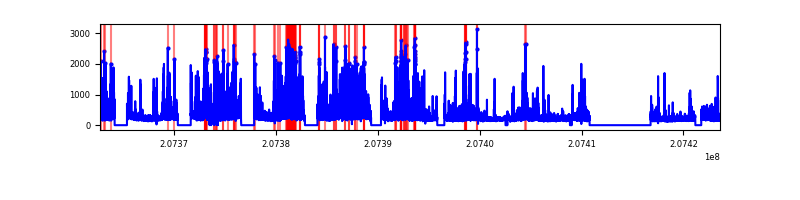 |
| C | 60885 | 41344 | 0 | 0 | 0.00% | 0.00% |  |
| D | 60885 | 41370 | 0 | 0 | 0.00% | 0.00% | 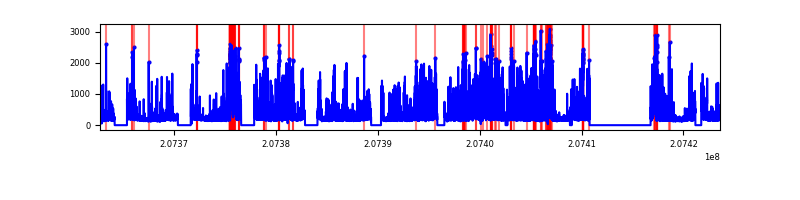 |
Top three noisy pixels from each quadrant. If the there are fewer than three noisy pixels in the level2.evt file, extra rows are filled as -1
| Pixel properties | Quadrant properties | ||||||
|---|---|---|---|---|---|---|---|
| Quadrant | DetID | PixID | Counts | Sigma | Mean | Median | Sigma |
| A | 7 | 110 | 1983 | 9.19 | 602 | 563 | 154.6 |
| A | 0 | 29 | 1918 | 8.77 | 602 | 563 | 154.6 |
| A | 9 | 19 | 1733 | 7.57 | 602 | 563 | 154.6 |
| B | 2 | 9 | 1866 | 11.03 | 585 | 557 | 118.7 |
| B | 12 | 226 | 1592 | 8.72 | 585 | 557 | 118.7 |
| B | 14 | 254 | 1508 | 8.01 | 585 | 557 | 118.7 |
| C | 1 | 81 | 1665 | 6.79 | 609 | 563 | 162.3 |
| C | 1 | 80 | 1653 | 6.71 | 609 | 563 | 162.3 |
| C | 12 | 241 | 1570 | 6.2 | 609 | 563 | 162.3 |
| D | 11 | 82 | 1635 | 7.31 | 562 | 509 | 154.1 |
| D | 3 | 14 | 1531 | 6.63 | 562 | 509 | 154.1 |
| D | 7 | 3 | 1461 | 6.18 | 562 | 509 | 154.1 |
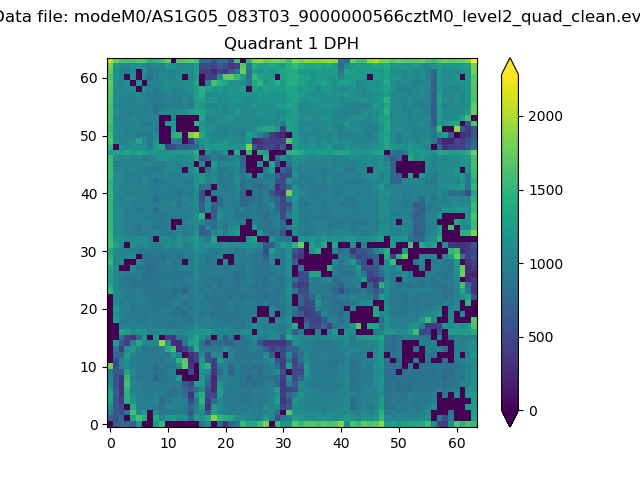
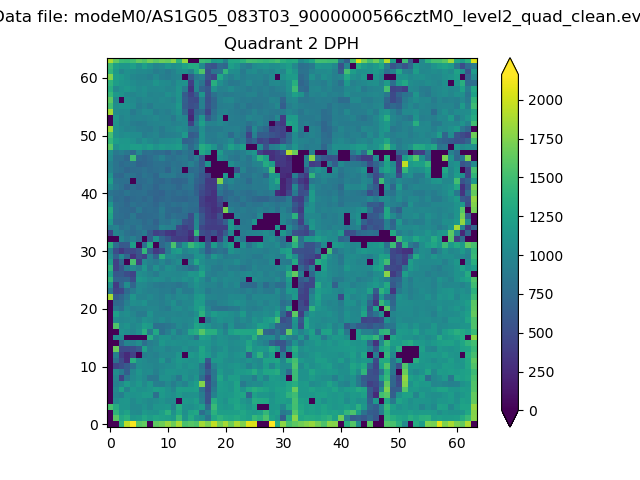
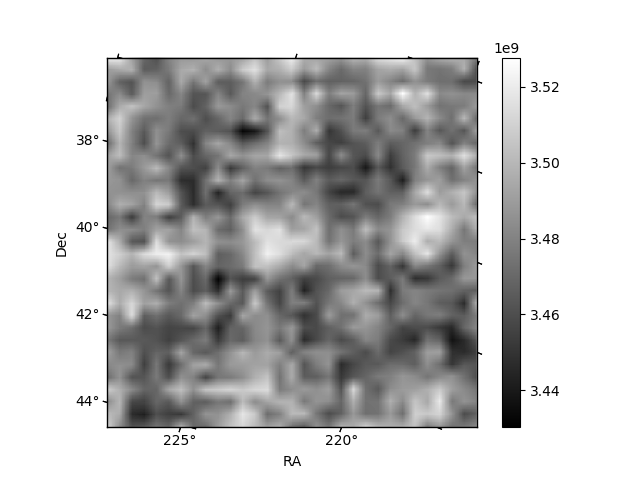
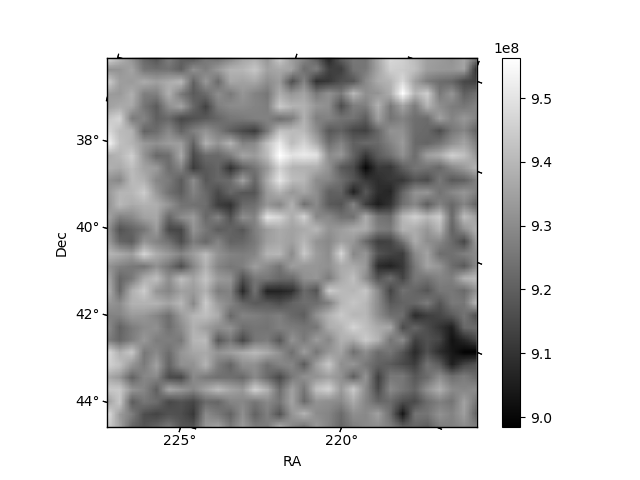
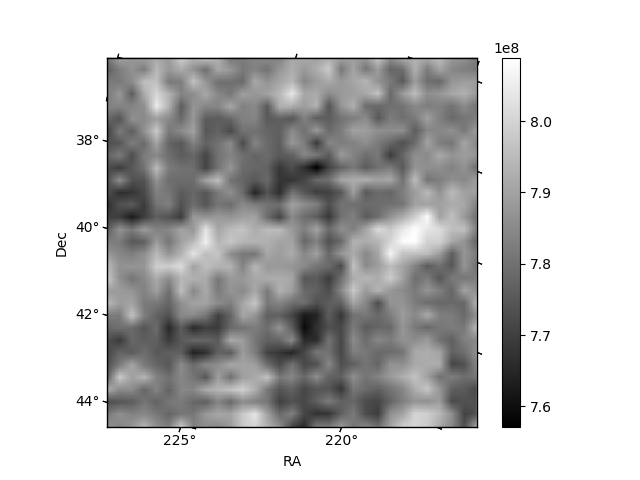
Histogram calculated using DETX and DETY for each event in the final _common_clean file
| Quadrant A | 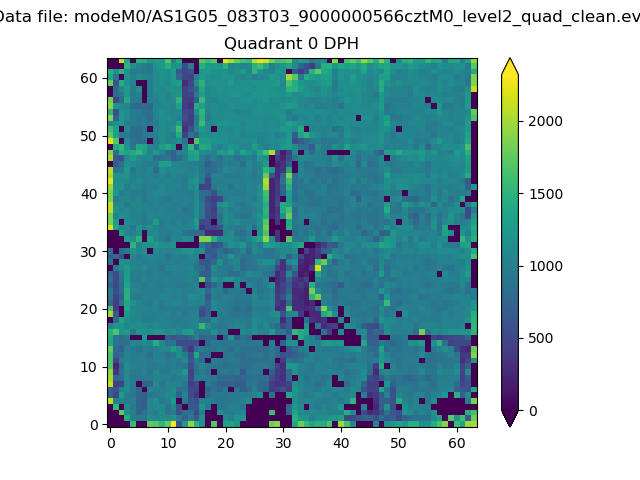 |
 |
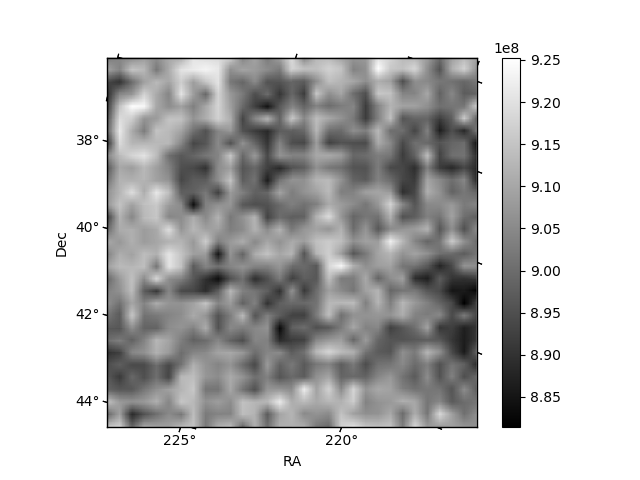
Quadrant B |
|---|---|---|---|
| Quadrant D | 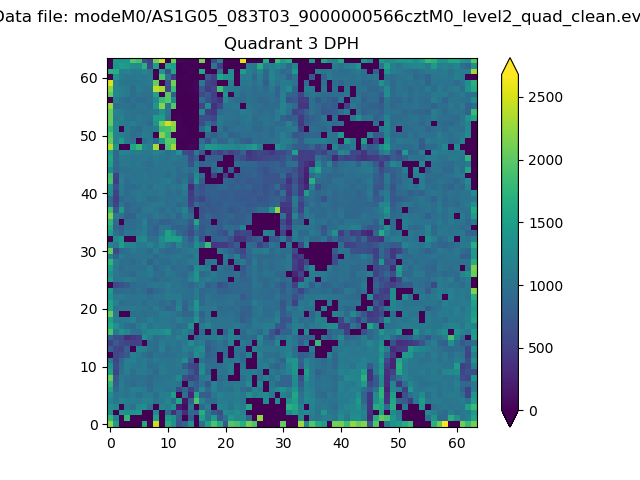 |
 |
Quadrant C |
| Plot type | Count rate plots | Images |
|---|---|---|
| Comparison with Poisson distribution Blue bars denote a histogram of data divided into 1 sec bins. Red curve is a Poisson curve with rate = median count rate of data. |
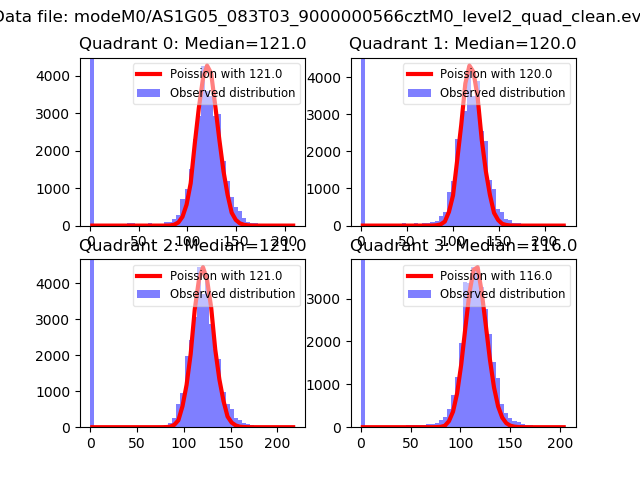 |
 |
| Quadrant-wise count rates Data is divided into 100 sec bins |
 |
|
| Module-wise count rates for Quadrant A Data is divided into 100 sec bins |
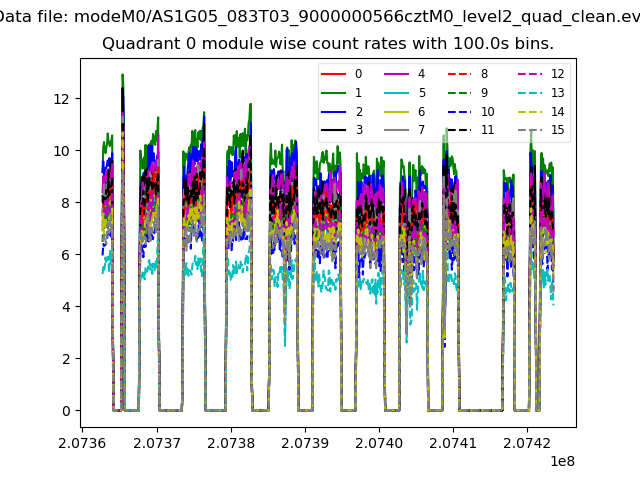 |
 |
| Module-wise count rates for Quadrant B Data is divided into 100 sec bins |
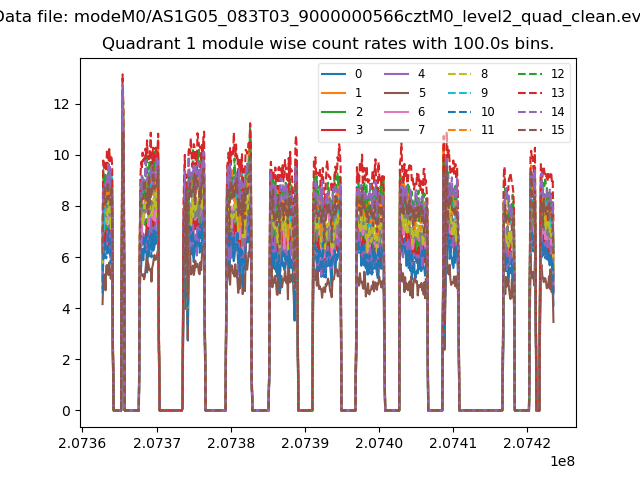 |
 |
| Module-wise count rates for Quadrant C Data is divided into 100 sec bins |
 |
 |
| Module-wise count rates for Quadrant D Data is divided into 100 sec bins |
 |
 |
| Parameter | Plot |
|---|---|
| CZT HV Monitor | 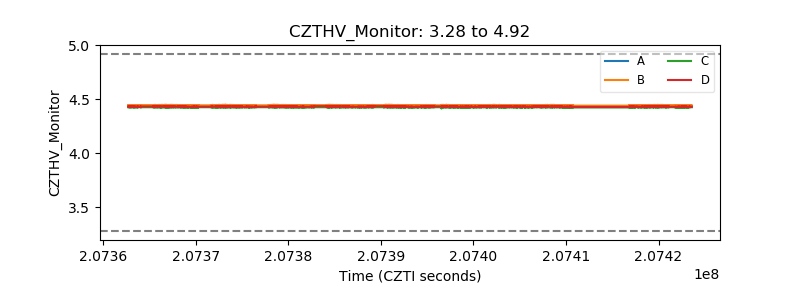 |
| D_VDD | 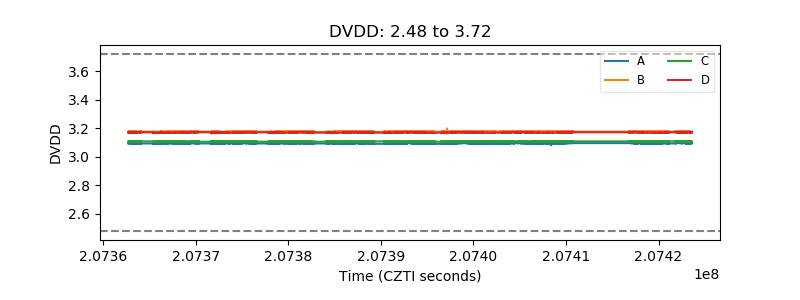 |
| Temperature 1 | 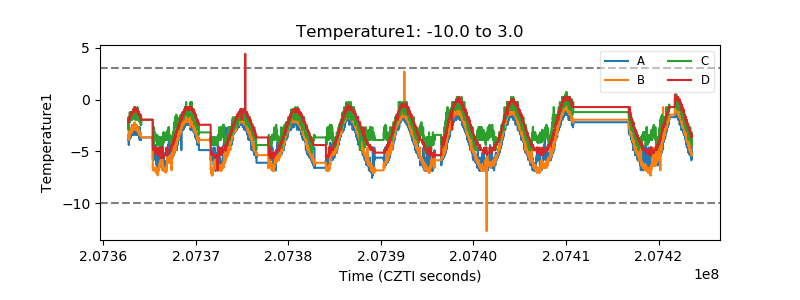 |
| Veto HV Monitor | 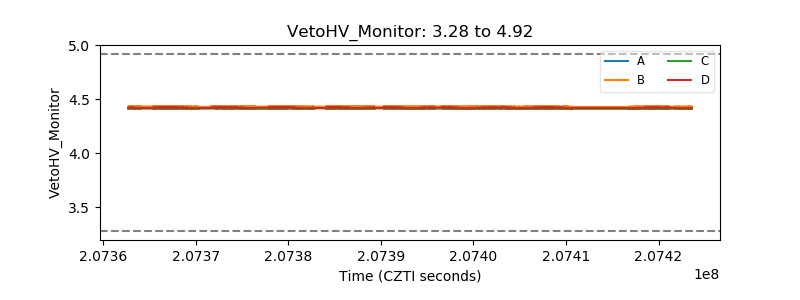 |
| Veto LLD |  |
| Alpha Counter |  |
| _CPM_Rate | 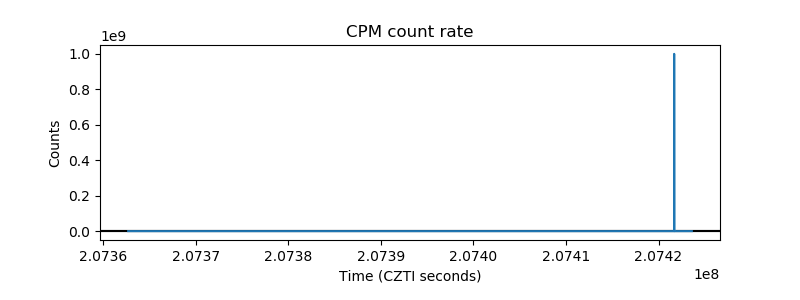 |
| CZT Counter | 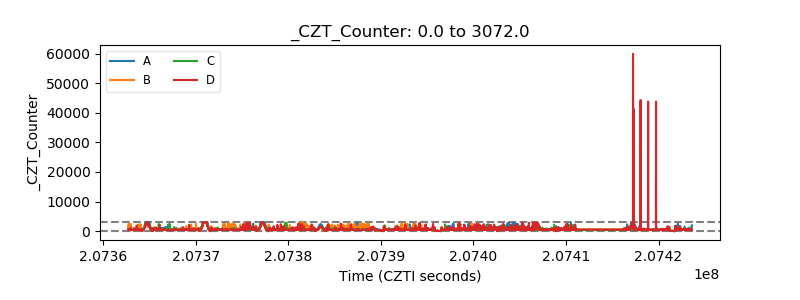 |
| +2.5 Volts monitor | 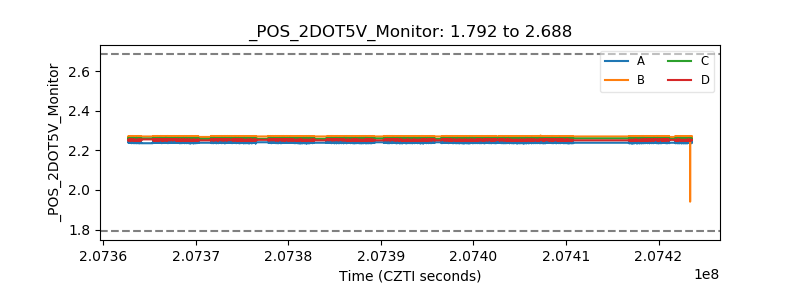 |
| +5 Volts monitor |  |
| _ROLL_ROT | 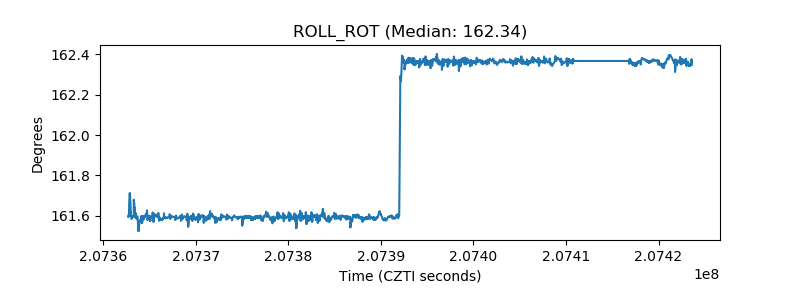 |
| _Roll_DEC | 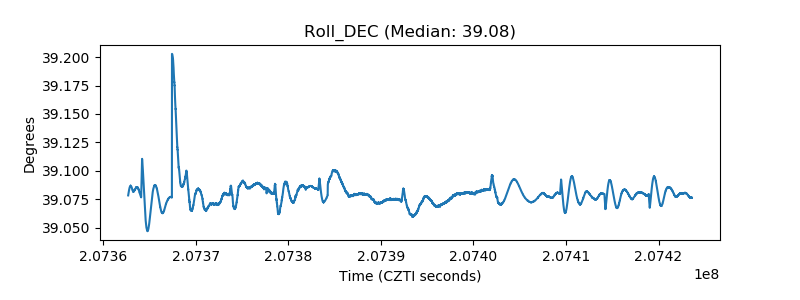 |
| _Roll_RA | 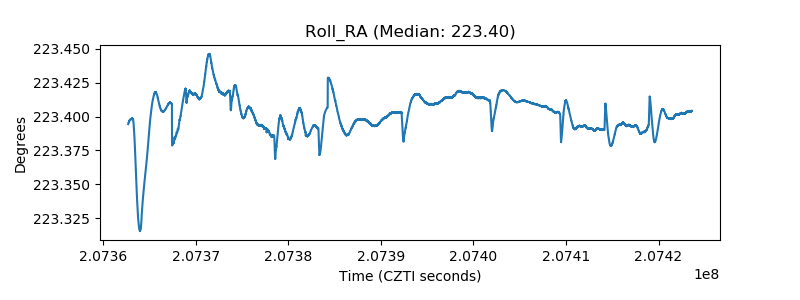 |
| Veto Counter | 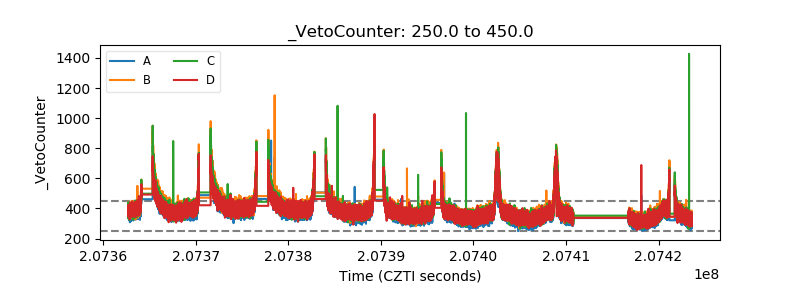 |