| Param | Original file | Final file |
|---|---|---|
| Filename | modeM0/AS1G05_083T03_9000000566_04499cztM0_level2.evt | modeM0/AS1G05_083T03_9000000566_04499cztM0_level2_quad_clean.evt |
| Size (bytes) | 232,911,360 | 33,454,080 |
| Size | 222.1 MB | 31.9 MB |
| Events in quadrant A | 1,771,209 | 204,496 |
| Events in quadrant B | 1,987,241 | 196,902 |
| Events in quadrant C | 1,523,565 | 202,335 |
| Events in quadrant D | 1,566,529 | 195,230 |
| Mode SS | |||
|---|---|---|---|
| Quadrant | BADHDUFLAG | Total packets | Discarded packets |
| A | 0 | 62 | 0 |
| B | 0 | 62 | 0 |
| C | 0 | 62 | 0 |
| D | 0 | 62 | 0 |
| Mode M0 | |||
|---|---|---|---|
| Quadrant | BADHDUFLAG | Total packets | Discarded packets |
| A | 0 | 7145 | 2 |
| B | 0 | 7782 | 1 |
| C | 0 | 6404 | 1 |
| D | 0 | 6676 | 1 |
| Mode M9 | |||
|---|---|---|---|
| Quadrant | BADHDUFLAG | Total packets | Discarded packets |
| A | 0 | 12 | 0 |
| B | 0 | 12 | 0 |
| C | 0 | 12 | 0 |
| D | 0 | 12 | 0 |
| Quadrant | Total seconds | Saturated seconds | Saturation percentage |
|---|---|---|---|
| A | 2993 | 13 | 0.434347% |
| B | 2993 | 133 | 4.443702% |
| C | 2993 | 15 | 0.501169% |
| D | 2993 | 28 | 0.935516% |
Noise dominated data is calculated using 1-second bins in cleaned event files. If a bin has >2000 counts, and if more than 50% of those come from <1% of pixels, then it is considered to be noise-dominated and hence unusable.
| Quadrant | # 1 sec bins | Bins with >0 counts | Bins with >2000 counts | High rate bins dominated by noise | Noise dominated (total time) | Noise dominated (detector-on time) | Marked lightcurve |
|---|---|---|---|---|---|---|---|
| A | 4213 | 2994 | 0 | 0 | 0.00% | 0.00% | 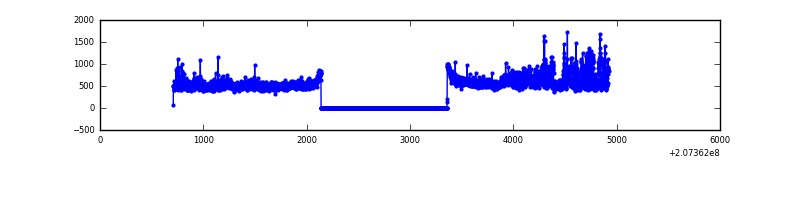 |
| B | 4213 | 2994 | 66 | 66 | 1.57% | 2.20% | 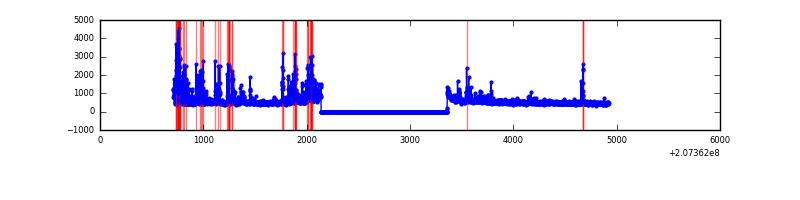 |
| C | 4213 | 2994 | 6 | 6 | 0.14% | 0.20% | 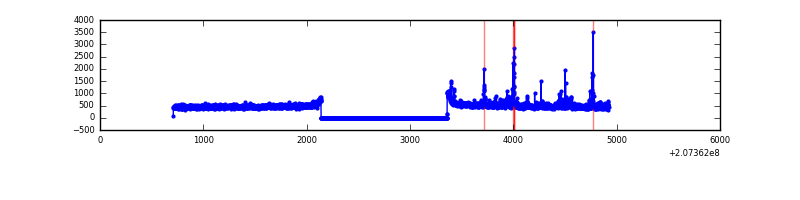 |
| D | 4213 | 2994 | 19 | 19 | 0.45% | 0.63% | 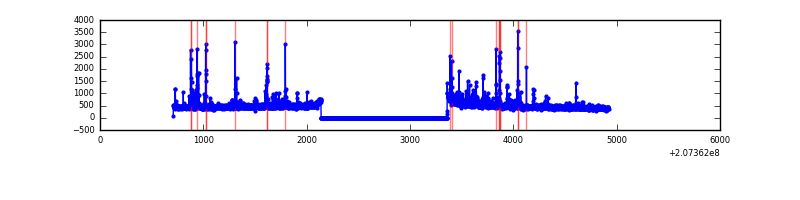 |
Top three noisy pixels from each quadrant. If the there are fewer than three noisy pixels in the level2.evt file, extra rows are filled as -1
| Pixel properties | Quadrant properties | ||||||
|---|---|---|---|---|---|---|---|
| Quadrant | DetID | PixID | Counts | Sigma | Mean | Median | Sigma |
| A | 0 | 31 | 198830 | 2584.73 | 376 | 370 | 76.8 |
| A | 0 | 13 | 95464 | 1238.5 | 376 | 370 | 76.8 |
| A | 7 | 16 | 14830 | 188.33 | 376 | 370 | 76.8 |
| B | 10 | 16 | 492331 | 6778.52 | 374 | 365 | 72.6 |
| B | 4 | 48 | 19519 | 263.91 | 374 | 365 | 72.6 |
| B | 15 | 204 | 19312 | 261.06 | 374 | 365 | 72.6 |
| C | 9 | 247 | 92168 | 1066.48 | 366 | 368 | 86.1 |
| C | 13 | 61 | 2966 | 30.18 | 366 | 368 | 86.1 |
| C | 12 | 4 | 1335 | 11.23 | 366 | 368 | 86.1 |
| D | 13 | 235 | 145443 | 1662.2 | 362 | 352 | 87.3 |
| D | 2 | 136 | 19367 | 217.84 | 362 | 352 | 87.3 |
| D | 10 | 40 | 16041 | 179.74 | 362 | 352 | 87.3 |
Histogram calculated using DETX and DETY for each event in the final _common_clean file
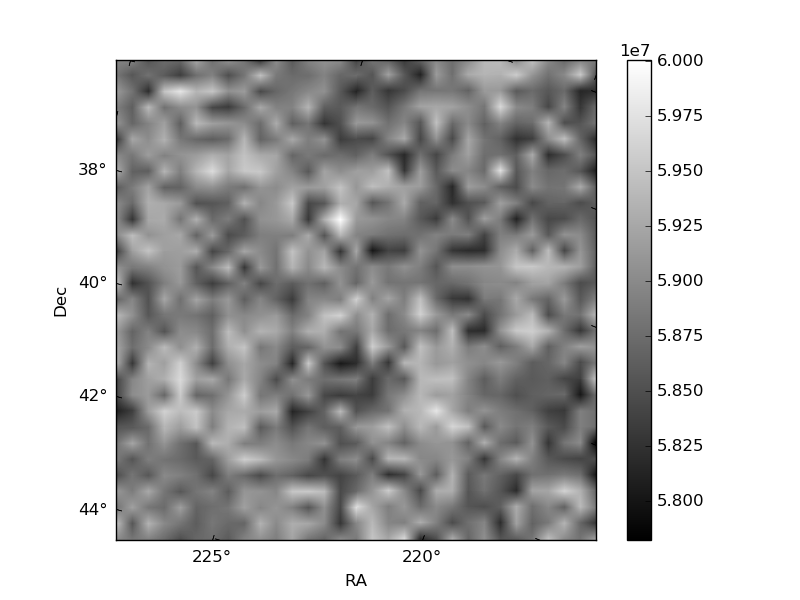
| Quadrant A | 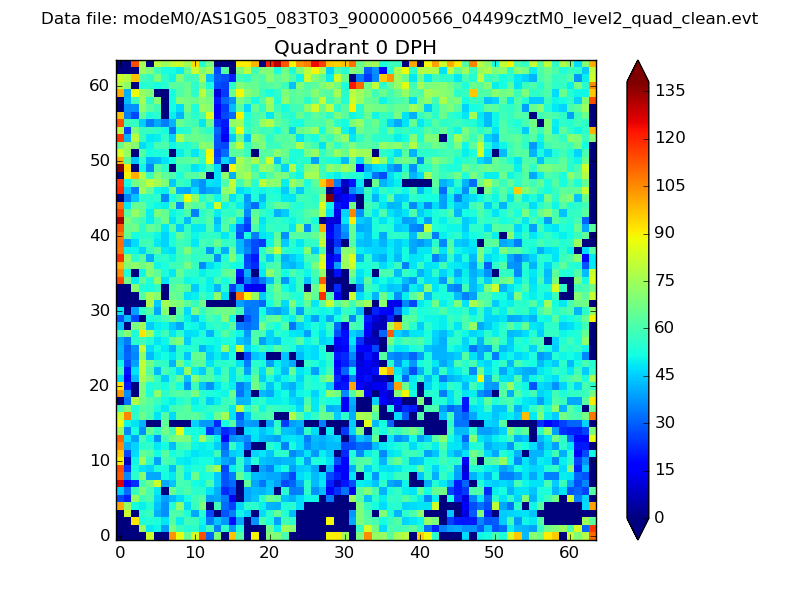 |
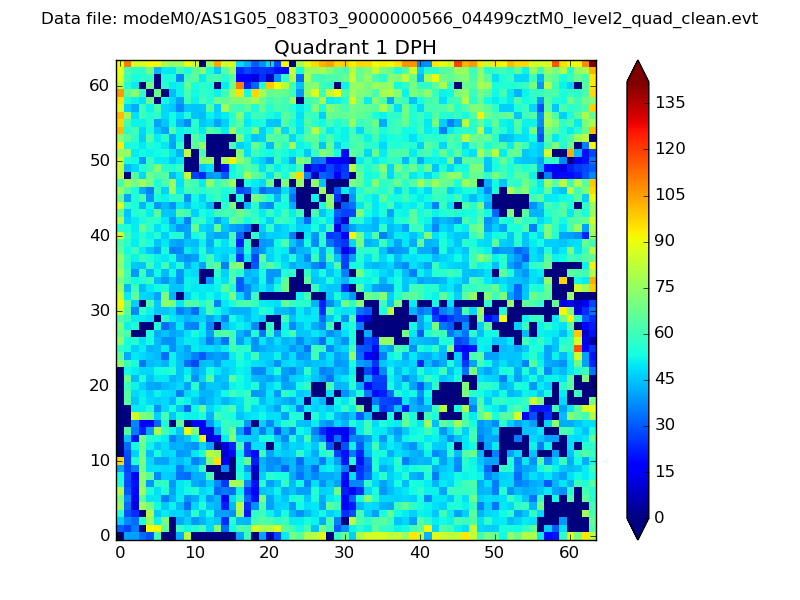 |
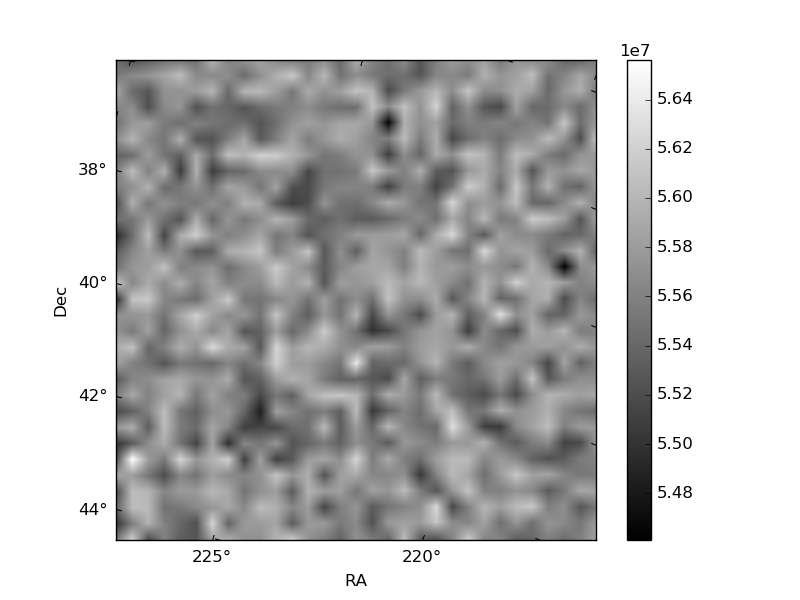
Quadrant B |
|---|---|---|---|
| Quadrant D | 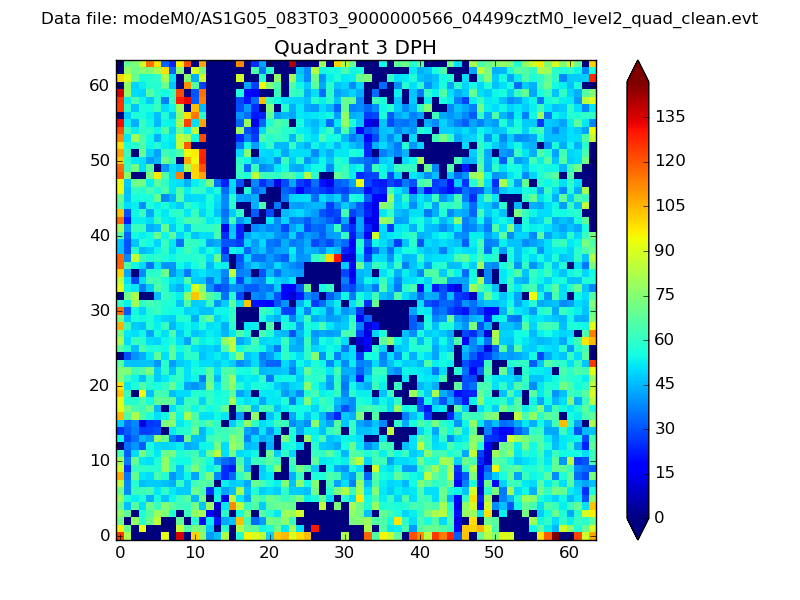 |
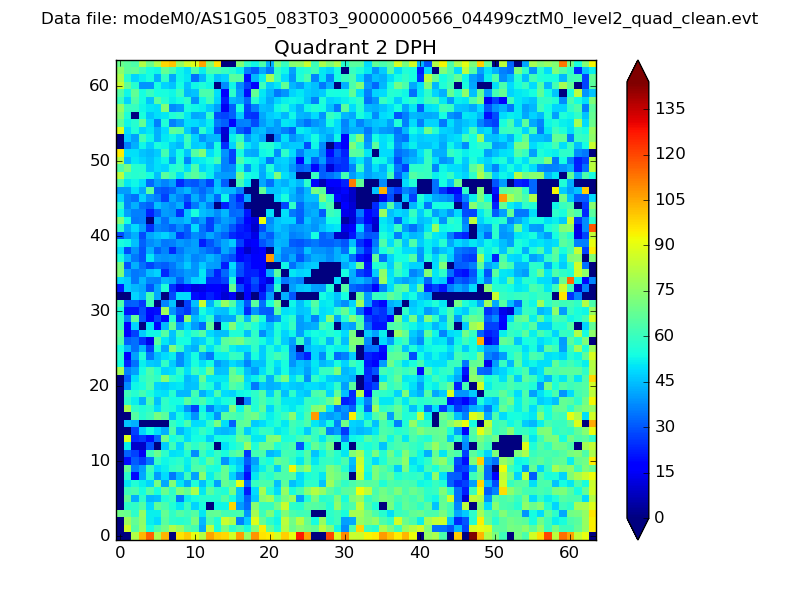 |
Quadrant C |
| Plot type | Count rate plots | Images |
|---|---|---|
| Comparison with Poisson distribution Blue bars denote a histogram of data divided into 1 sec bins. Red curve is a Poisson curve with rate = median count rate of data. |
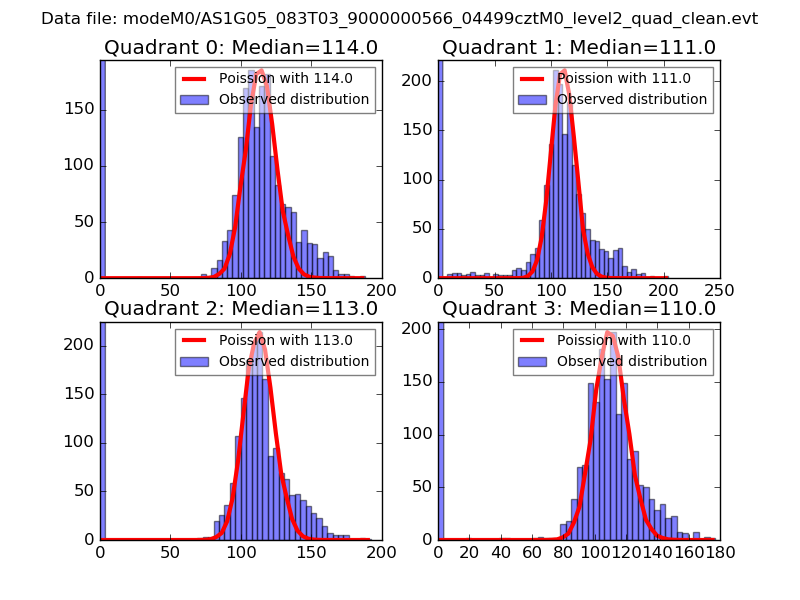 |
 |
| Quadrant-wise count rates Data is divided into 100 sec bins |
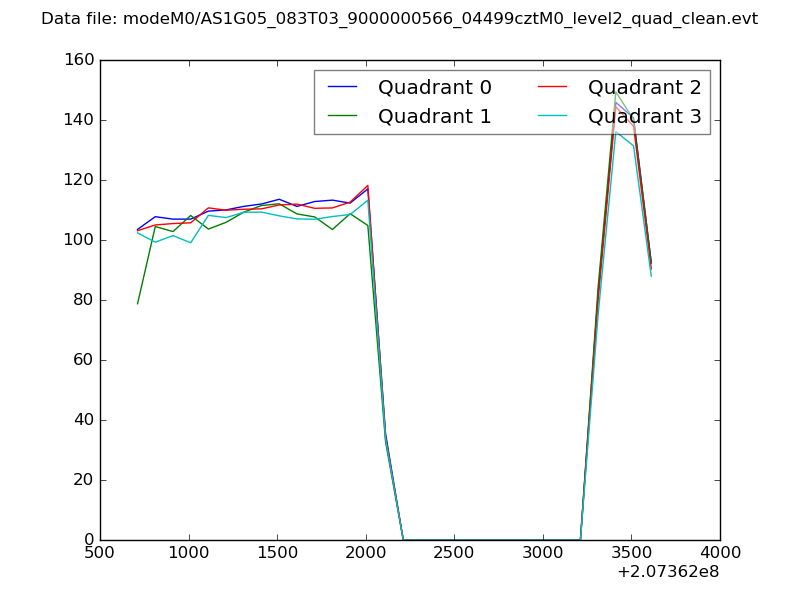 |
|
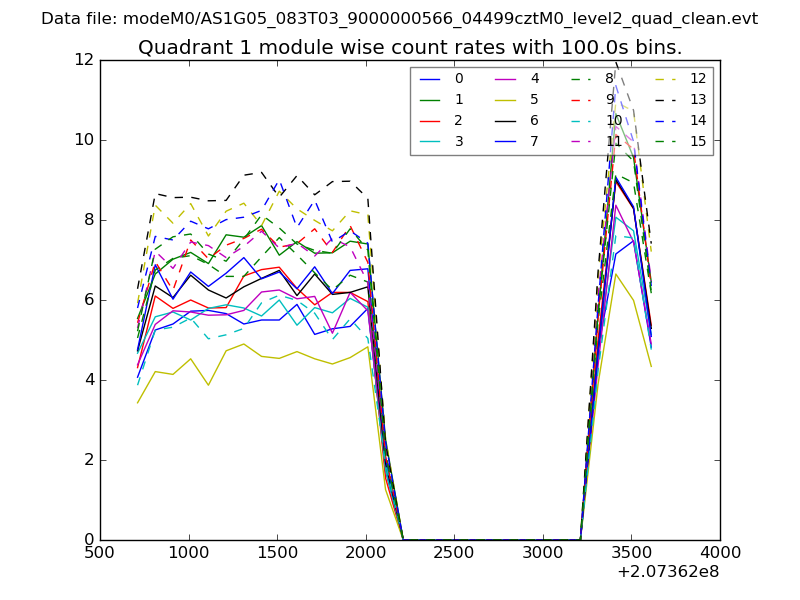
| Module-wise count rates for Quadrant A Data is divided into 100 sec bins |
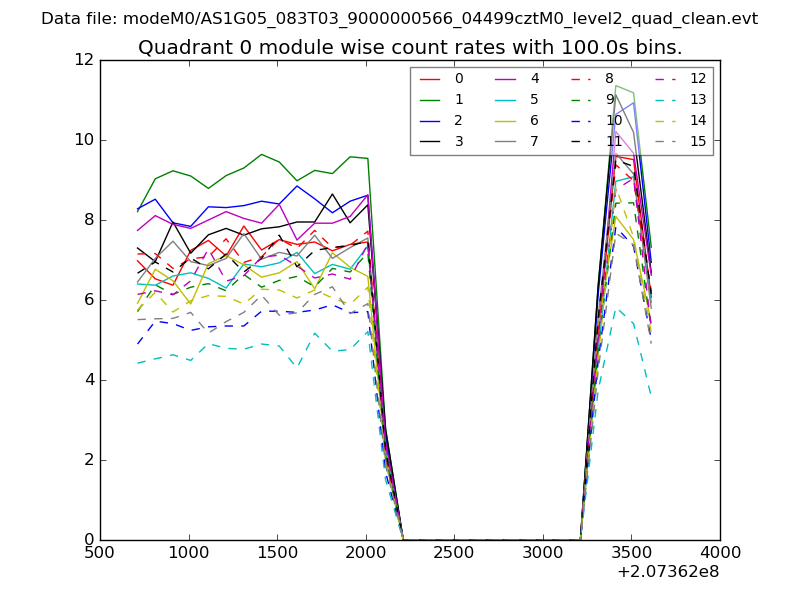 |
 |
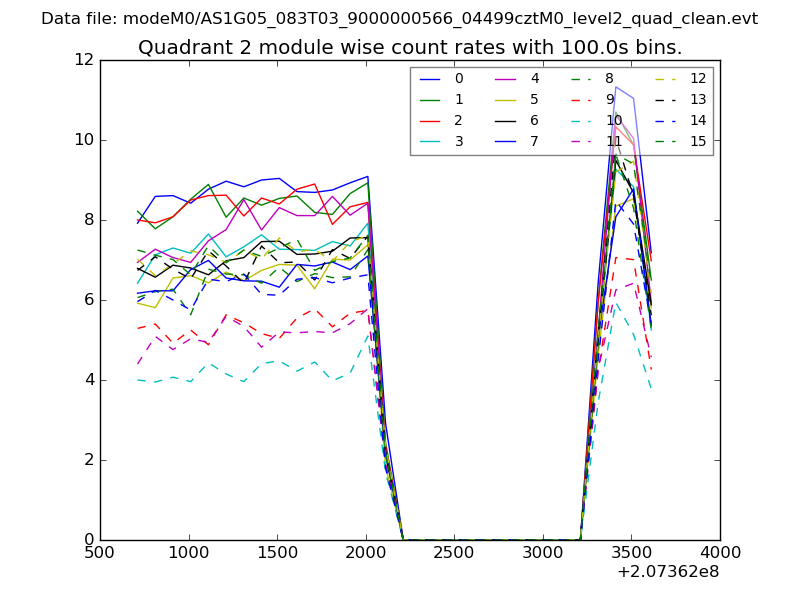
| Module-wise count rates for Quadrant B Data is divided into 100 sec bins |
 |
 |
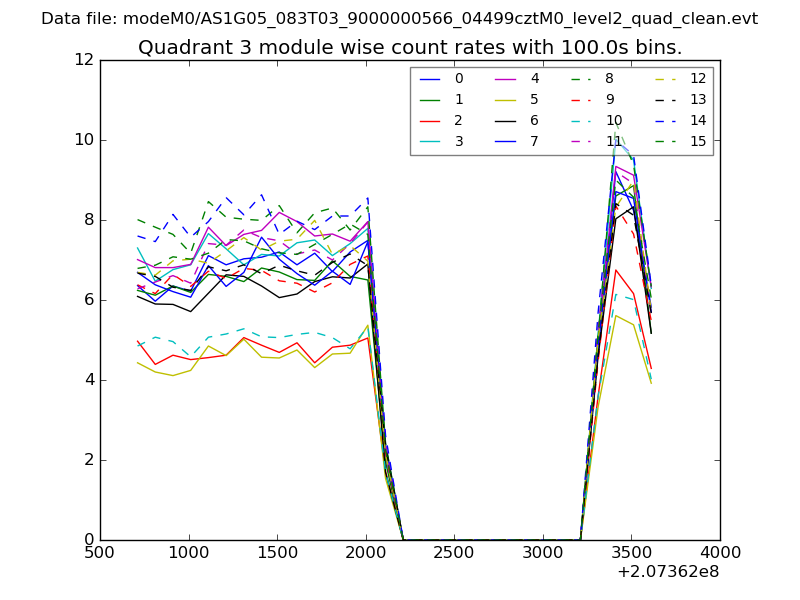
| Module-wise count rates for Quadrant C Data is divided into 100 sec bins |
 |
 |
| Module-wise count rates for Quadrant D Data is divided into 100 sec bins |
 |
 |
| Parameter | Plot |
|---|---|
| CZT HV Monitor | 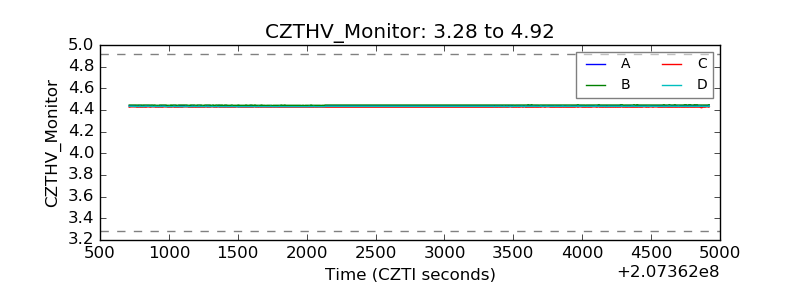 |
| D_VDD | 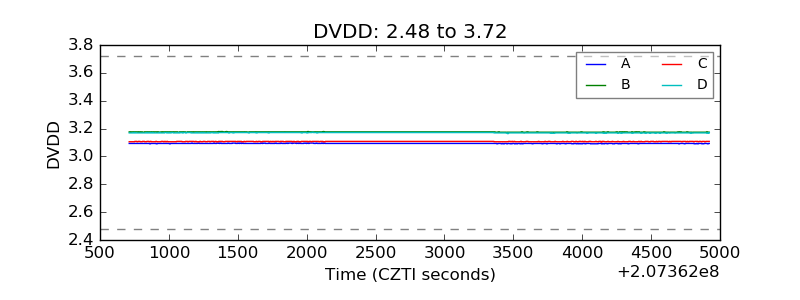 |
| Temperature 1 | 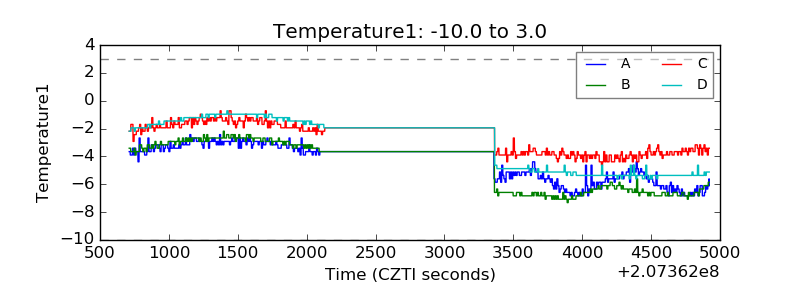 |
| Veto HV Monitor | 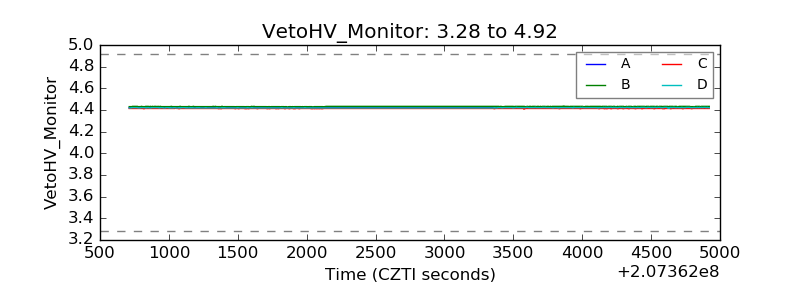 |
| Veto LLD | 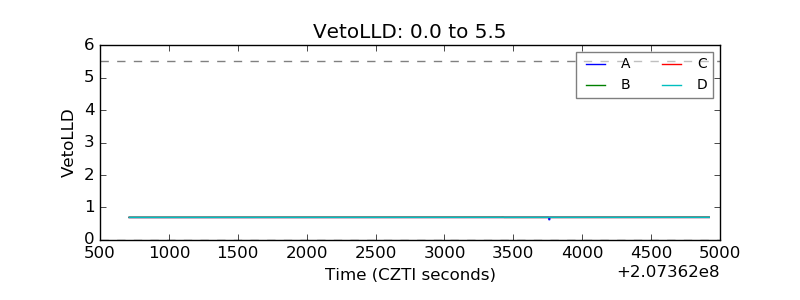 |
| Alpha Counter | 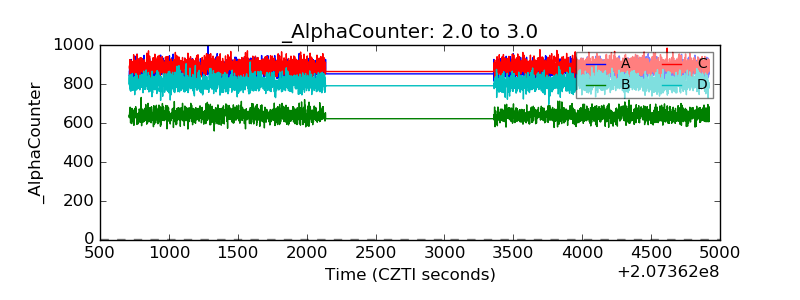 |
| _CPM_Rate | 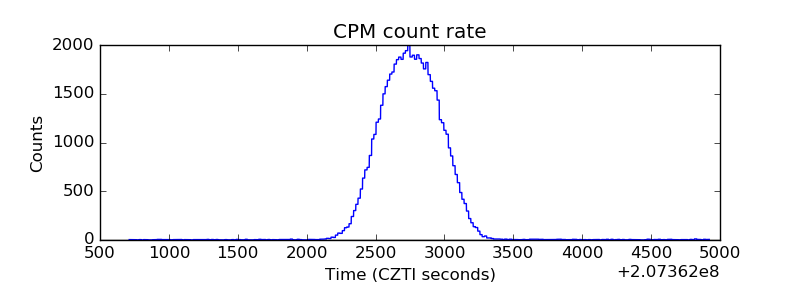 |
| CZT Counter | 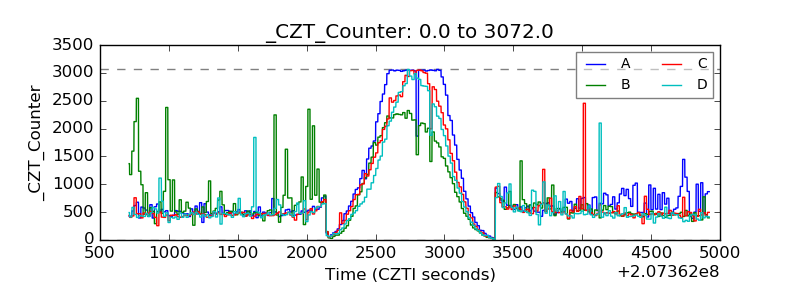 |
| +2.5 Volts monitor |  |
| +5 Volts monitor |  |
| _ROLL_ROT | 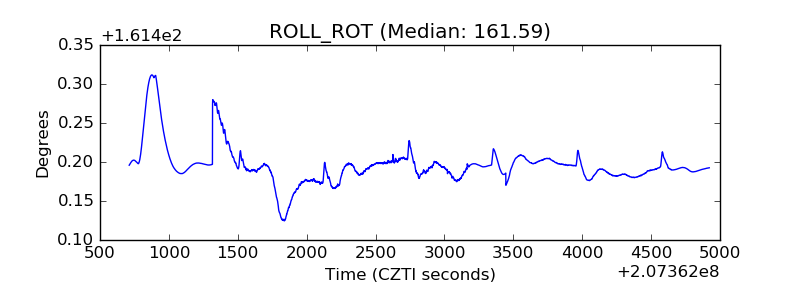 |
| _Roll_DEC | 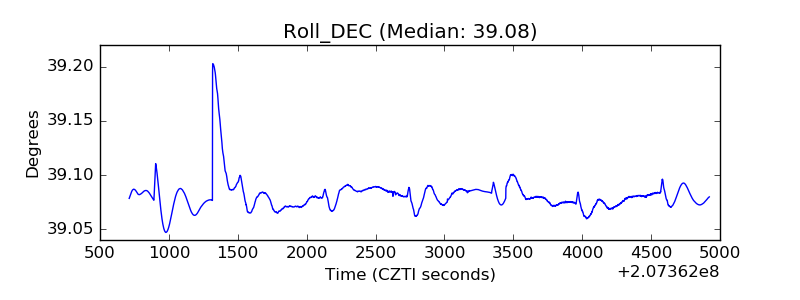 |
| _Roll_RA |  |
| Veto Counter | 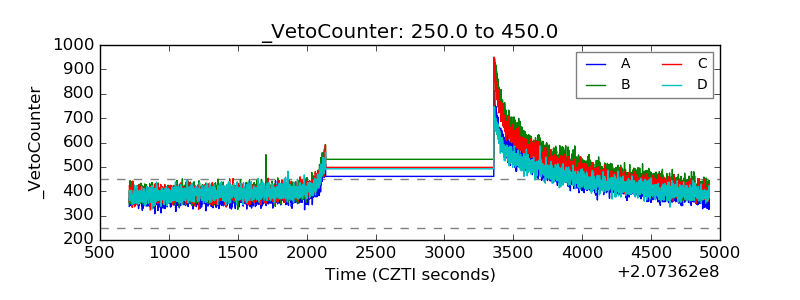 |