| Param | Original file | Final file |
|---|---|---|
| Filename | modeM0/AS1G05_083T03_9000000566_04500cztM0_level2.evt | modeM0/AS1G05_083T03_9000000566_04500cztM0_level2_quad_clean.evt |
| Size (bytes) | 482,319,360 | 57,110,400 |
| Size | 460.0 MB | 54.5 MB |
| Events in quadrant A | 3,701,422 | 324,368 |
| Events in quadrant B | 3,958,237 | 323,695 |
| Events in quadrant C | 3,282,106 | 320,632 |
| Events in quadrant D | 3,227,426 | 310,279 |
| Mode SS | |||
|---|---|---|---|
| Quadrant | BADHDUFLAG | Total packets | Discarded packets |
| A | 0 | 130 | 0 |
| B | 0 | 130 | 0 |
| C | 0 | 130 | 0 |
| D | 0 | 130 | 0 |
| Mode M0 | |||
|---|---|---|---|
| Quadrant | BADHDUFLAG | Total packets | Discarded packets |
| A | 0 | 15081 | 2 |
| B | 0 | 15892 | 1 |
| C | 0 | 13929 | 1 |
| D | 0 | 14129 | 1 |
| Mode M9 | |||
|---|---|---|---|
| Quadrant | BADHDUFLAG | Total packets | Discarded packets |
| A | 0 | 13 | 0 |
| B | 0 | 13 | 0 |
| C | 0 | 13 | 0 |
| D | 0 | 13 | 0 |
| Quadrant | Total seconds | Saturated seconds | Saturation percentage |
|---|---|---|---|
| A | 6452 | 138 | 2.138872% |
| B | 6452 | 193 | 2.991321% |
| C | 6452 | 70 | 1.084935% |
| D | 6452 | 92 | 1.425914% |
Noise dominated data is calculated using 1-second bins in cleaned event files. If a bin has >2000 counts, and if more than 50% of those come from <1% of pixels, then it is considered to be noise-dominated and hence unusable.
| Quadrant | # 1 sec bins | Bins with >0 counts | Bins with >2000 counts | High rate bins dominated by noise | Noise dominated (total time) | Noise dominated (detector-on time) | Marked lightcurve |
|---|---|---|---|---|---|---|---|
| A | 7722 | 6453 | 64 | 64 | 0.83% | 0.99% | 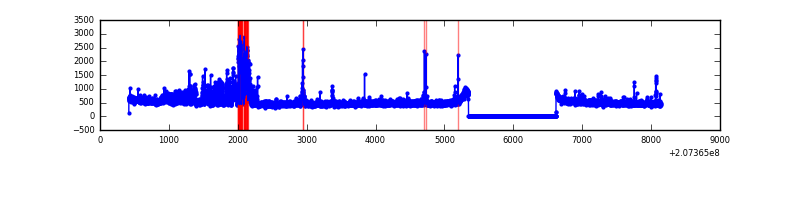 |
| B | 7722 | 6453 | 98 | 98 | 1.27% | 1.52% | 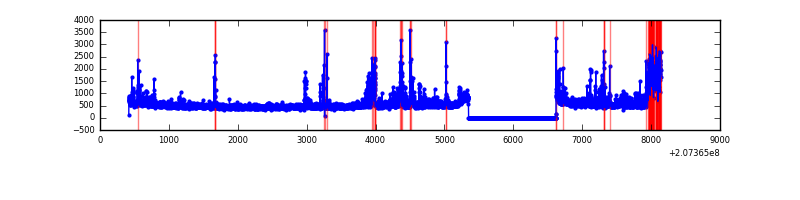 |
| C | 7722 | 6453 | 27 | 27 | 0.35% | 0.42% | 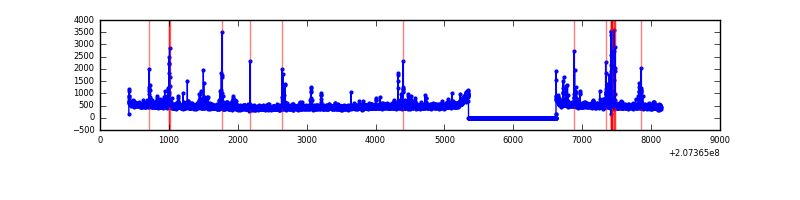 |
| D | 7722 | 6453 | 39 | 39 | 0.51% | 0.60% | 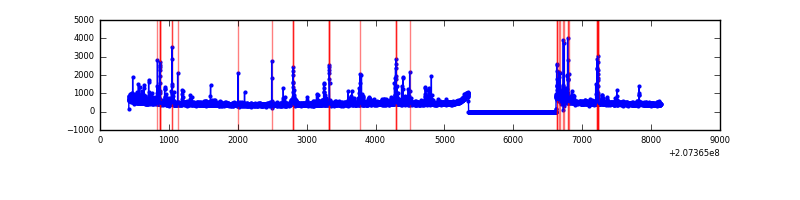 |
Top three noisy pixels from each quadrant. If the there are fewer than three noisy pixels in the level2.evt file, extra rows are filled as -1
| Pixel properties | Quadrant properties | ||||||
|---|---|---|---|---|---|---|---|
| Quadrant | DetID | PixID | Counts | Sigma | Mean | Median | Sigma |
| A | 0 | 31 | 486118 | 3042.32 | 794 | 779 | 159.5 |
| A | 0 | 13 | 88090 | 547.3 | 794 | 779 | 159.5 |
| A | 7 | 16 | 28824 | 175.8 | 794 | 779 | 159.5 |
| B | 10 | 16 | 671674 | 4425.59 | 802 | 787 | 151.6 |
| B | 15 | 204 | 69945 | 456.21 | 802 | 787 | 151.6 |
| B | 4 | 48 | 46760 | 303.27 | 802 | 787 | 151.6 |
| C | 9 | 247 | 245171 | 1377.96 | 772 | 776 | 177.4 |
| C | 14 | 48 | 17110 | 92.09 | 772 | 776 | 177.4 |
| C | 13 | 61 | 6471 | 32.11 | 772 | 776 | 177.4 |
| D | 13 | 235 | 182247 | 990.08 | 762 | 739 | 183.3 |
| D | 2 | 136 | 96027 | 519.77 | 762 | 739 | 183.3 |
| D | 2 | 14 | 25572 | 135.46 | 762 | 739 | 183.3 |
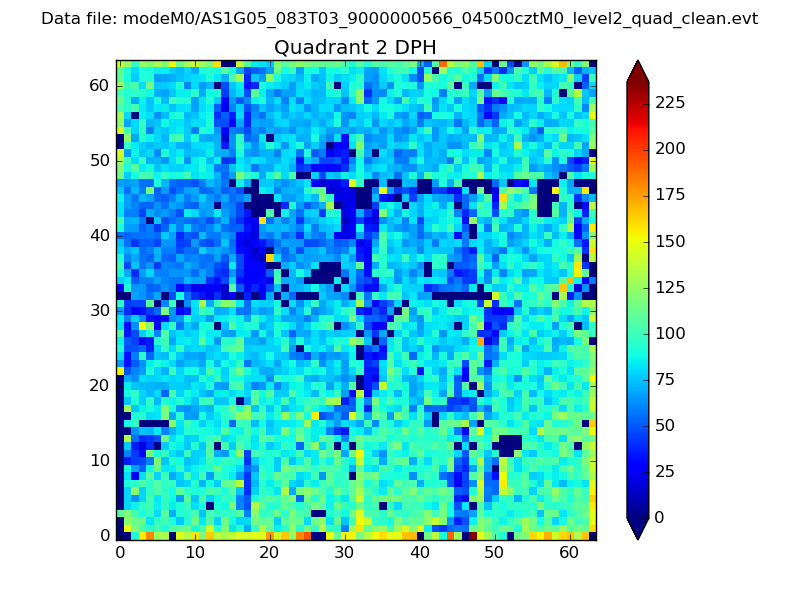
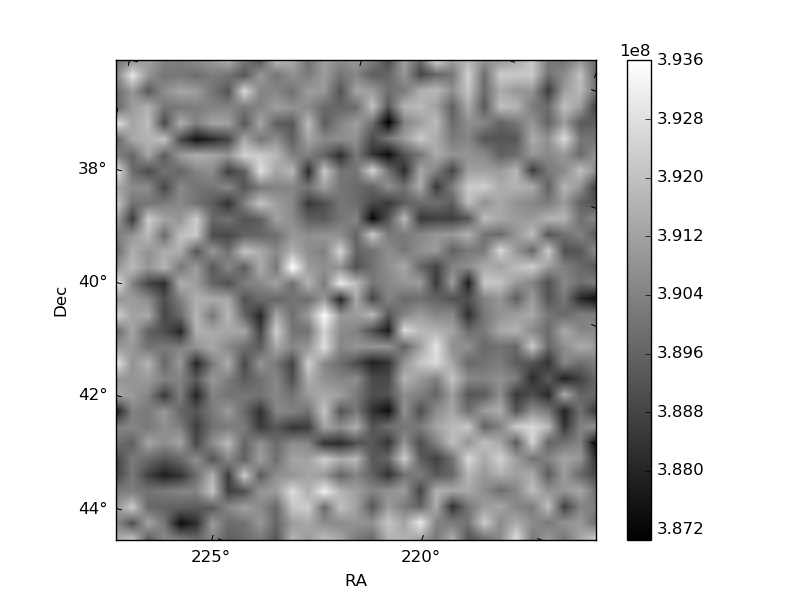
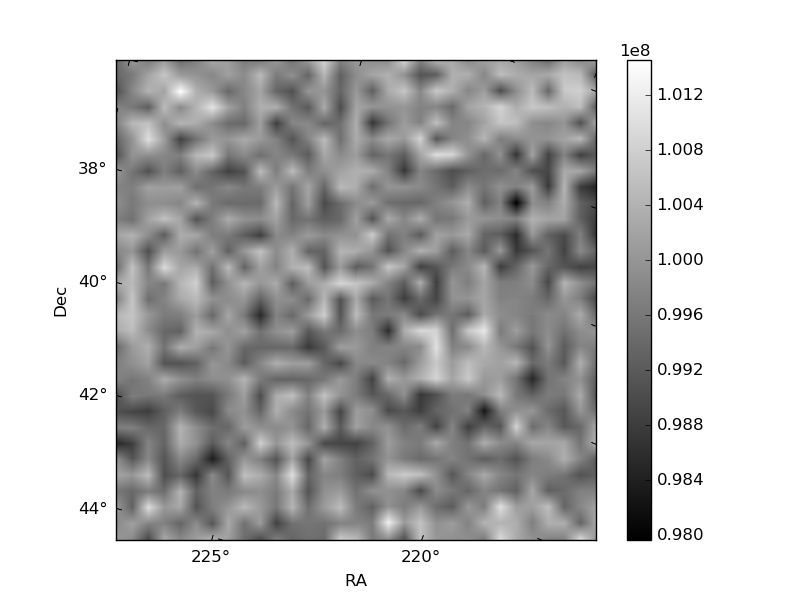
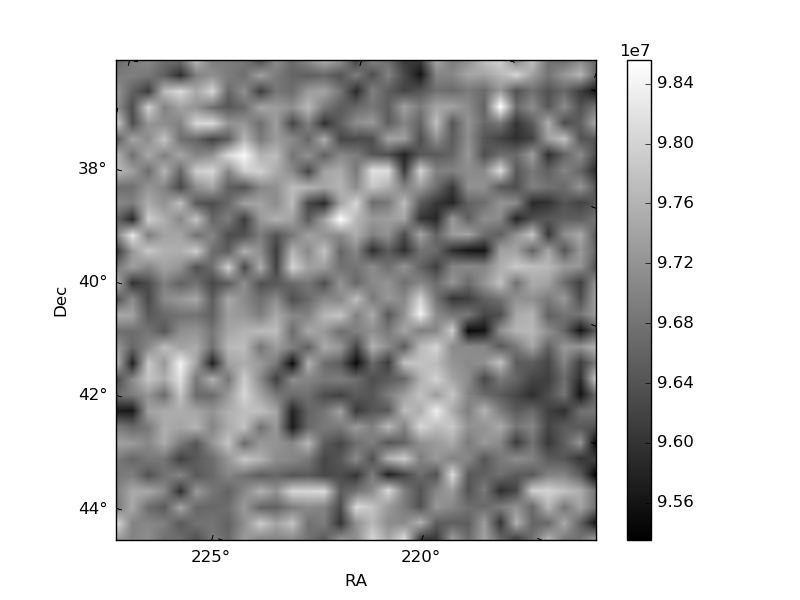
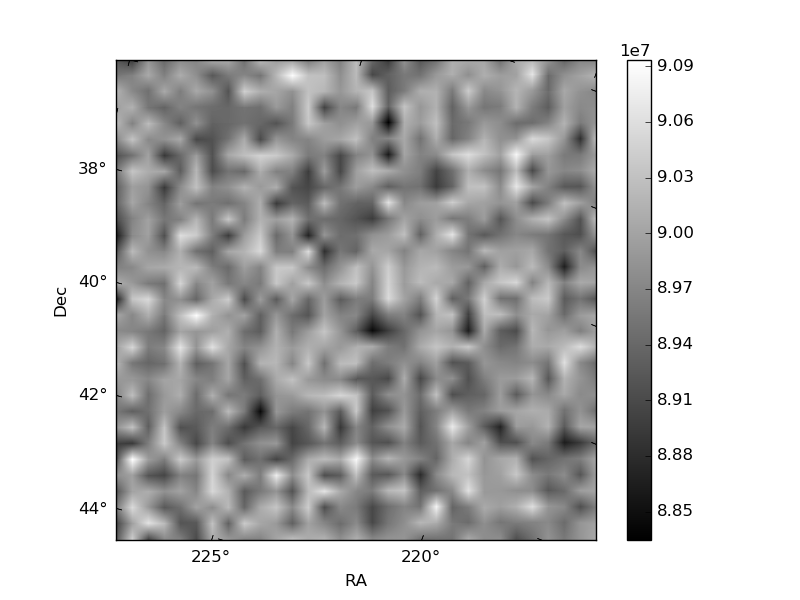
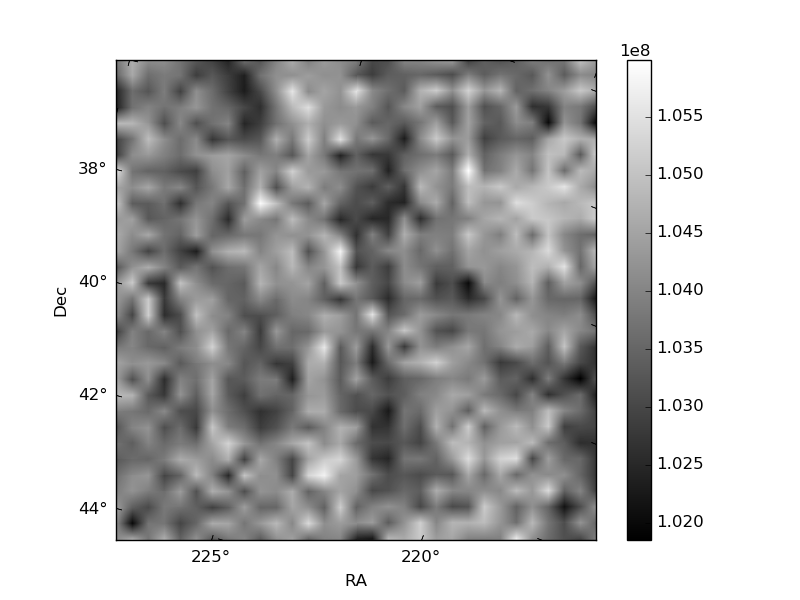
Histogram calculated using DETX and DETY for each event in the final _common_clean file
| Quadrant A | 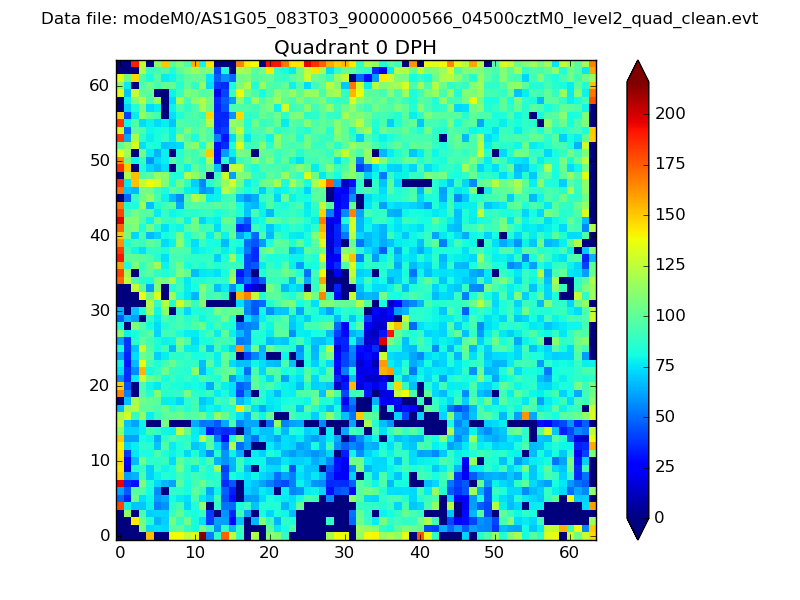 |
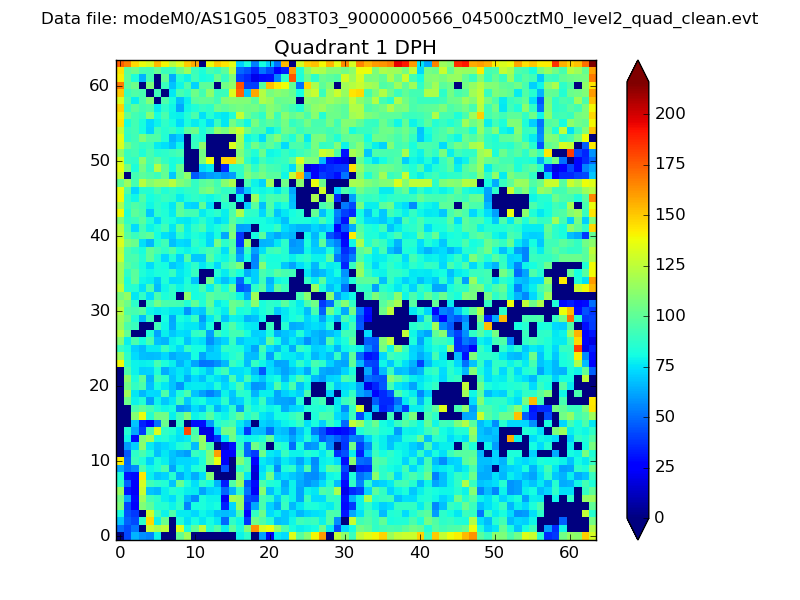 |
Quadrant B |
|---|---|---|---|
| Quadrant D | 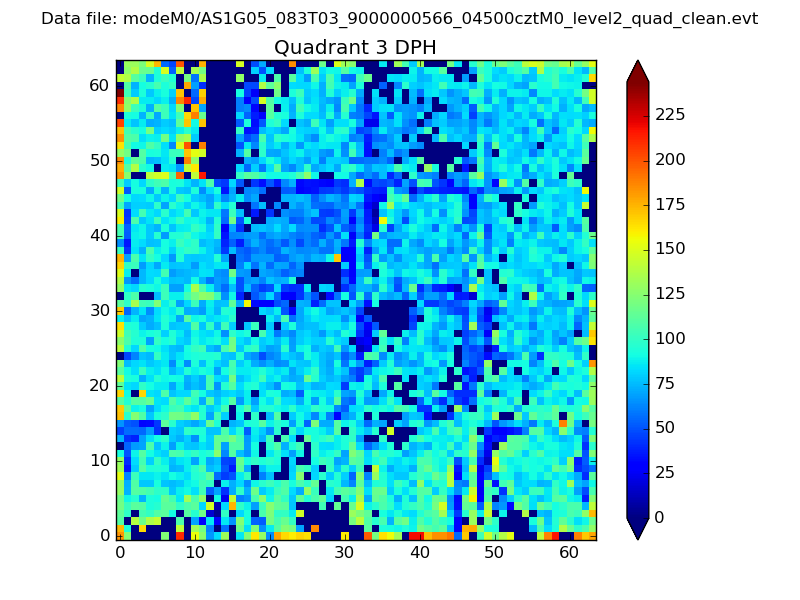 |
 |
Quadrant C |
| Plot type | Count rate plots | Images |
|---|---|---|
| Comparison with Poisson distribution Blue bars denote a histogram of data divided into 1 sec bins. Red curve is a Poisson curve with rate = median count rate of data. |
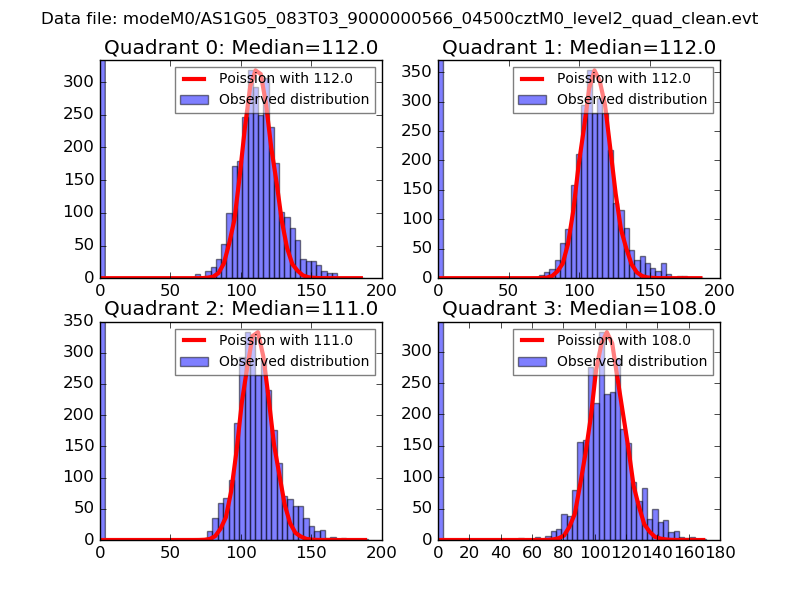 |
 |
| Quadrant-wise count rates Data is divided into 100 sec bins |
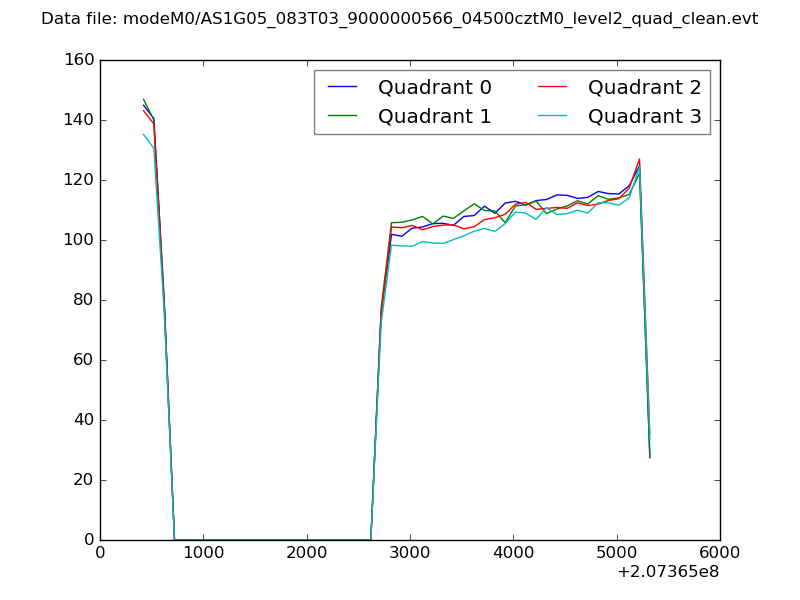 |
|
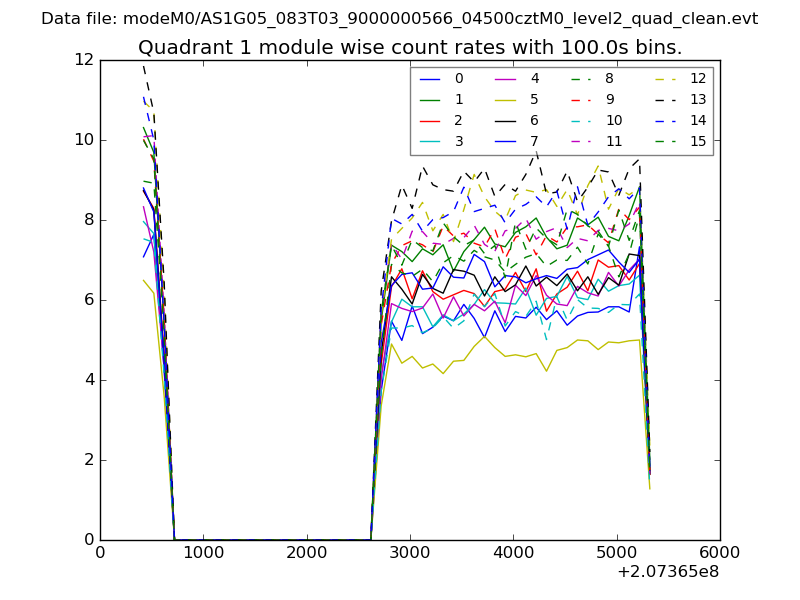
| Module-wise count rates for Quadrant A Data is divided into 100 sec bins |
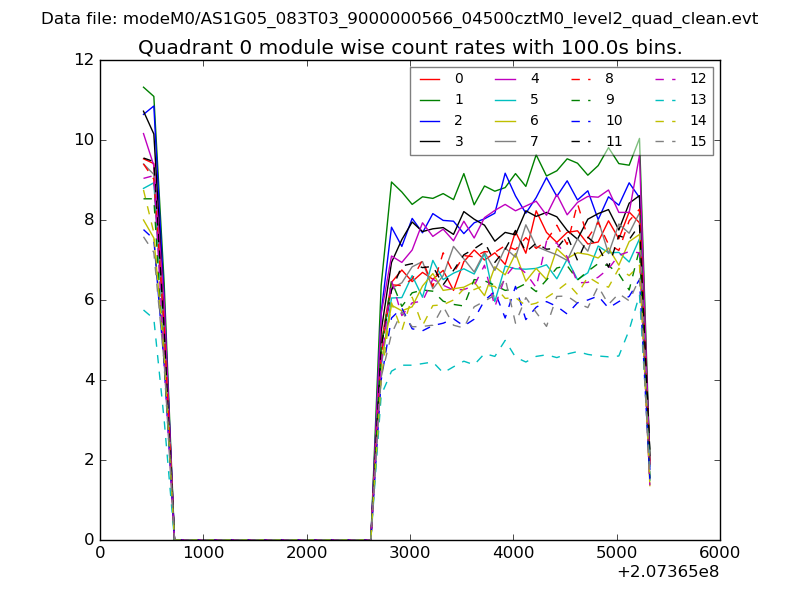 |
 |
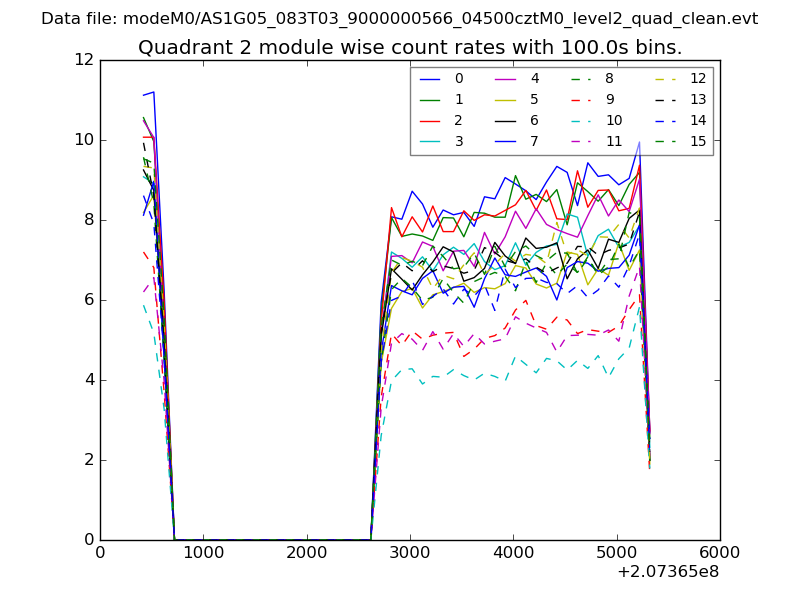
| Module-wise count rates for Quadrant B Data is divided into 100 sec bins |
 |
 |
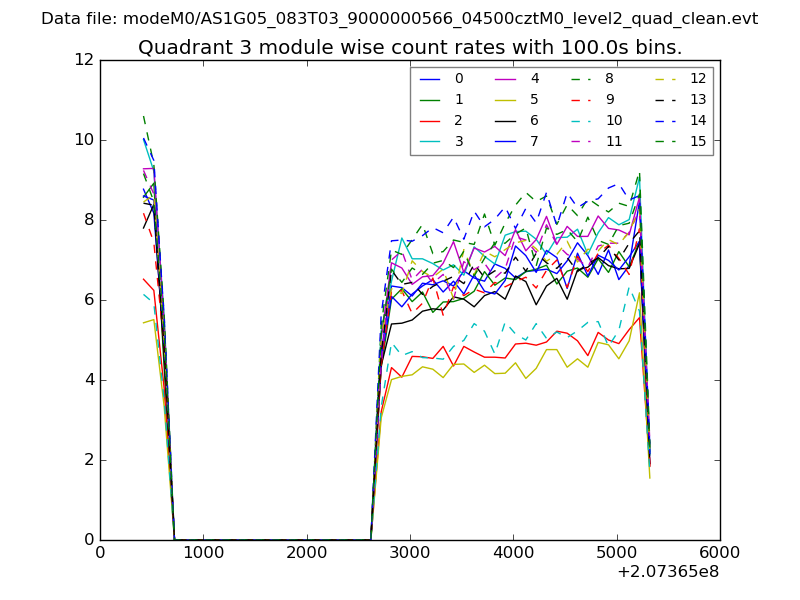
| Module-wise count rates for Quadrant C Data is divided into 100 sec bins |
 |
 |
| Module-wise count rates for Quadrant D Data is divided into 100 sec bins |
 |
 |
| Parameter | Plot |
|---|---|
| CZT HV Monitor | 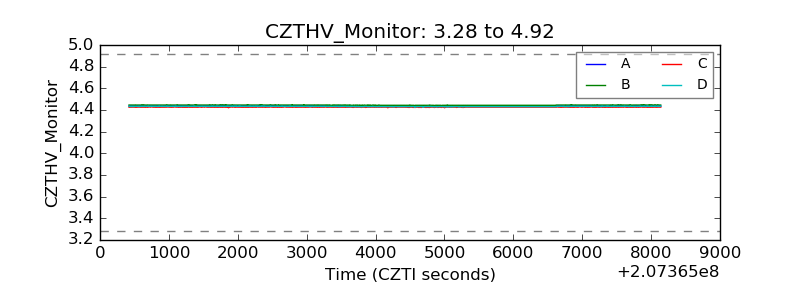 |
| D_VDD | 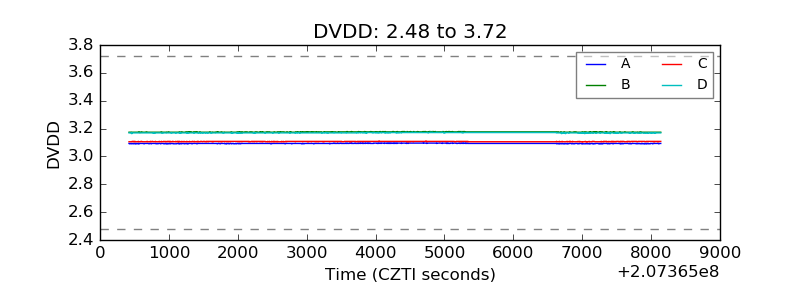 |
| Temperature 1 | 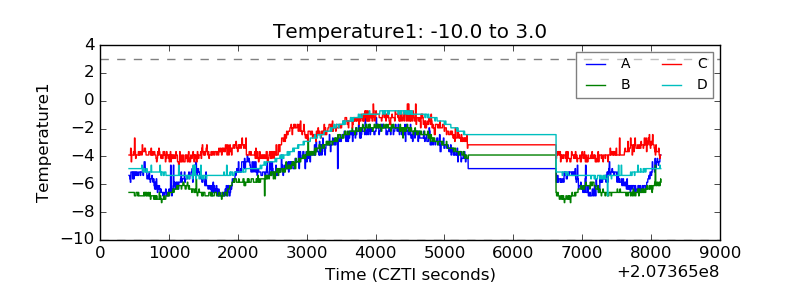 |
| Veto HV Monitor | 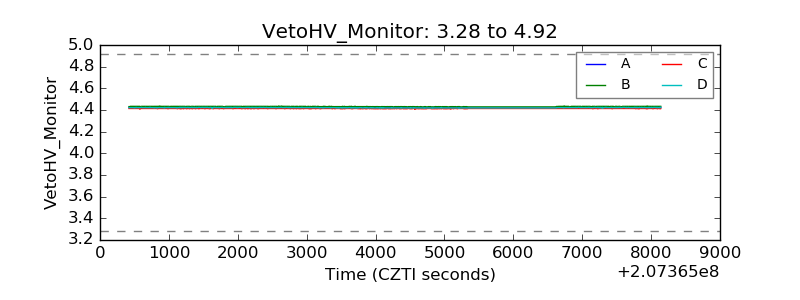 |
| Veto LLD | 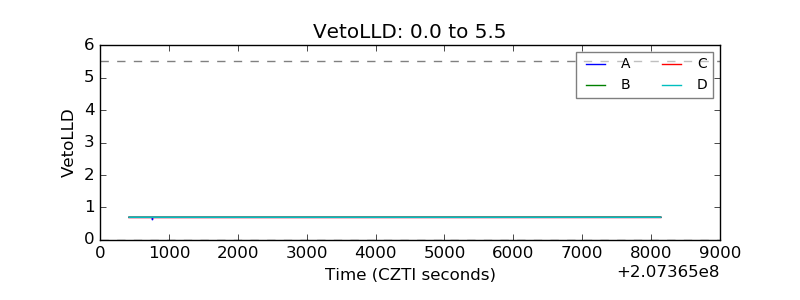 |
| Alpha Counter | 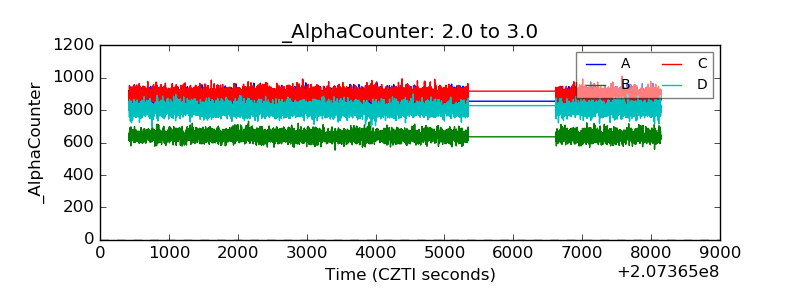 |
| _CPM_Rate | 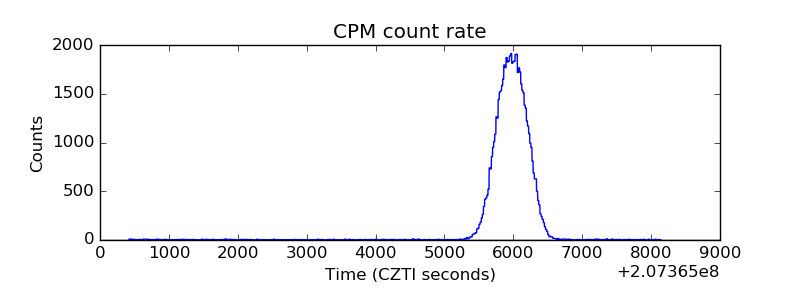 |
| CZT Counter | 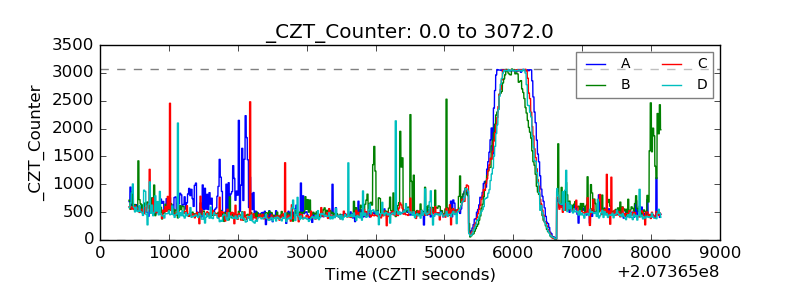 |
| +2.5 Volts monitor |  |
| +5 Volts monitor | 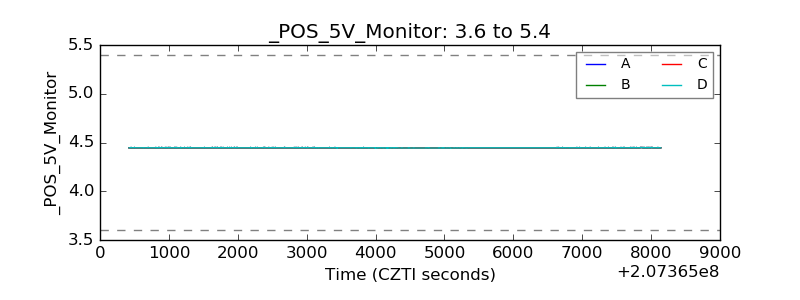 |
| _ROLL_ROT | 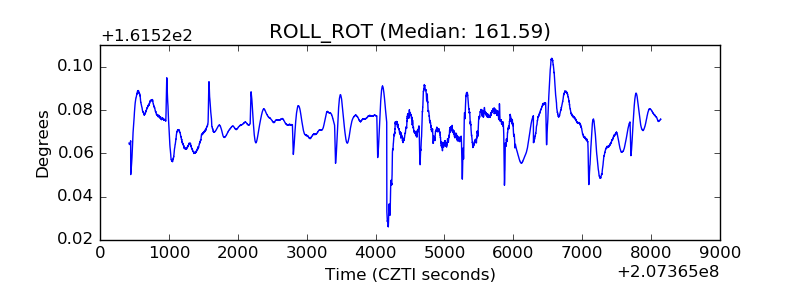 |
| _Roll_DEC | 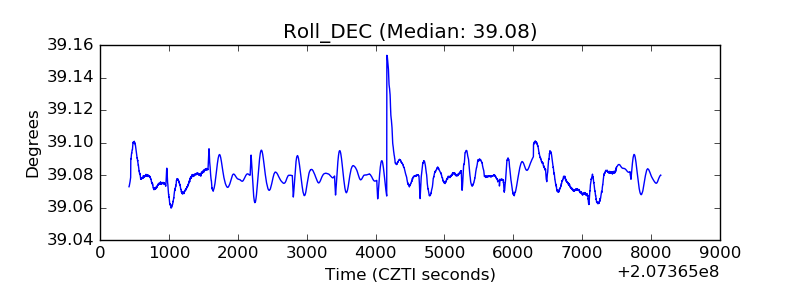 |
| _Roll_RA | 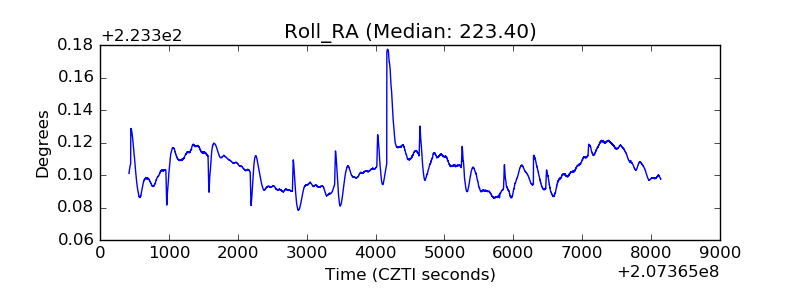 |
| Veto Counter | 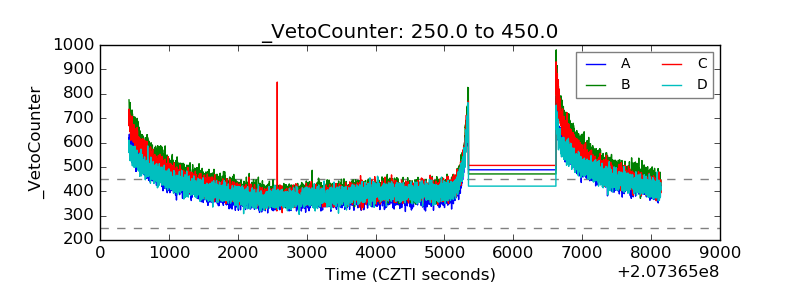 |