| Param | Original file | Final file |
|---|---|---|
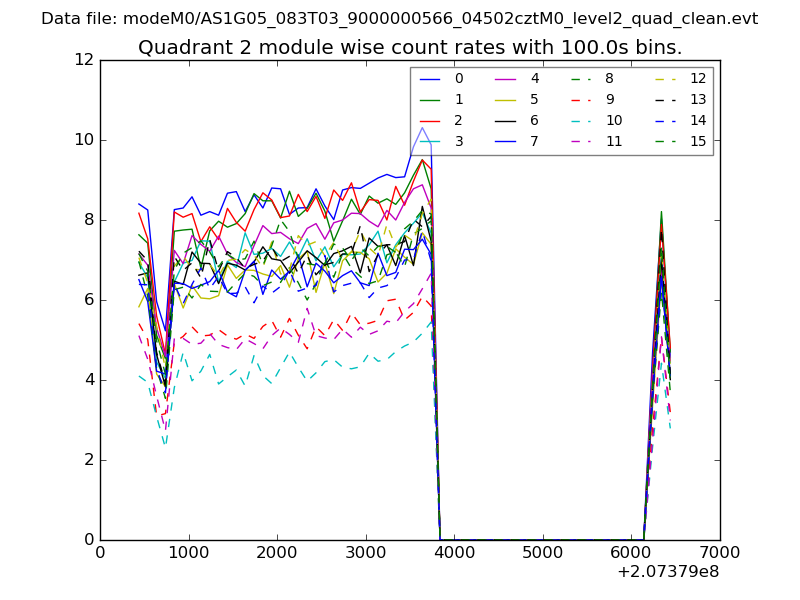
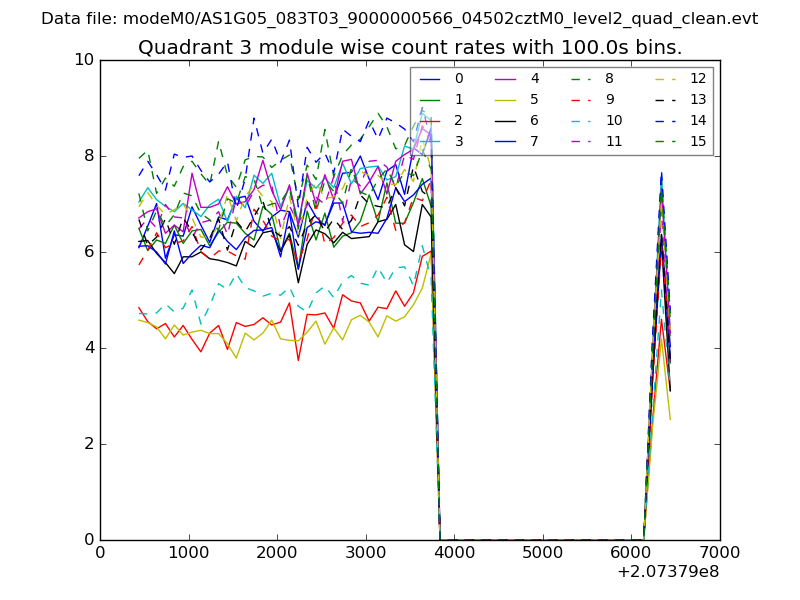
| Filename | modeM0/AS1G05_083T03_9000000566_04502cztM0_level2.evt | modeM0/AS1G05_083T03_9000000566_04502cztM0_level2_quad_clean.evt |
| Size (bytes) | 498,153,600 | 65,741,760 |
| Size | 475.1 MB | 62.7 MB |
| Events in quadrant A | 3,183,124 | 404,671 |
| Events in quadrant B | 4,410,575 | 391,058 |
| Events in quadrant C | 3,481,318 | 389,124 |
| Events in quadrant D | 3,599,808 | 381,864 |
| Mode SS | |||
|---|---|---|---|
| Quadrant | BADHDUFLAG | Total packets | Discarded packets |
| A | 0 | 124 | 0 |
| B | 0 | 124 | 0 |
| C | 0 | 124 | 0 |
| D | 0 | 124 | 0 |
| Mode M0 | |||
|---|---|---|---|
| Quadrant | BADHDUFLAG | Total packets | Discarded packets |
| A | 0 | 13283 | 2 |
| B | 0 | 17005 | 1 |
| C | 0 | 14392 | 1 |
| D | 0 | 14832 | 1 |
| Mode M9 | |||
|---|---|---|---|
| Quadrant | BADHDUFLAG | Total packets | Discarded packets |
| A | 0 | 12 | 0 |
| B | 0 | 12 | 0 |
| C | 0 | 12 | 0 |
| D | 0 | 12 | 0 |
| Quadrant | Total seconds | Saturated seconds | Saturation percentage |
|---|---|---|---|
| A | 6064 | 125 | 2.061346% |
| B | 6064 | 391 | 6.447889% |
| C | 6064 | 252 | 4.155673% |
| D | 6064 | 167 | 2.753958% |
Noise dominated data is calculated using 1-second bins in cleaned event files. If a bin has >2000 counts, and if more than 50% of those come from <1% of pixels, then it is considered to be noise-dominated and hence unusable.
| Quadrant | # 1 sec bins | Bins with >0 counts | Bins with >2000 counts | High rate bins dominated by noise | Noise dominated (total time) | Noise dominated (detector-on time) | Marked lightcurve |
|---|---|---|---|---|---|---|---|
| A | 7294 | 6065 | 7 | 7 | 0.10% | 0.12% |  |
| B | 7294 | 6065 | 218 | 218 | 2.99% | 3.59% |  |
| C | 7294 | 6065 | 179 | 179 | 2.45% | 2.95% | 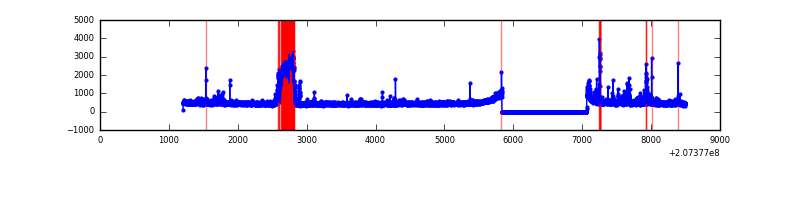 |
| D | 7294 | 6065 | 94 | 94 | 1.29% | 1.55% | 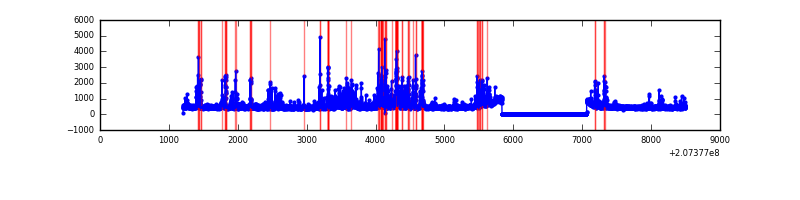 |
Top three noisy pixels from each quadrant. If the there are fewer than three noisy pixels in the level2.evt file, extra rows are filled as -1
| Pixel properties | Quadrant properties | ||||||
|---|---|---|---|---|---|---|---|
| Quadrant | DetID | PixID | Counts | Sigma | Mean | Median | Sigma |
| A | 0 | 13 | 215590 | 1396.41 | 750 | 734 | 153.9 |
| A | 0 | 118 | 42288 | 270.07 | 750 | 734 | 153.9 |
| A | 0 | 50 | 18326 | 114.34 | 750 | 734 | 153.9 |
| B | 10 | 16 | 1372877 | 9705.03 | 745 | 729 | 141.4 |
| B | 4 | 48 | 60573 | 423.27 | 745 | 729 | 141.4 |
| B | 15 | 204 | 41704 | 289.81 | 745 | 729 | 141.4 |
| C | 9 | 54 | 470599 | 2859.76 | 712 | 716 | 164.3 |
| C | 9 | 247 | 173259 | 1050.12 | 712 | 716 | 164.3 |
| C | 14 | 48 | 34425 | 205.16 | 712 | 716 | 164.3 |
| D | 14 | 34 | 569273 | 3035.3 | 710 | 697 | 187.3 |
| D | 13 | 235 | 192004 | 1021.28 | 710 | 697 | 187.3 |
| D | 5 | 239 | 48717 | 256.35 | 710 | 697 | 187.3 |
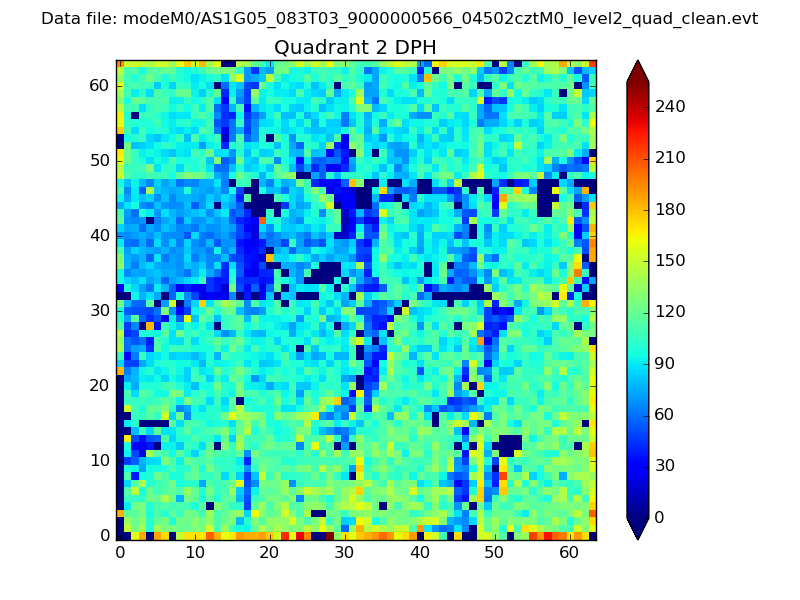
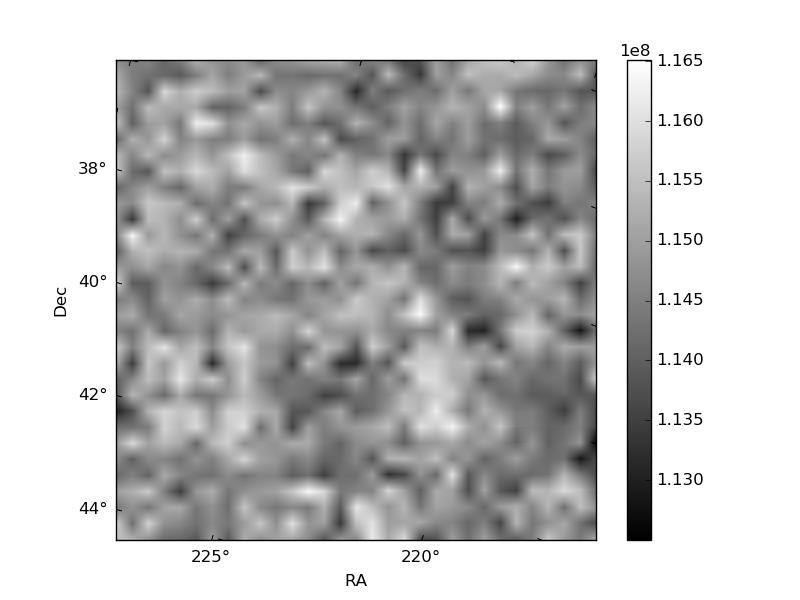
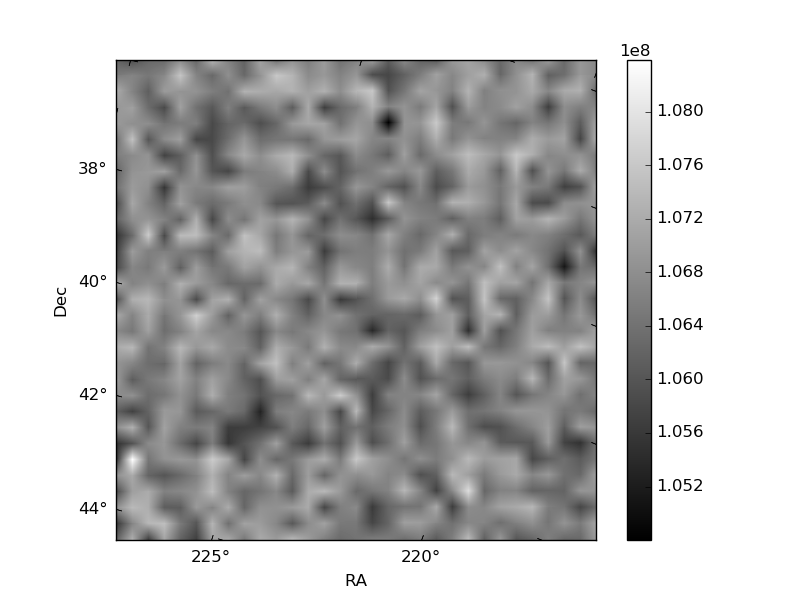
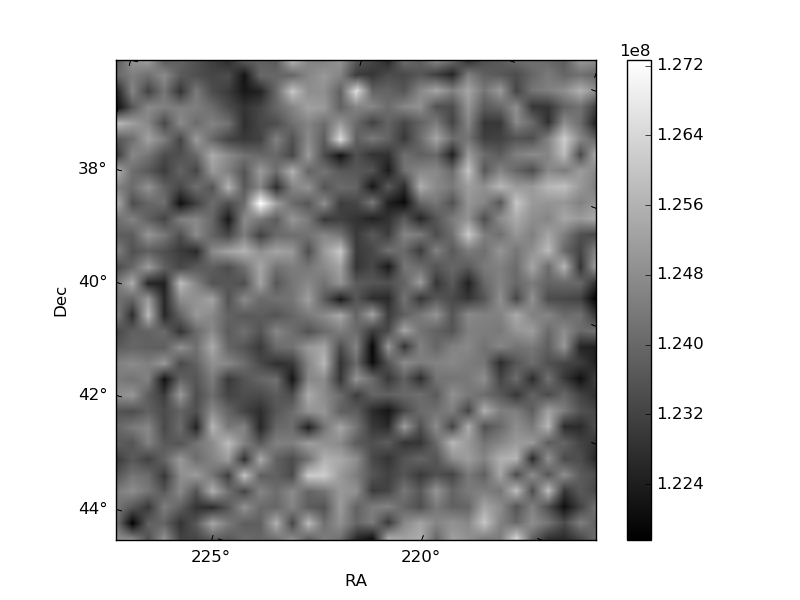
Histogram calculated using DETX and DETY for each event in the final _common_clean file
| Quadrant A | 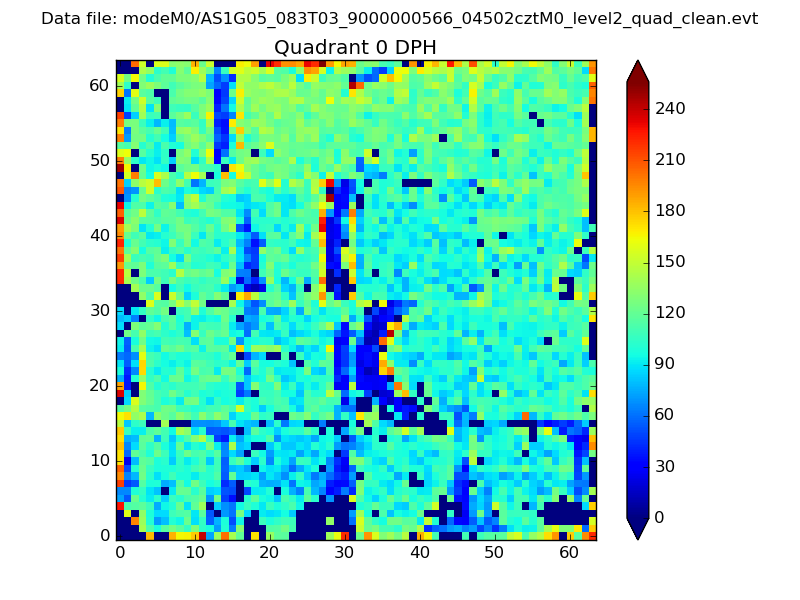 |
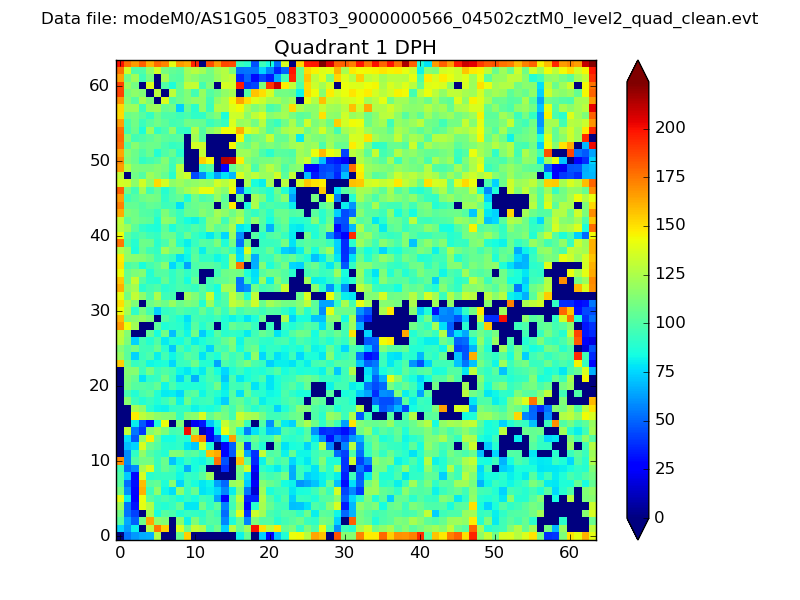 |
Quadrant B |
|---|---|---|---|
| Quadrant D | 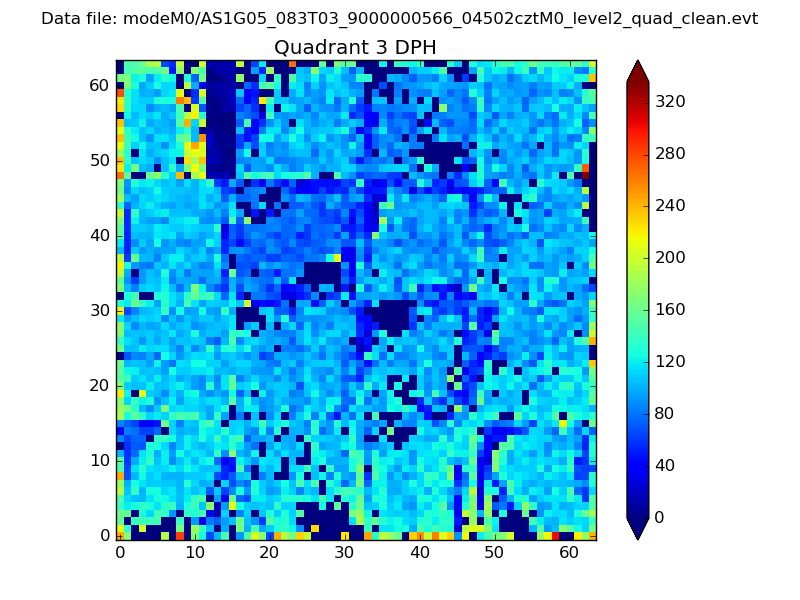 |
 |
Quadrant C |
| Plot type | Count rate plots | Images |
|---|---|---|
| Comparison with Poisson distribution Blue bars denote a histogram of data divided into 1 sec bins. Red curve is a Poisson curve with rate = median count rate of data. |
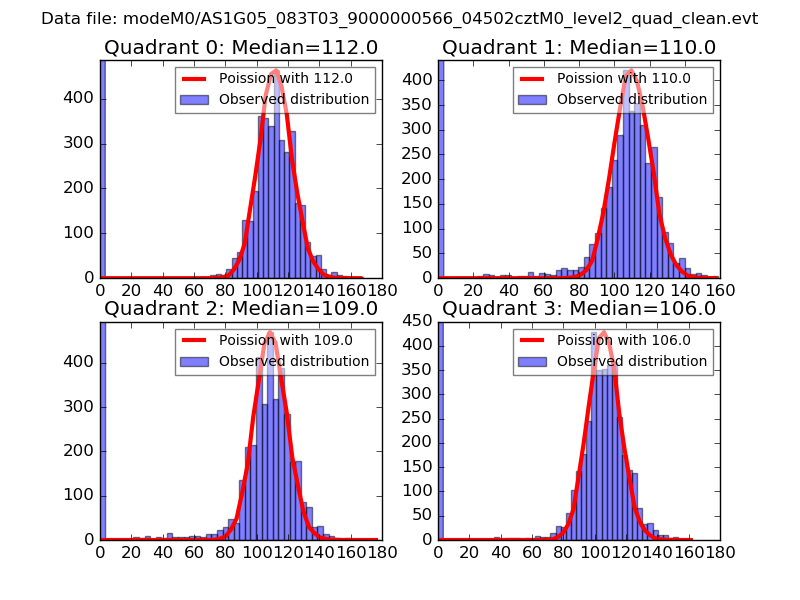 |
 |
| Quadrant-wise count rates Data is divided into 100 sec bins |
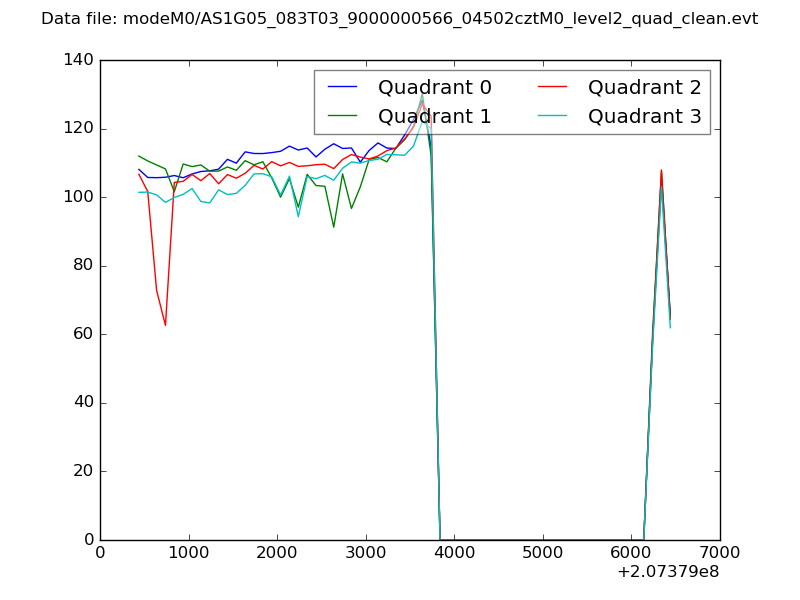 |
|
| Module-wise count rates for Quadrant A Data is divided into 100 sec bins |
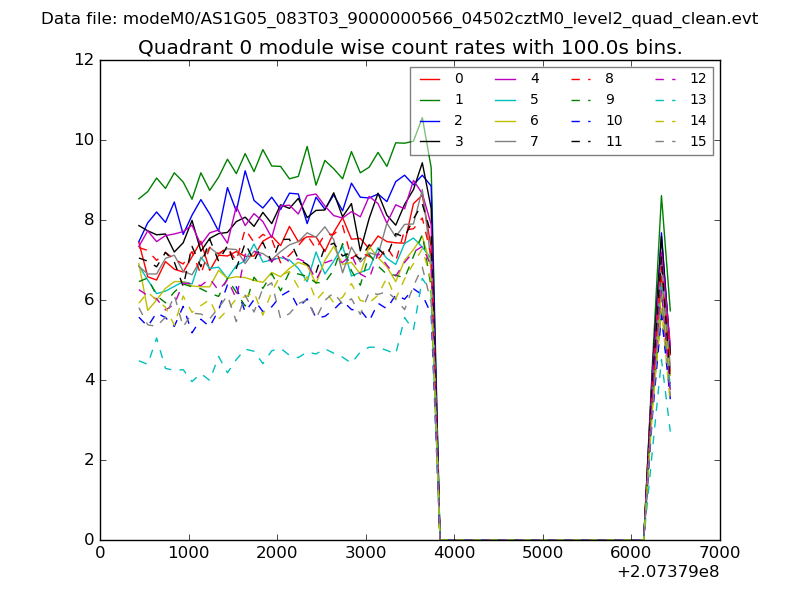 |
 |
| Module-wise count rates for Quadrant B Data is divided into 100 sec bins |
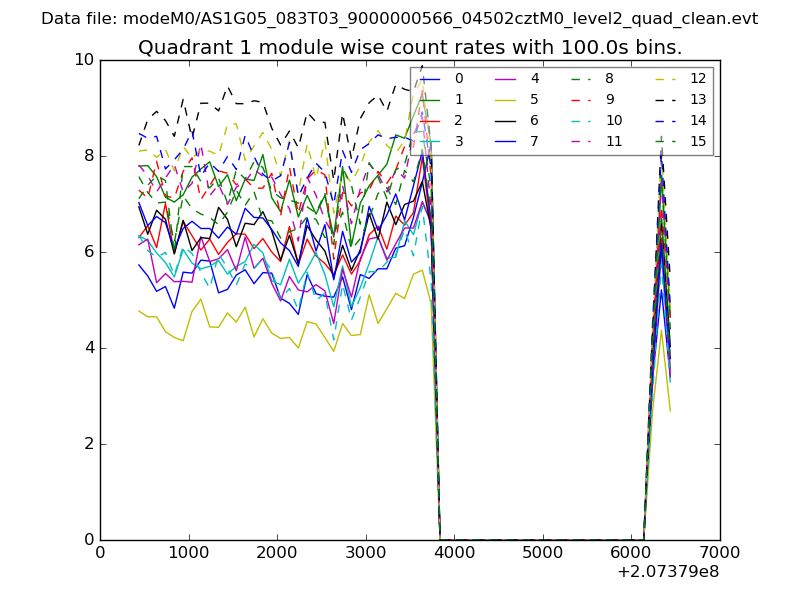 |
 |
| Module-wise count rates for Quadrant C Data is divided into 100 sec bins |
 |
 |
| Module-wise count rates for Quadrant D Data is divided into 100 sec bins |
 |
 |
| Parameter | Plot |
|---|---|
| CZT HV Monitor |  |
| D_VDD | 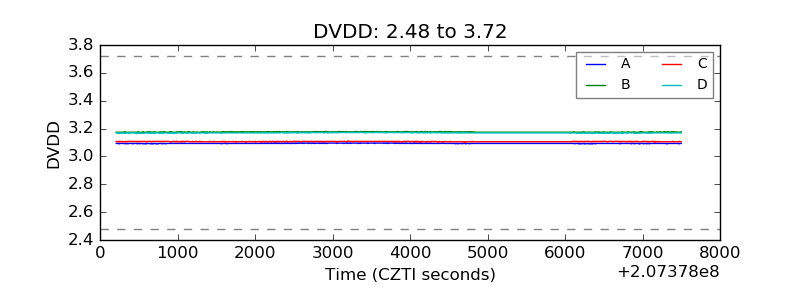 |
| Temperature 1 | 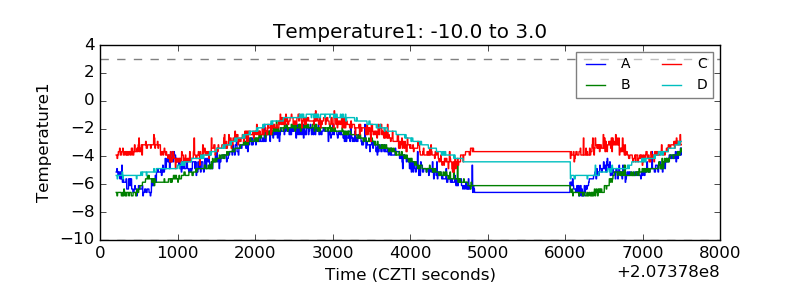 |
| Veto HV Monitor | 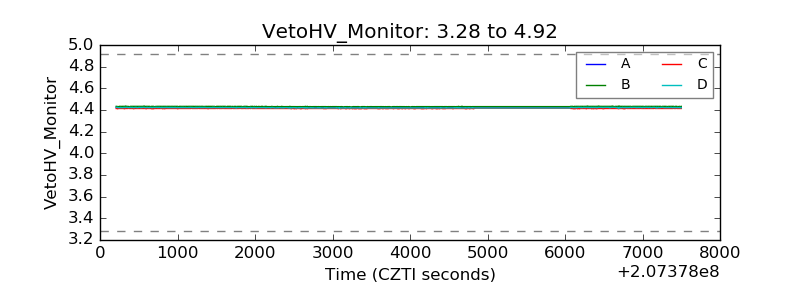 |
| Veto LLD | 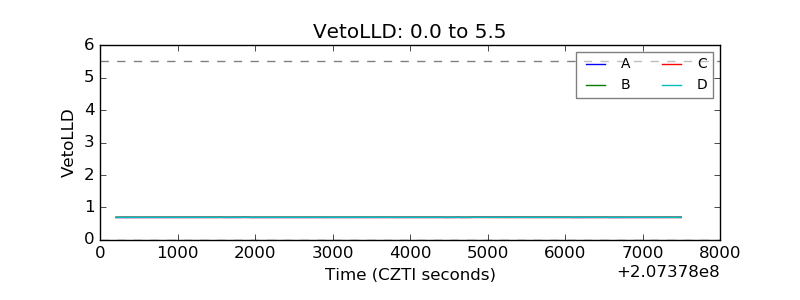 |
| Alpha Counter | 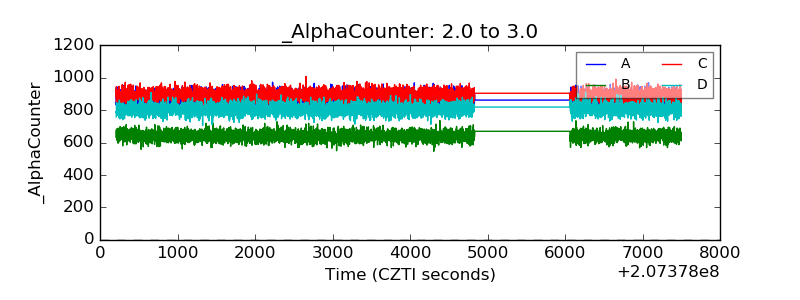 |
| _CPM_Rate | 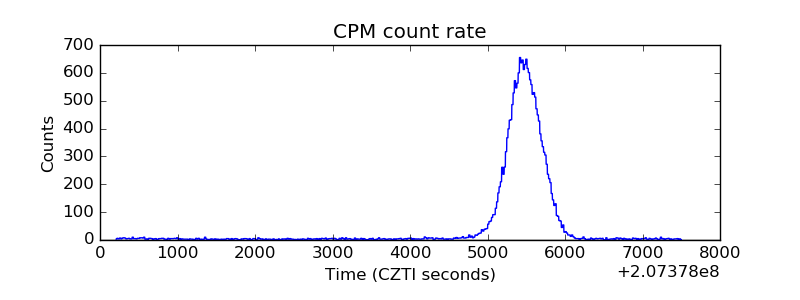 |
| CZT Counter | 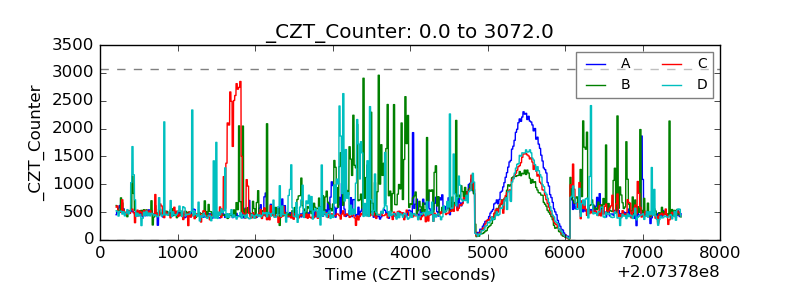 |
| +2.5 Volts monitor |  |
| +5 Volts monitor | 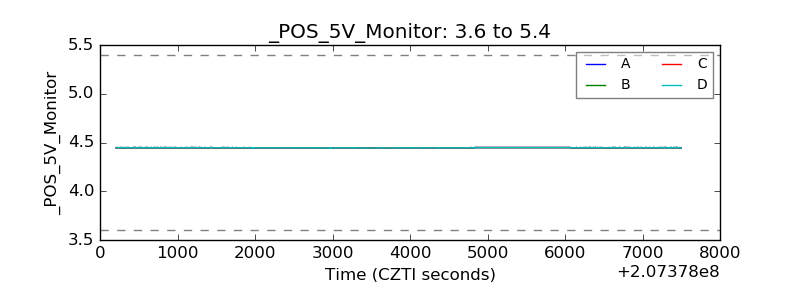 |
| _ROLL_ROT | 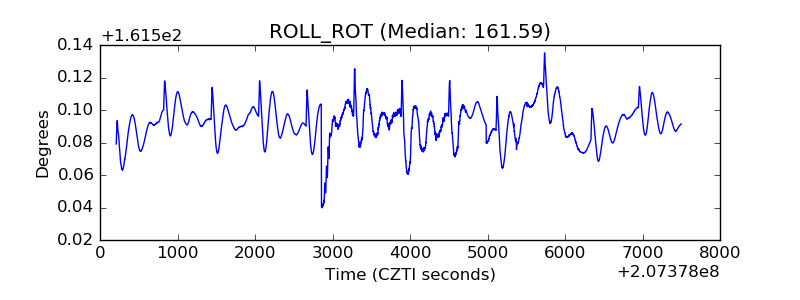 |
| _Roll_DEC | 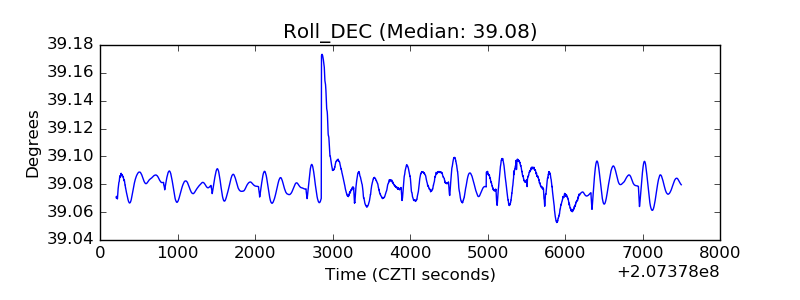 |
| _Roll_RA | 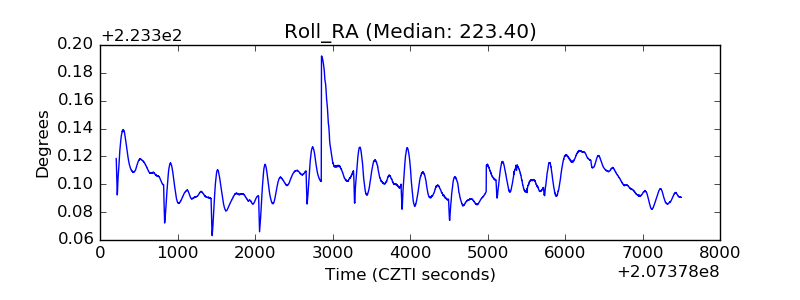 |
| Veto Counter | 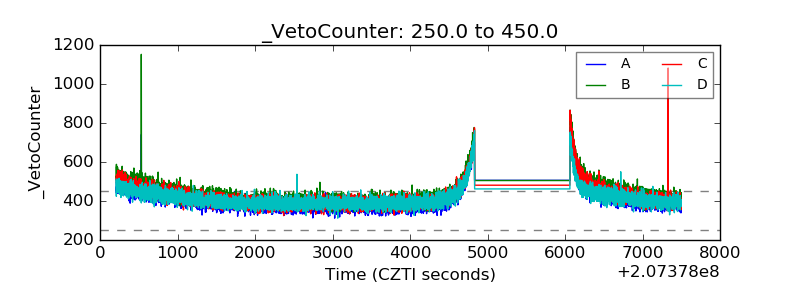 |