| Param | Original file | Final file |
|---|---|---|
| Filename | modeM0/AS1G05_083T03_9000000566_04503cztM0_level2.evt | modeM0/AS1G05_083T03_9000000566_04503cztM0_level2_quad_clean.evt |
| Size (bytes) | 564,036,480 | 75,911,040 |
| Size | 537.9 MB | 72.4 MB |
| Events in quadrant A | 3,957,376 | 462,624 |
| Events in quadrant B | 5,761,302 | 446,013 |
| Events in quadrant C | 3,360,494 | 468,803 |
| Events in quadrant D | 3,547,121 | 452,600 |
| Mode SS | |||
|---|---|---|---|
| Quadrant | BADHDUFLAG | Total packets | Discarded packets |
| A | 0 | 136 | 0 |
| B | 0 | 136 | 0 |
| C | 0 | 136 | 0 |
| D | 0 | 136 | 0 |
| Mode M0 | |||
|---|---|---|---|
| Quadrant | BADHDUFLAG | Total packets | Discarded packets |
| A | 0 | 16125 | 3 |
| B | 0 | 21630 | 2 |
| C | 0 | 14616 | 2 |
| D | 0 | 15233 | 2 |
| Mode M9 | |||
|---|---|---|---|
| Quadrant | BADHDUFLAG | Total packets | Discarded packets |
| A | 0 | 10 | 0 |
| B | 0 | 10 | 0 |
| C | 0 | 10 | 0 |
| D | 0 | 10 | 0 |
| Quadrant | Total seconds | Saturated seconds | Saturation percentage |
|---|---|---|---|
| A | 6717 | 419 | 6.237904% |
| B | 6717 | 784 | 11.671877% |
| C | 6717 | 185 | 2.754206% |
| D | 6718 | 204 | 3.036618% |
Noise dominated data is calculated using 1-second bins in cleaned event files. If a bin has >2000 counts, and if more than 50% of those come from <1% of pixels, then it is considered to be noise-dominated and hence unusable.
| Quadrant | # 1 sec bins | Bins with >0 counts | Bins with >2000 counts | High rate bins dominated by noise | Noise dominated (total time) | Noise dominated (detector-on time) | Marked lightcurve |
|---|---|---|---|---|---|---|---|
| A | 7692 | 6718 | 185 | 185 | 2.41% | 2.75% | 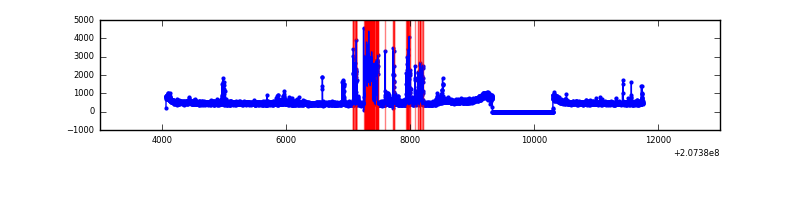 |
| B | 7692 | 6718 | 378 | 378 | 4.91% | 5.63% | 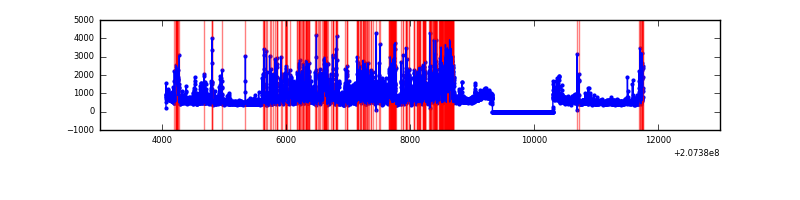 |
| C | 7692 | 6718 | 14 | 14 | 0.18% | 0.21% | 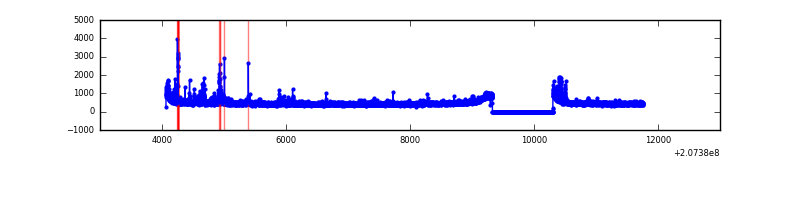 |
| D | 7693 | 6719 | 30 | 30 | 0.39% | 0.45% | 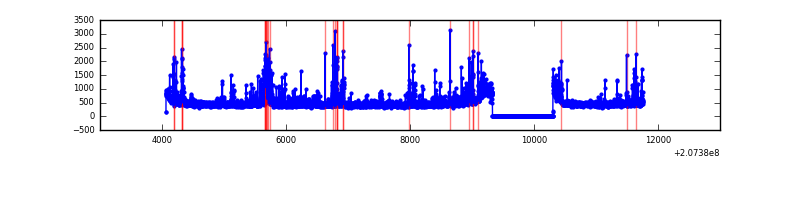 |
Top three noisy pixels from each quadrant. If the there are fewer than three noisy pixels in the level2.evt file, extra rows are filled as -1
| Pixel properties | Quadrant properties | ||||||
|---|---|---|---|---|---|---|---|
| Quadrant | DetID | PixID | Counts | Sigma | Mean | Median | Sigma |
| A | 0 | 118 | 597902 | 3569.03 | 810 | 793 | 167.3 |
| A | 0 | 13 | 94707 | 561.34 | 810 | 793 | 167.3 |
| A | 0 | 47 | 67932 | 401.3 | 810 | 793 | 167.3 |
| B | 10 | 16 | 2346808 | 15186.03 | 800 | 781 | 154.5 |
| B | 15 | 204 | 237908 | 1534.94 | 800 | 781 | 154.5 |
| B | 4 | 48 | 34296 | 216.95 | 800 | 781 | 154.5 |
| C | 9 | 247 | 219921 | 1202.0 | 791 | 795 | 182.3 |
| C | 12 | 4 | 15270 | 79.4 | 791 | 795 | 182.3 |
| C | 14 | 48 | 15162 | 78.81 | 791 | 795 | 182.3 |
| D | 13 | 235 | 142514 | 744.07 | 793 | 770 | 190.5 |
| D | 9 | 101 | 137569 | 718.11 | 793 | 770 | 190.5 |
| D | 14 | 34 | 135219 | 705.78 | 793 | 770 | 190.5 |
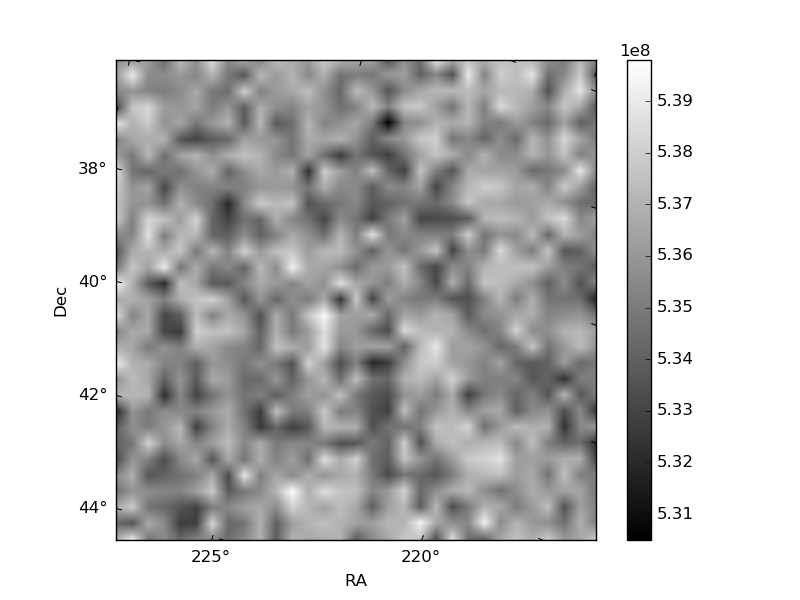
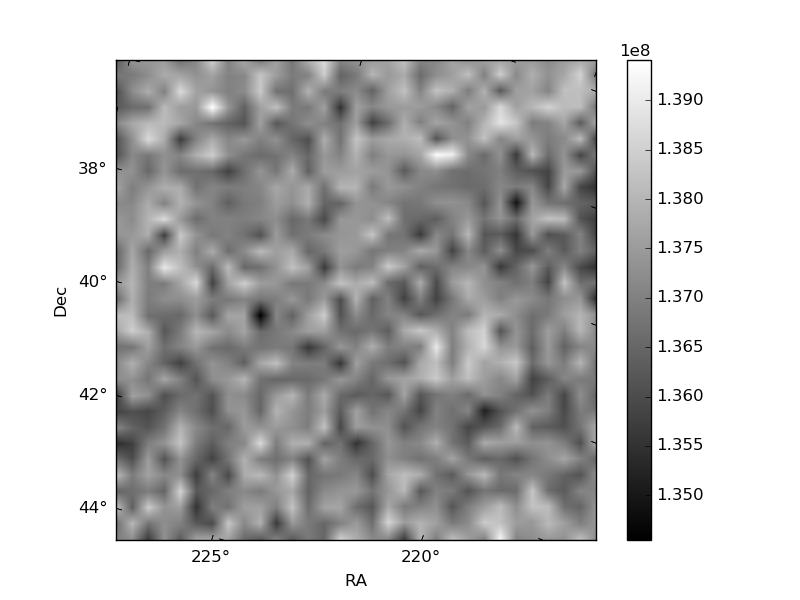
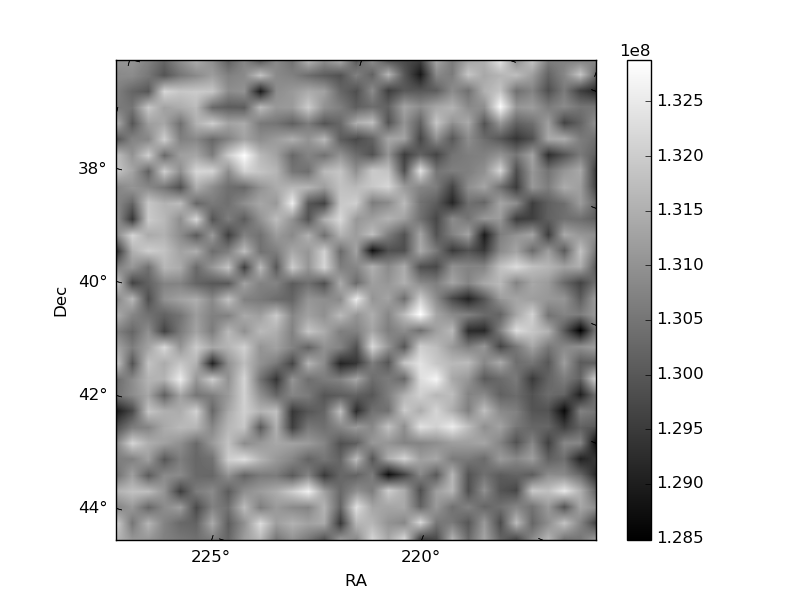
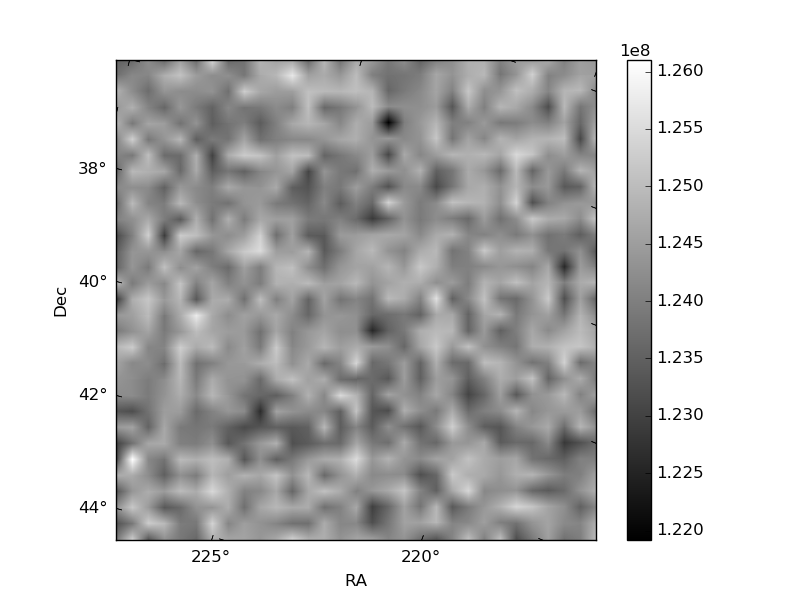
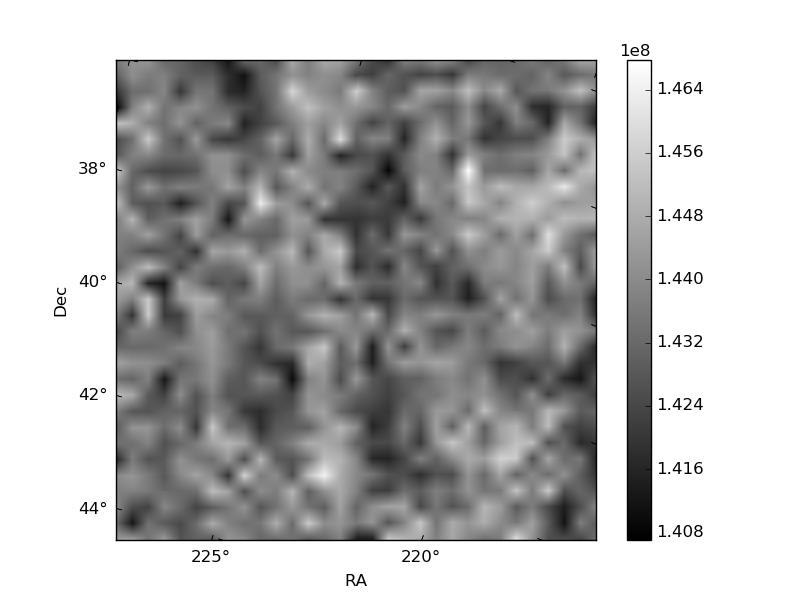
Histogram calculated using DETX and DETY for each event in the final _common_clean file
| Quadrant A | 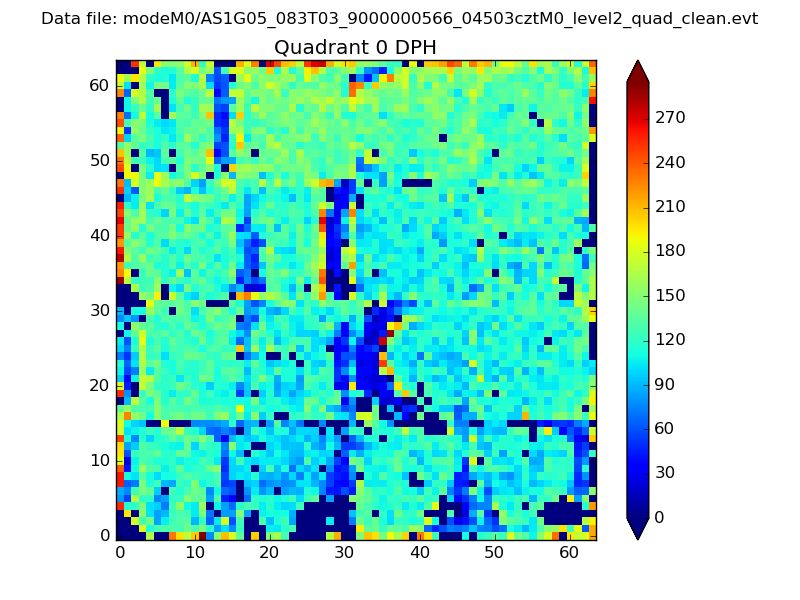 |
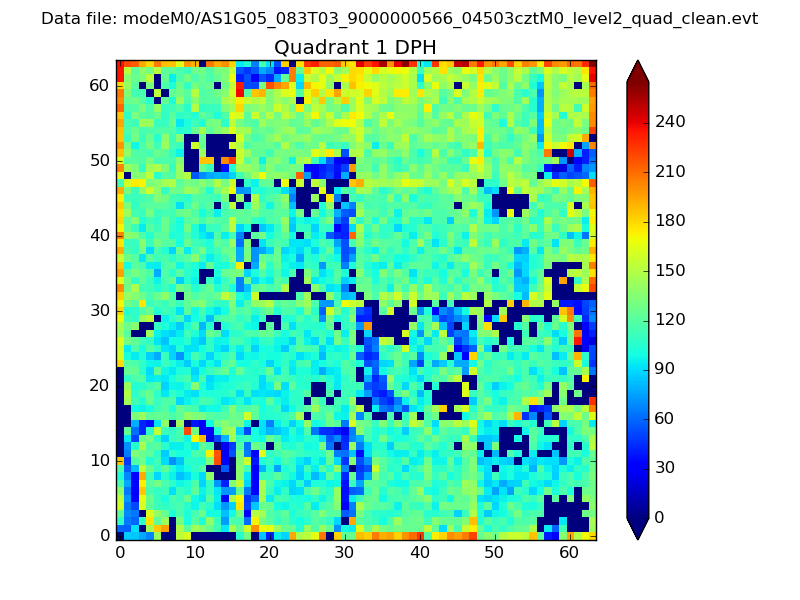 |
Quadrant B |
|---|---|---|---|
| Quadrant D | 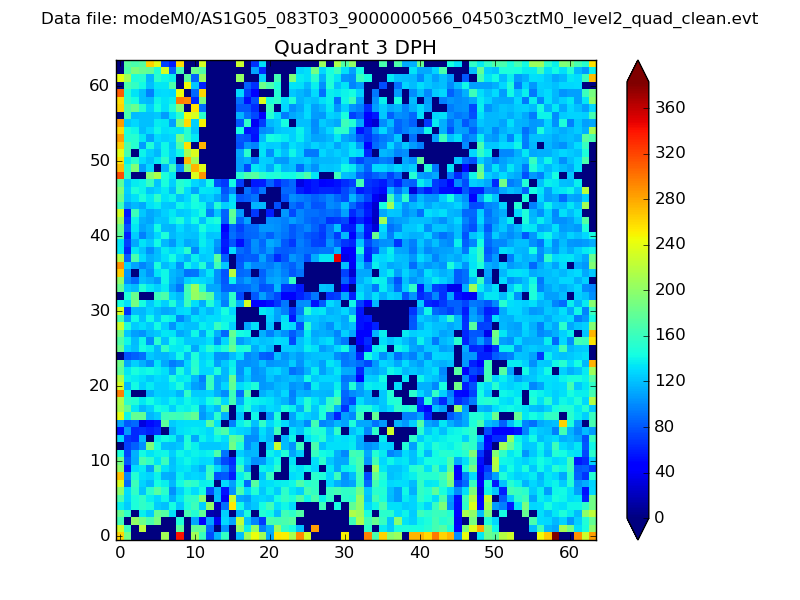 |
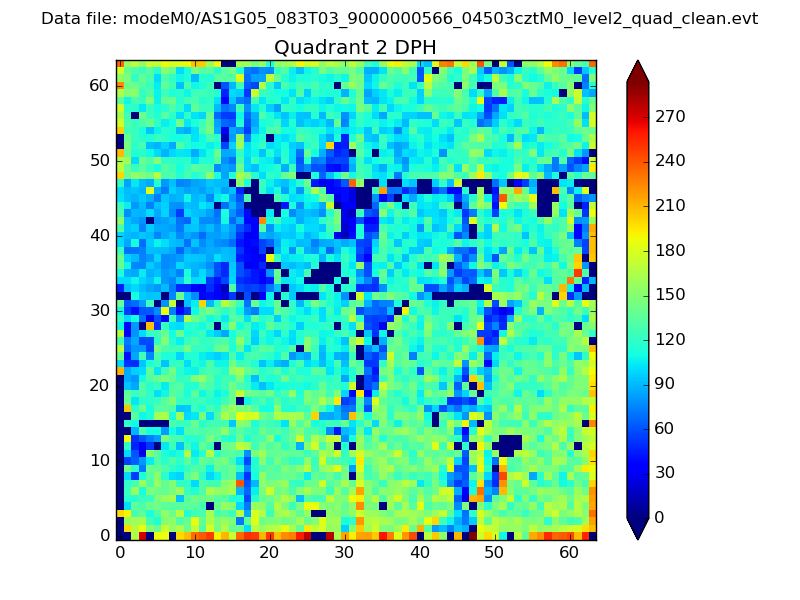 |
Quadrant C |
| Plot type | Count rate plots | Images |
|---|---|---|
| Comparison with Poisson distribution Blue bars denote a histogram of data divided into 1 sec bins. Red curve is a Poisson curve with rate = median count rate of data. |
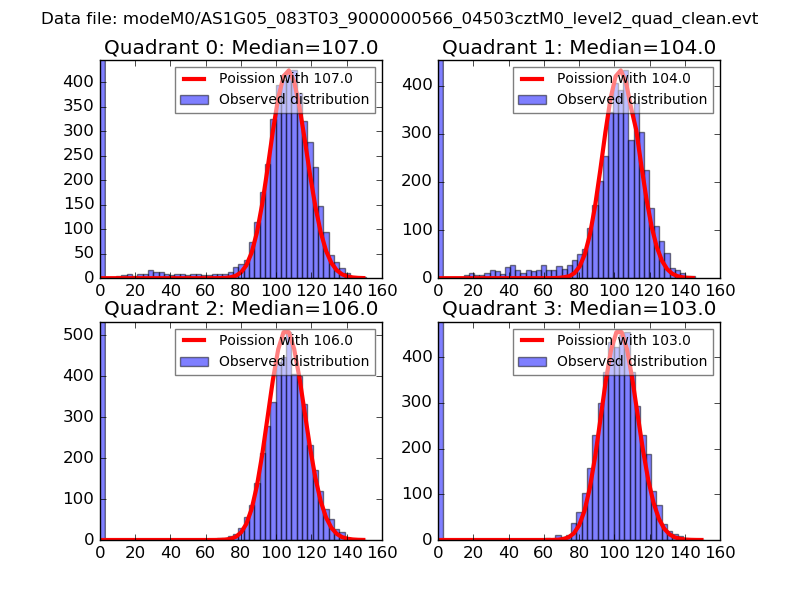 |
 |
| Quadrant-wise count rates Data is divided into 100 sec bins |
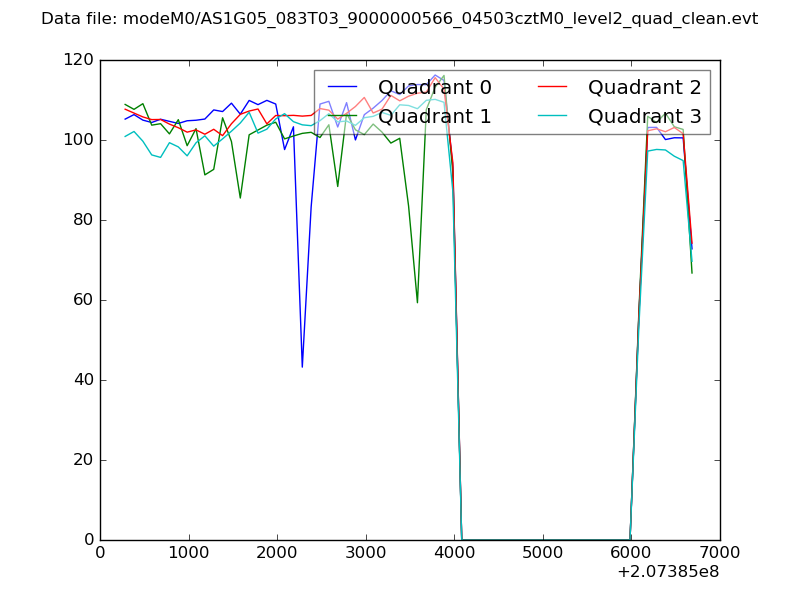 |
|
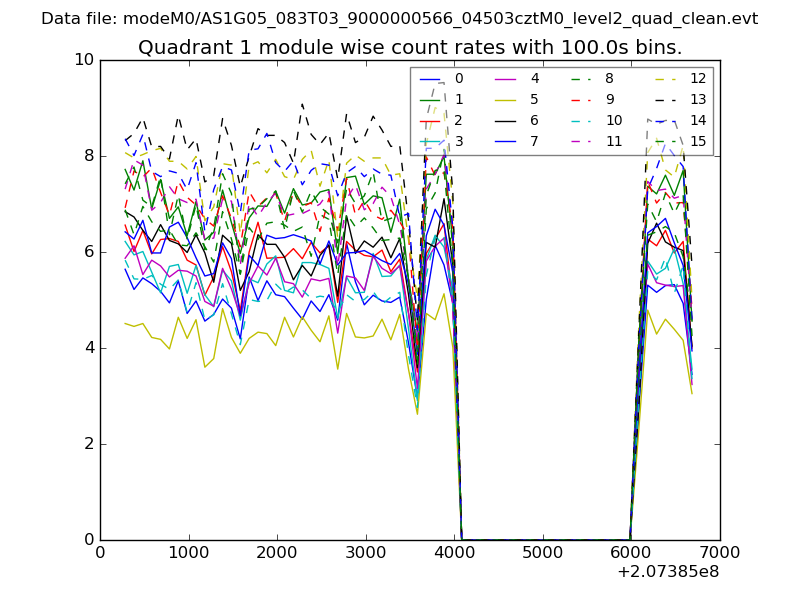
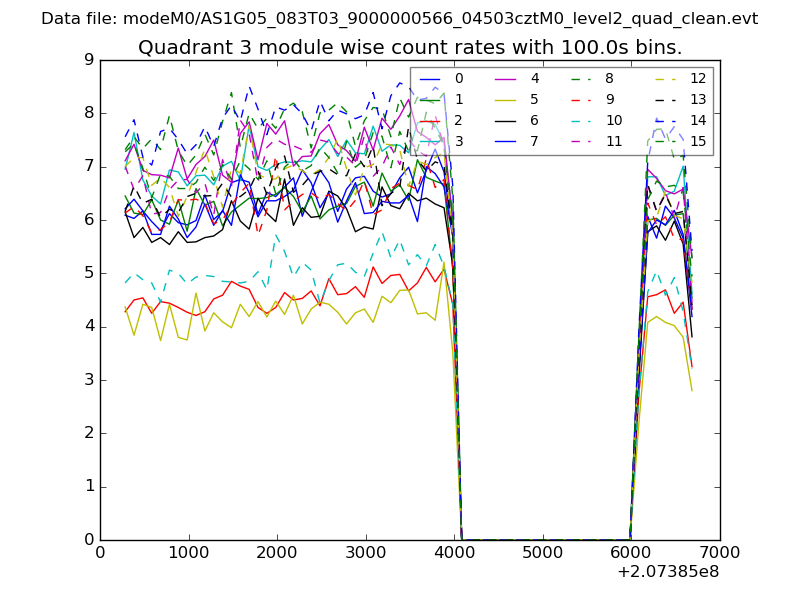
| Module-wise count rates for Quadrant A Data is divided into 100 sec bins |
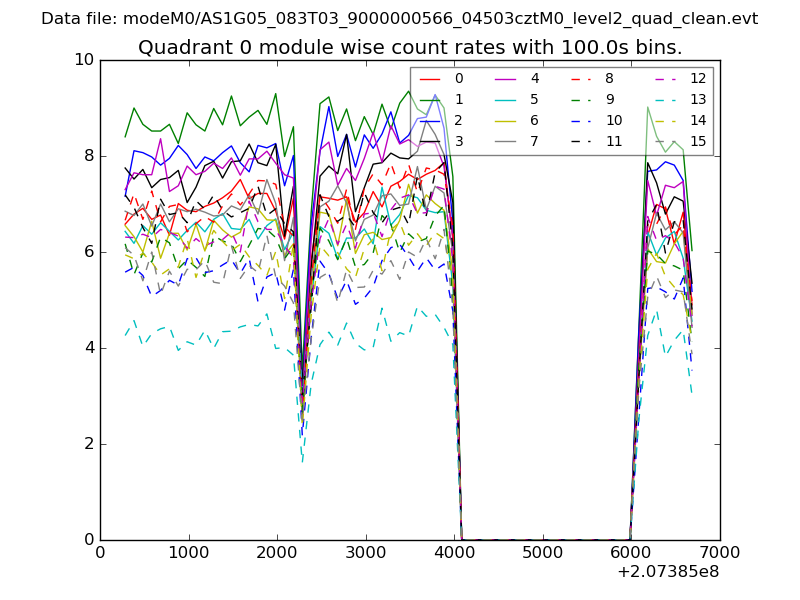 |
 |
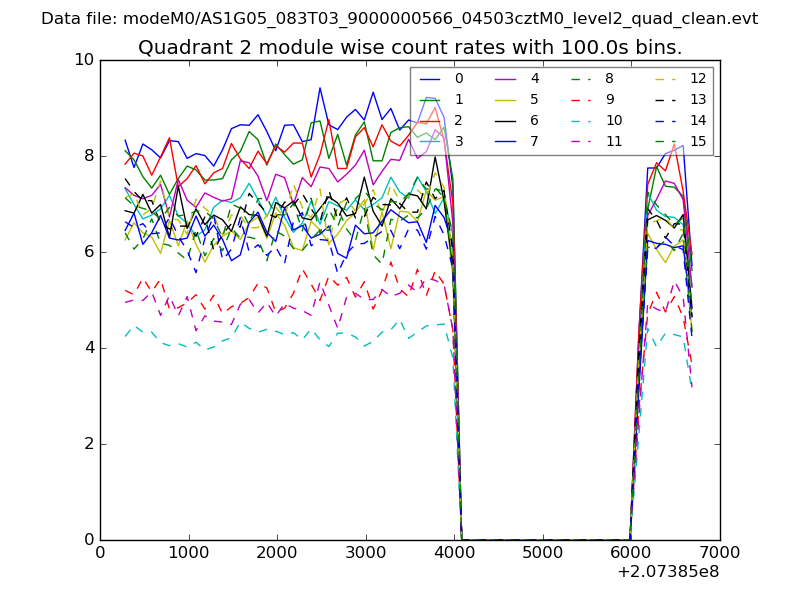
| Module-wise count rates for Quadrant B Data is divided into 100 sec bins |
 |
 |
| Module-wise count rates for Quadrant C Data is divided into 100 sec bins |
 |
 |
| Module-wise count rates for Quadrant D Data is divided into 100 sec bins |
 |
 |
| Parameter | Plot |
|---|---|
| CZT HV Monitor | 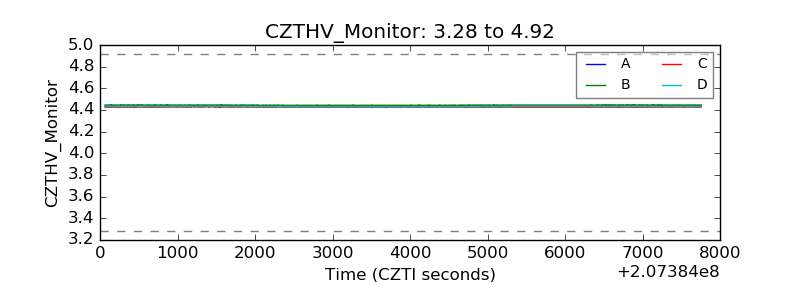 |
| D_VDD | 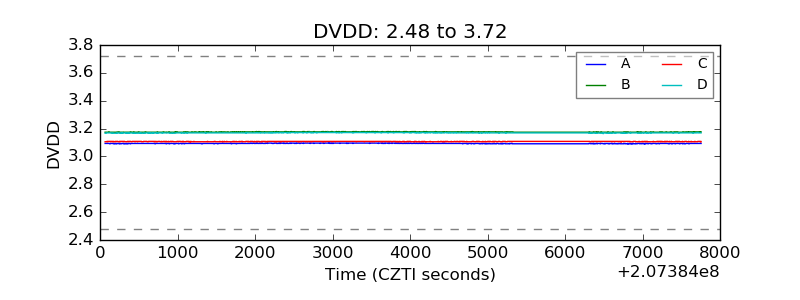 |
| Temperature 1 | 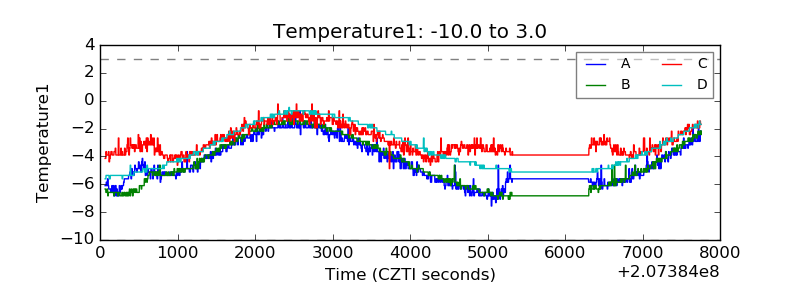 |
| Veto HV Monitor | 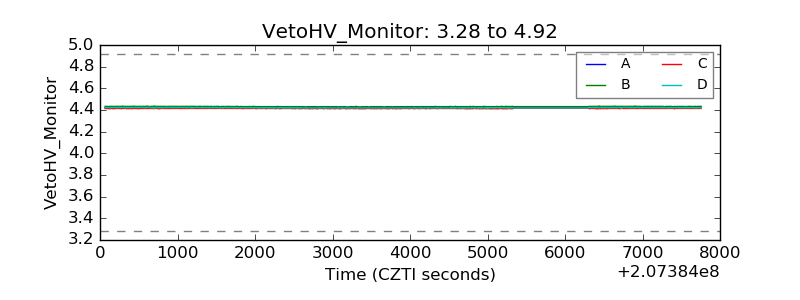 |
| Veto LLD | 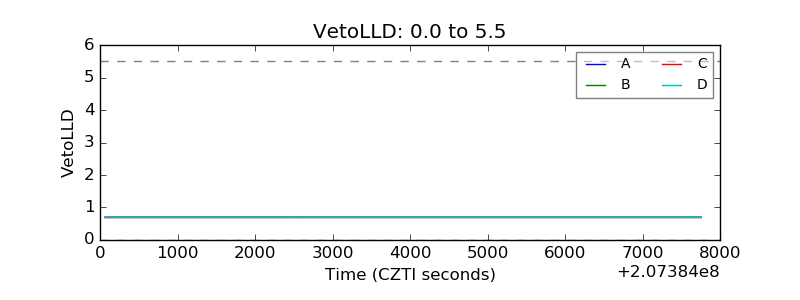 |
| Alpha Counter | 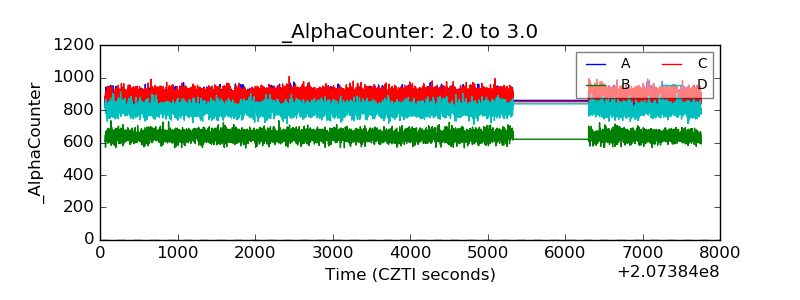 |
| _CPM_Rate | 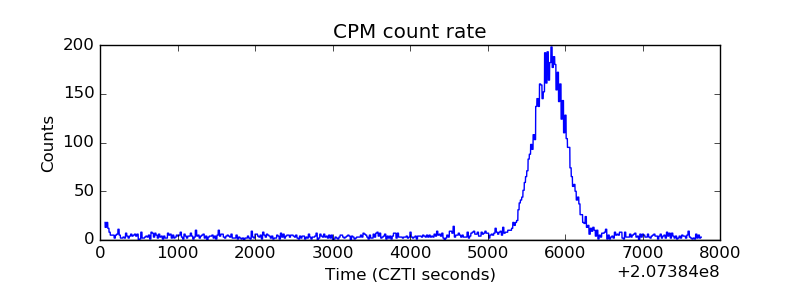 |
| CZT Counter | 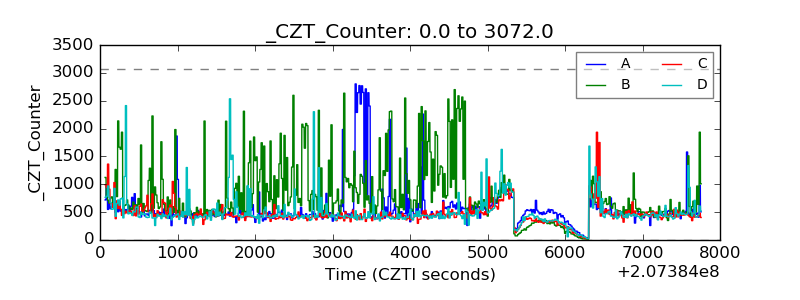 |
| +2.5 Volts monitor |  |
| +5 Volts monitor |  |
| _ROLL_ROT | 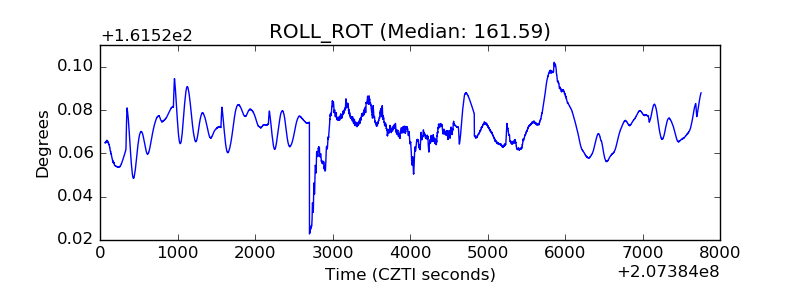 |
| _Roll_DEC | 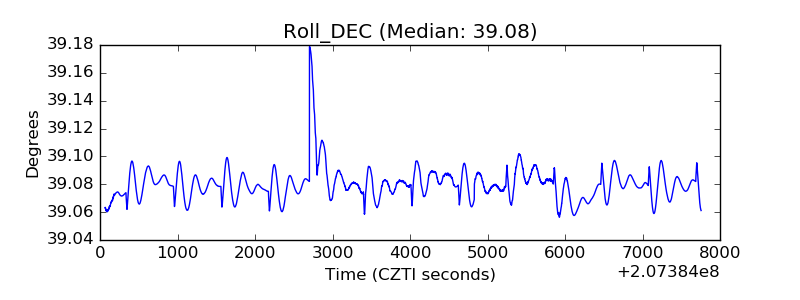 |
| _Roll_RA | 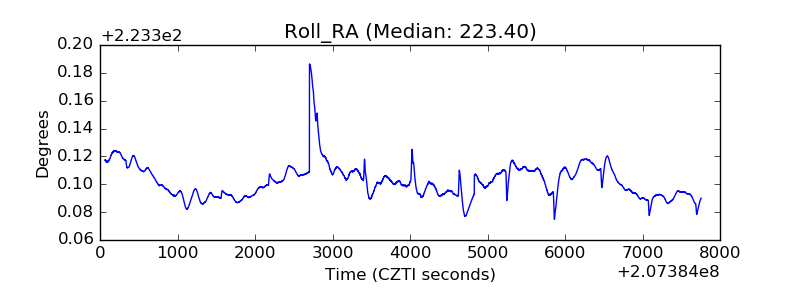 |
| Veto Counter | 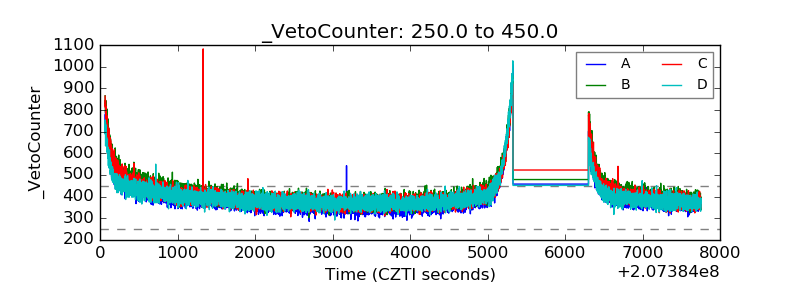 |