| Param | Original file | Final file |
|---|---|---|
| Filename | modeM0/AS1G05_083T03_9000000566_04504cztM0_level2.evt | modeM0/AS1G05_083T03_9000000566_04504cztM0_level2_quad_clean.evt |
| Size (bytes) | 507,245,760 | 79,833,600 |
| Size | 483.7 MB | 76.1 MB |
| Events in quadrant A | 3,810,320 | 495,690 |
| Events in quadrant B | 4,353,937 | 488,025 |
| Events in quadrant C | 2,943,289 | 497,253 |
| Events in quadrant D | 3,808,871 | 478,733 |
| Mode SS | |||
|---|---|---|---|
| Quadrant | BADHDUFLAG | Total packets | Discarded packets |
| A | 0 | 134 | 0 |
| B | 0 | 134 | 0 |
| C | 0 | 134 | 0 |
| D | 0 | 134 | 0 |
| Mode M0 | |||
|---|---|---|---|
| Quadrant | BADHDUFLAG | Total packets | Discarded packets |
| A | 0 | 15726 | 2 |
| B | 0 | 17088 | 3 |
| C | 0 | 13402 | 1 |
| D | 0 | 15885 | 1 |
| Mode M9 | |||
|---|---|---|---|
| Quadrant | BADHDUFLAG | Total packets | Discarded packets |
| A | 0 | 7 | 0 |
| B | 0 | 7 | 0 |
| C | 0 | 7 | 0 |
| D | 0 | 7 | 0 |
| Quadrant | Total seconds | Saturated seconds | Saturation percentage |
|---|---|---|---|
| A | 6561 | 186 | 2.834934% |
| B | 6560 | 302 | 4.603659% |
| C | 6561 | 45 | 0.685871% |
| D | 6561 | 141 | 2.149063% |
Noise dominated data is calculated using 1-second bins in cleaned event files. If a bin has >2000 counts, and if more than 50% of those come from <1% of pixels, then it is considered to be noise-dominated and hence unusable.
| Quadrant | # 1 sec bins | Bins with >0 counts | Bins with >2000 counts | High rate bins dominated by noise | Noise dominated (total time) | Noise dominated (detector-on time) | Marked lightcurve |
|---|---|---|---|---|---|---|---|
| A | 7256 | 6562 | 77 | 77 | 1.06% | 1.17% | 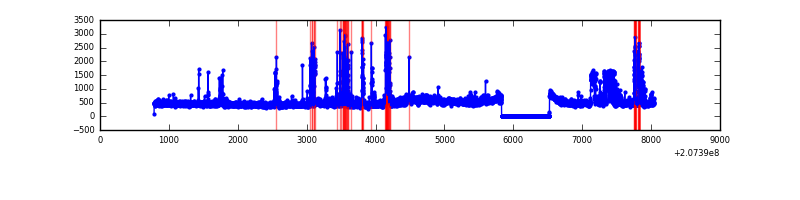 |
| B | 7256 | 6562 | 169 | 169 | 2.33% | 2.58% | 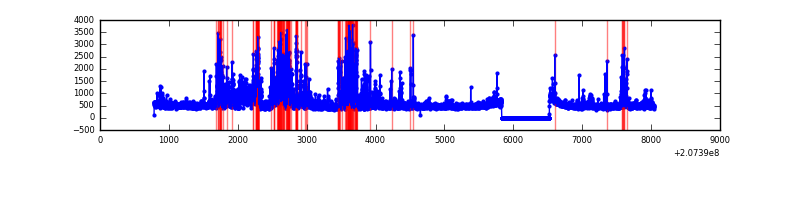 |
| C | 7256 | 6562 | 0 | 0 | 0.00% | 0.00% | 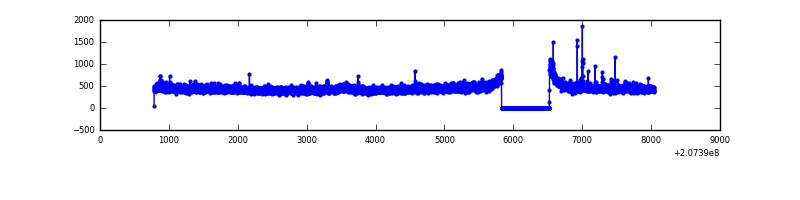 |
| D | 7256 | 6562 | 78 | 78 | 1.07% | 1.19% | 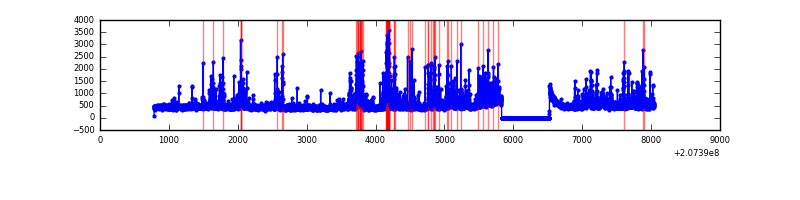 |
Top three noisy pixels from each quadrant. If the there are fewer than three noisy pixels in the level2.evt file, extra rows are filled as -1
| Pixel properties | Quadrant properties | ||||||
|---|---|---|---|---|---|---|---|
| Quadrant | DetID | PixID | Counts | Sigma | Mean | Median | Sigma |
| A | 0 | 31 | 324910 | 2091.16 | 759 | 743 | 155.0 |
| A | 0 | 118 | 188806 | 1213.17 | 759 | 743 | 155.0 |
| A | 0 | 47 | 143270 | 919.42 | 759 | 743 | 155.0 |
| B | 10 | 16 | 1058221 | 7209.49 | 759 | 739 | 146.7 |
| B | 15 | 204 | 199893 | 1357.75 | 759 | 739 | 146.7 |
| B | 4 | 80 | 40879 | 273.66 | 759 | 739 | 146.7 |
| C | 9 | 247 | 45962 | 263.52 | 738 | 740 | 171.6 |
| C | 1 | 16 | 6866 | 35.7 | 738 | 740 | 171.6 |
| C | 13 | 61 | 6104 | 31.26 | 738 | 740 | 171.6 |
| D | 14 | 34 | 618888 | 3478.27 | 738 | 715 | 177.7 |
| D | 13 | 235 | 218847 | 1227.36 | 738 | 715 | 177.7 |
| D | 1 | 20 | 44100 | 244.11 | 738 | 715 | 177.7 |
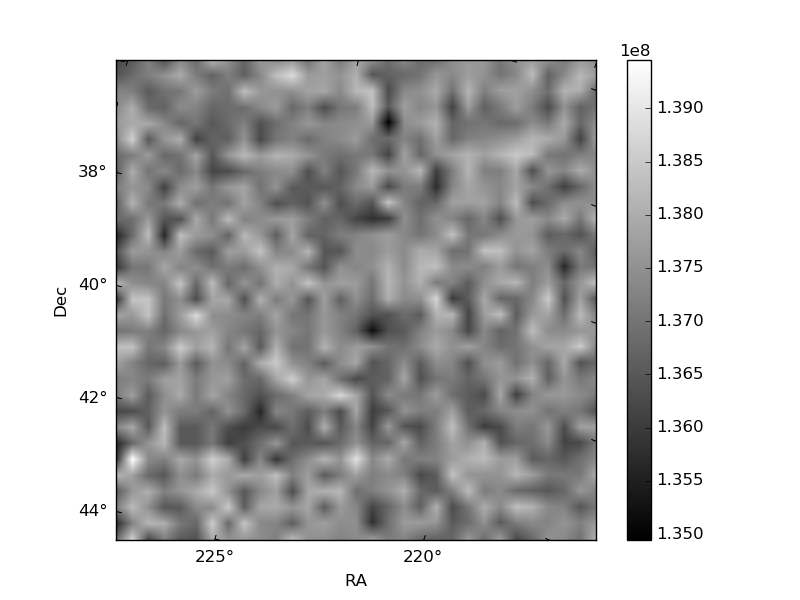
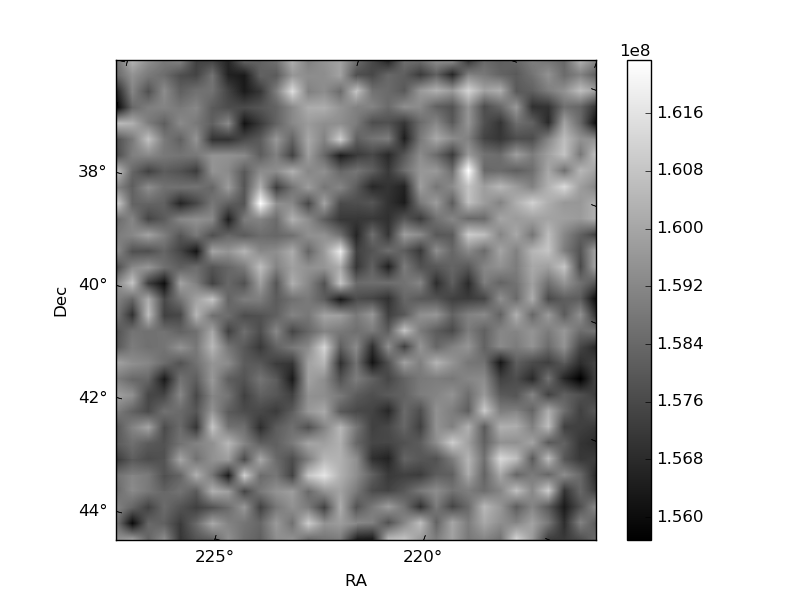
Histogram calculated using DETX and DETY for each event in the final _common_clean file
| Quadrant A | 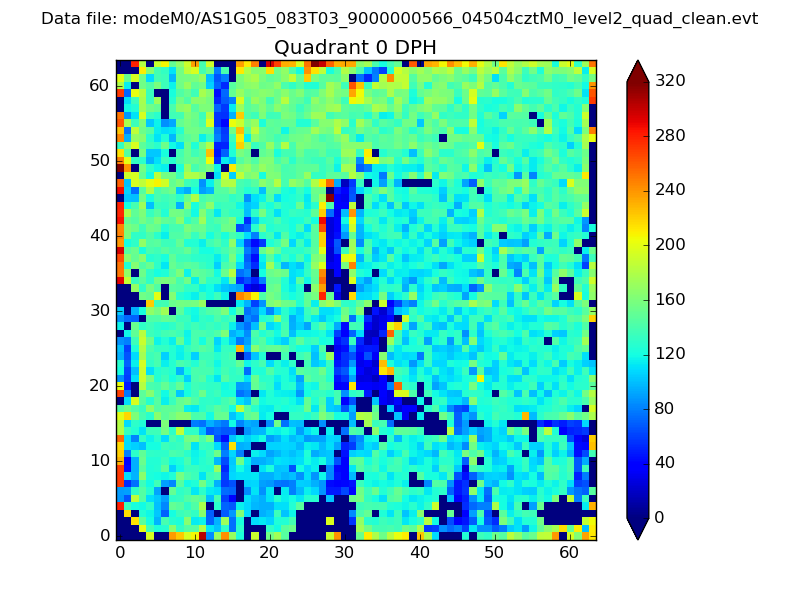 |
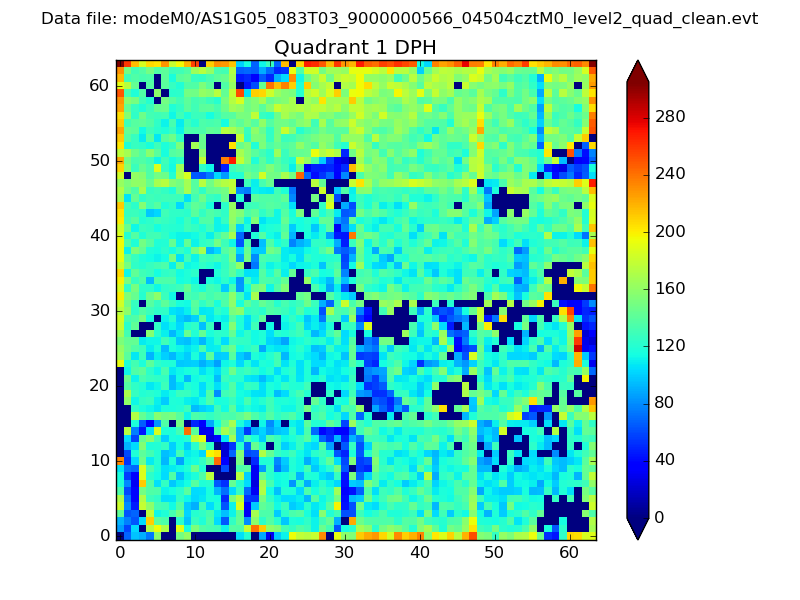 |
Quadrant B |
|---|---|---|---|
| Quadrant D | 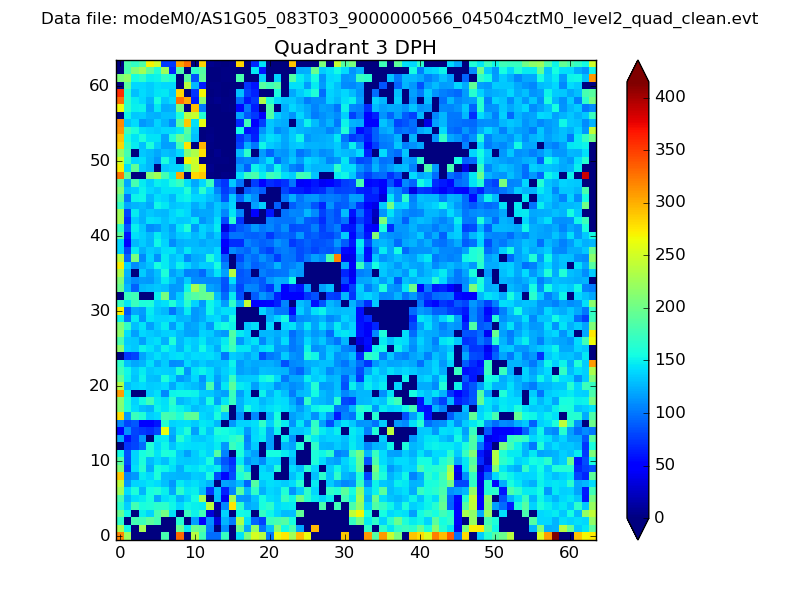 |
 |
Quadrant C |
| Plot type | Count rate plots | Images |
|---|---|---|
| Comparison with Poisson distribution Blue bars denote a histogram of data divided into 1 sec bins. Red curve is a Poisson curve with rate = median count rate of data. |
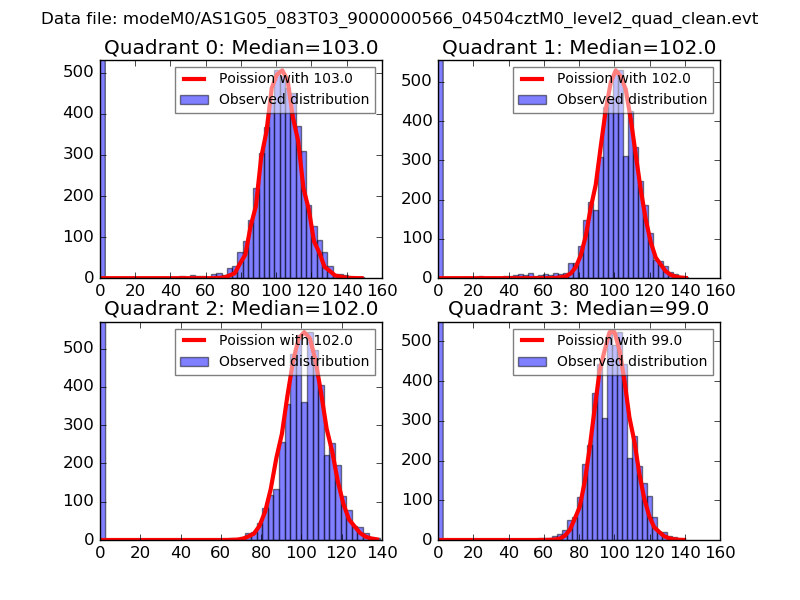 |
 |
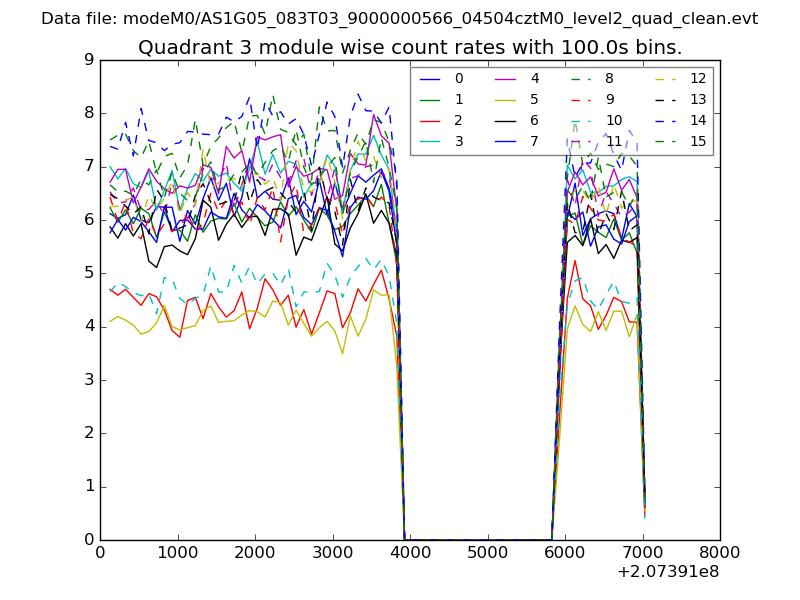
| Quadrant-wise count rates Data is divided into 100 sec bins |
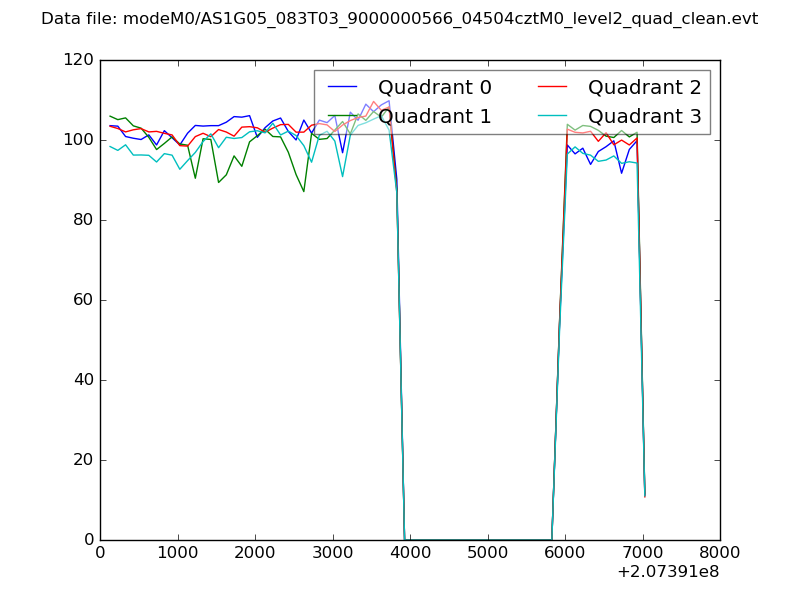 |
|
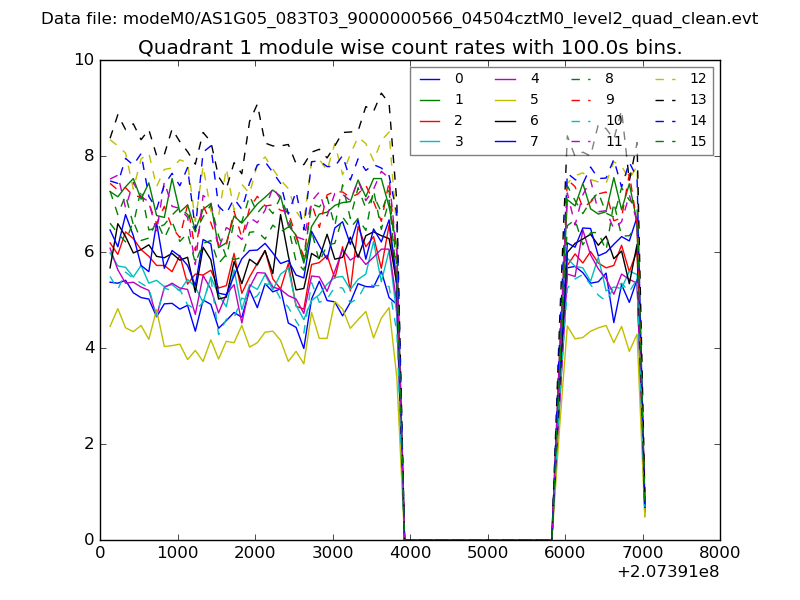
| Module-wise count rates for Quadrant A Data is divided into 100 sec bins |
 |
 |
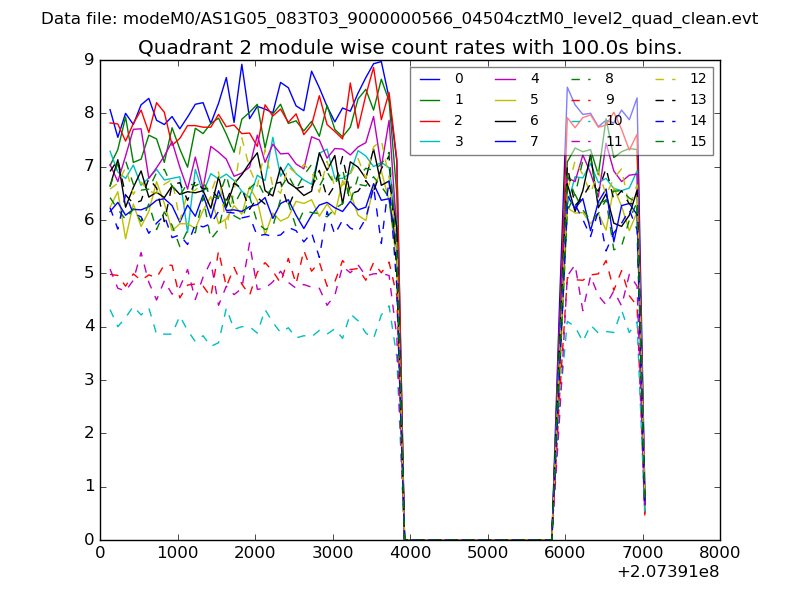
| Module-wise count rates for Quadrant B Data is divided into 100 sec bins |
 |
 |
| Module-wise count rates for Quadrant C Data is divided into 100 sec bins |
 |
 |
| Module-wise count rates for Quadrant D Data is divided into 100 sec bins |
 |
 |
| Parameter | Plot |
|---|---|
| CZT HV Monitor | 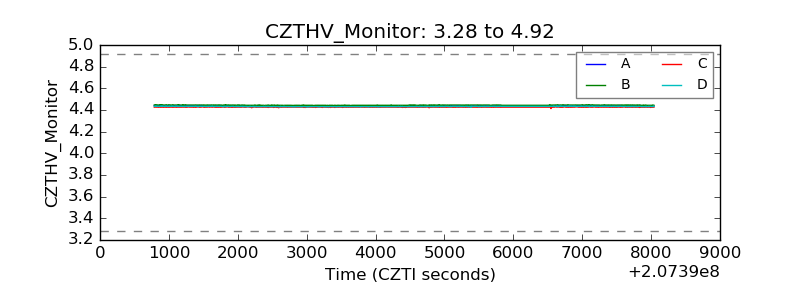 |
| D_VDD | 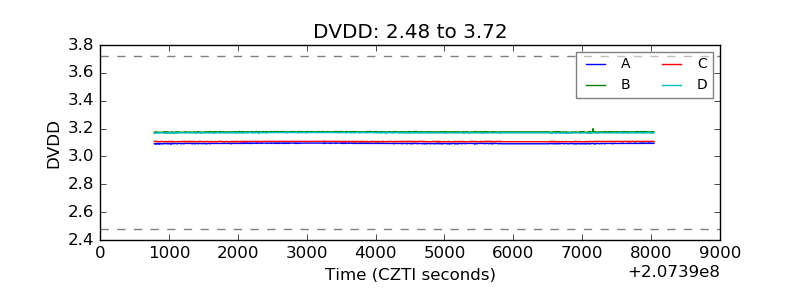 |
| Temperature 1 | 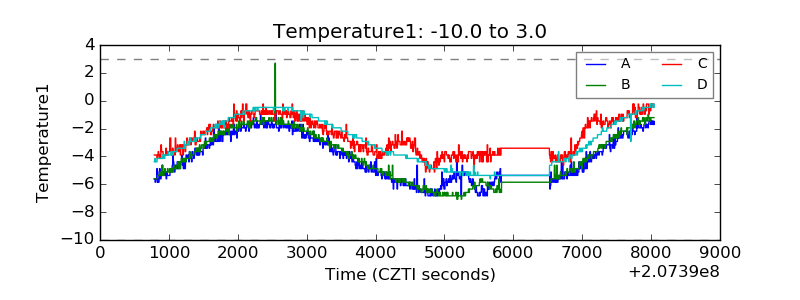 |
| Veto HV Monitor | 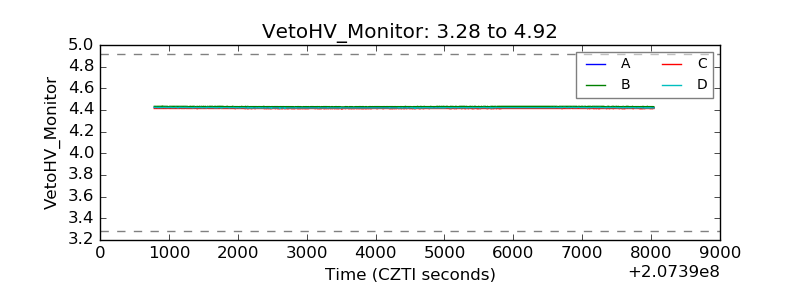 |
| Veto LLD | 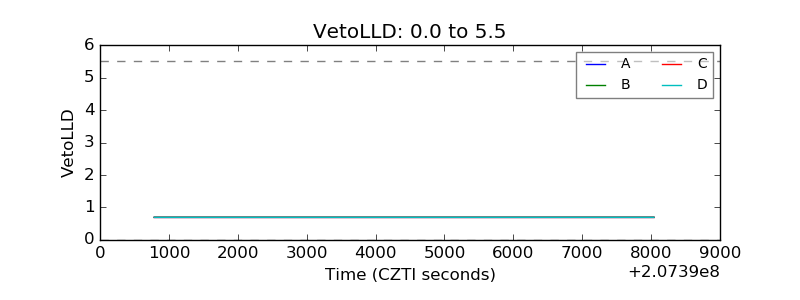 |
| Alpha Counter | 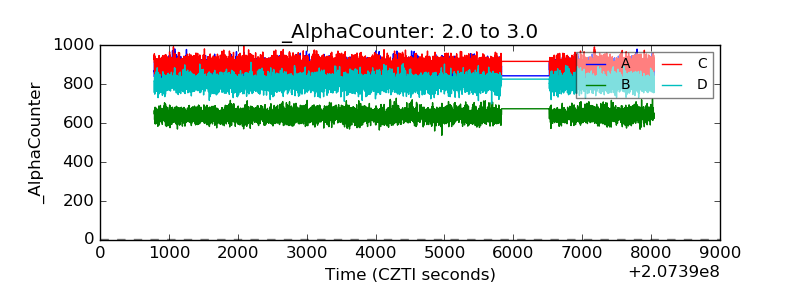 |
| _CPM_Rate | 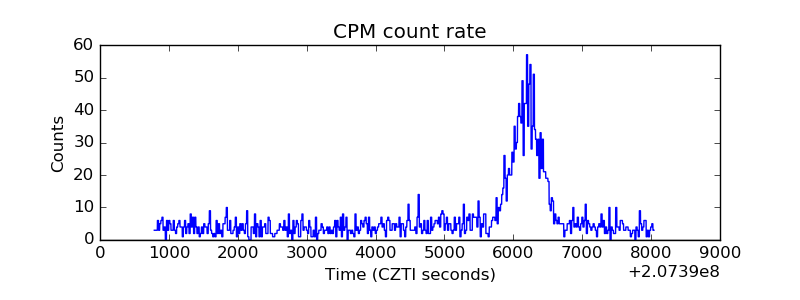 |
| CZT Counter | 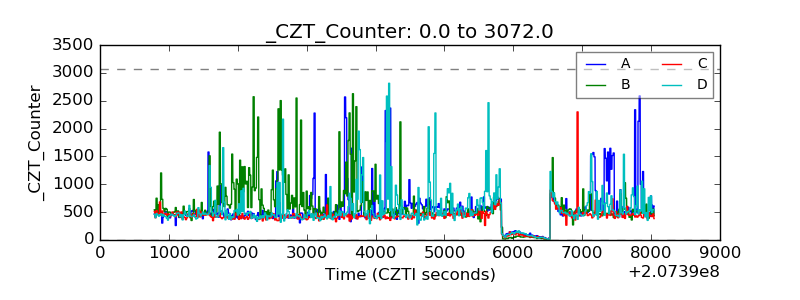 |
| +2.5 Volts monitor |  |
| +5 Volts monitor |  |
| _ROLL_ROT | 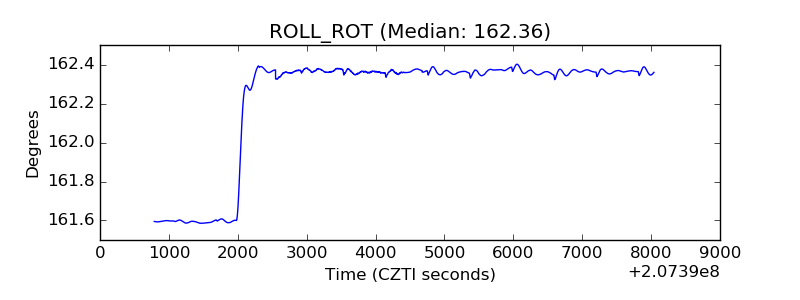 |
| _Roll_DEC | 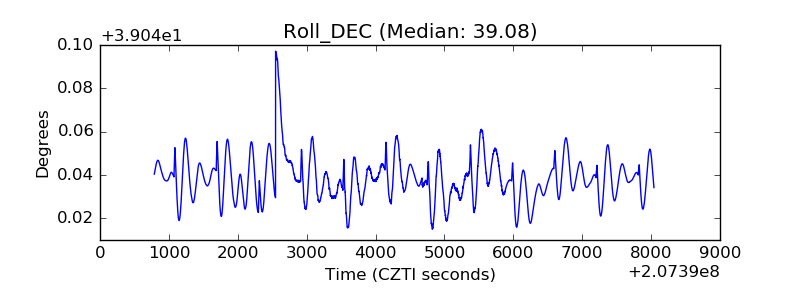 |
| _Roll_RA |  |
| Veto Counter | 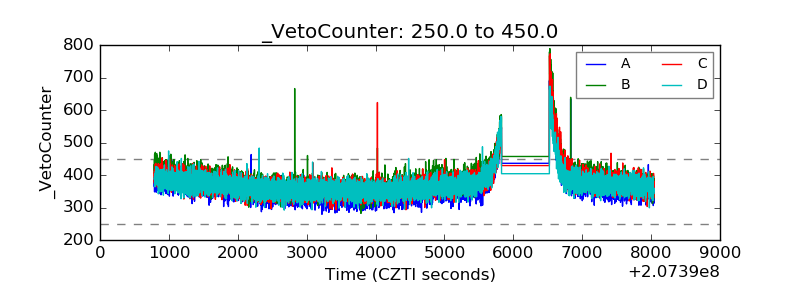 |