| Param | Original file | Final file |
|---|---|---|
| Filename | modeM0/AS1G05_083T03_9000000566_04505cztM0_level2.evt | modeM0/AS1G05_083T03_9000000566_04505cztM0_level2_quad_clean.evt |
| Size (bytes) | 667,673,280 | 89,087,040 |
| Size | 636.7 MB | 85.0 MB |
| Events in quadrant A | 5,853,522 | 531,912 |
| Events in quadrant B | 4,216,327 | 554,860 |
| Events in quadrant C | 3,702,259 | 555,770 |
| Events in quadrant D | 5,935,322 | 527,727 |
| Mode SS | |||
|---|---|---|---|
| Quadrant | BADHDUFLAG | Total packets | Discarded packets |
| A | 0 | 154 | 0 |
| B | 0 | 154 | 0 |
| C | 0 | 154 | 0 |
| D | 0 | 154 | 0 |
| Mode M0 | |||
|---|---|---|---|
| Quadrant | BADHDUFLAG | Total packets | Discarded packets |
| A | 0 | 22443 | 2 |
| B | 0 | 17327 | 1 |
| C | 0 | 16295 | 1 |
| D | 0 | 22824 | 1 |
| Mode M9 | |||
|---|---|---|---|
| Quadrant | BADHDUFLAG | Total packets | Discarded packets |
| A | 0 | 2 | 0 |
| B | 0 | 2 | 0 |
| C | 0 | 2 | 0 |
| D | 0 | 2 | 0 |
| Quadrant | Total seconds | Saturated seconds | Saturation percentage |
|---|---|---|---|
| A | 7583 | 853 | 11.248846% |
| B | 7583 | 216 | 2.848477% |
| C | 7583 | 121 | 1.595675% |
| D | 7583 | 492 | 6.488197% |
Noise dominated data is calculated using 1-second bins in cleaned event files. If a bin has >2000 counts, and if more than 50% of those come from <1% of pixels, then it is considered to be noise-dominated and hence unusable.
| Quadrant | # 1 sec bins | Bins with >0 counts | Bins with >2000 counts | High rate bins dominated by noise | Noise dominated (total time) | Noise dominated (detector-on time) | Marked lightcurve |
|---|---|---|---|---|---|---|---|
| A | 7758 | 7585 | 458 | 458 | 5.90% | 6.04% | 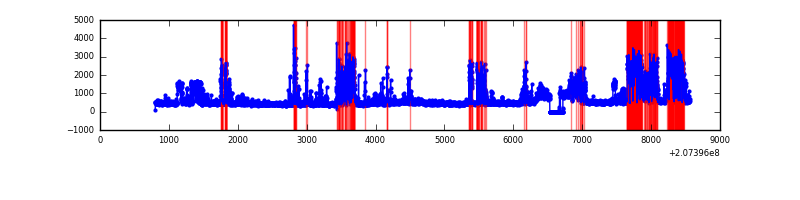 |
| B | 7758 | 7585 | 57 | 57 | 0.73% | 0.75% | 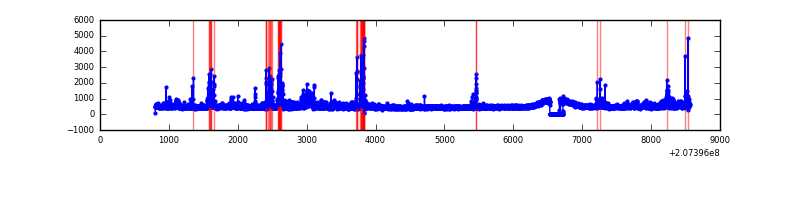 |
| C | 7758 | 7585 | 11 | 11 | 0.14% | 0.15% | 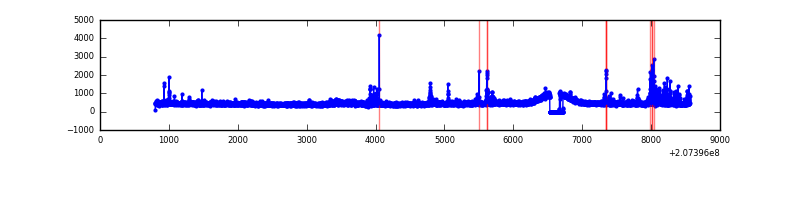 |
| D | 7758 | 7585 | 321 | 321 | 4.14% | 4.23% | 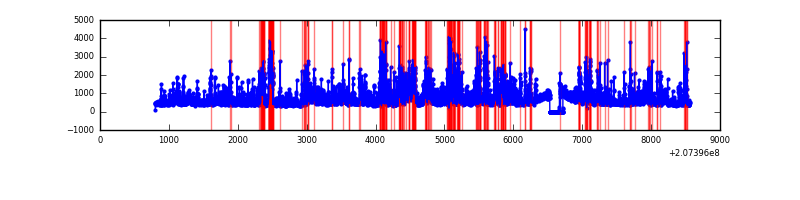 |
Top three noisy pixels from each quadrant. If the there are fewer than three noisy pixels in the level2.evt file, extra rows are filled as -1
| Pixel properties | Quadrant properties | ||||||
|---|---|---|---|---|---|---|---|
| Quadrant | DetID | PixID | Counts | Sigma | Mean | Median | Sigma |
| A | 0 | 31 | 1569958 | 8861.32 | 865 | 844 | 177.1 |
| A | 0 | 13 | 417839 | 2354.91 | 865 | 844 | 177.1 |
| A | 0 | 118 | 224836 | 1264.96 | 865 | 844 | 177.1 |
| B | 15 | 204 | 145519 | 837.49 | 896 | 873 | 172.7 |
| B | 8 | 3 | 143727 | 827.11 | 896 | 873 | 172.7 |
| B | 2 | 249 | 129082 | 742.32 | 896 | 873 | 172.7 |
| C | 9 | 247 | 257776 | 1268.0 | 869 | 872 | 202.6 |
| C | 9 | 54 | 28875 | 138.21 | 869 | 872 | 202.6 |
| C | 9 | 16 | 8315 | 36.73 | 869 | 872 | 202.6 |
| D | 14 | 34 | 1735716 | 8348.19 | 858 | 830 | 207.8 |
| D | 13 | 235 | 317578 | 1524.18 | 858 | 830 | 207.8 |
| D | 10 | 40 | 282148 | 1353.69 | 858 | 830 | 207.8 |
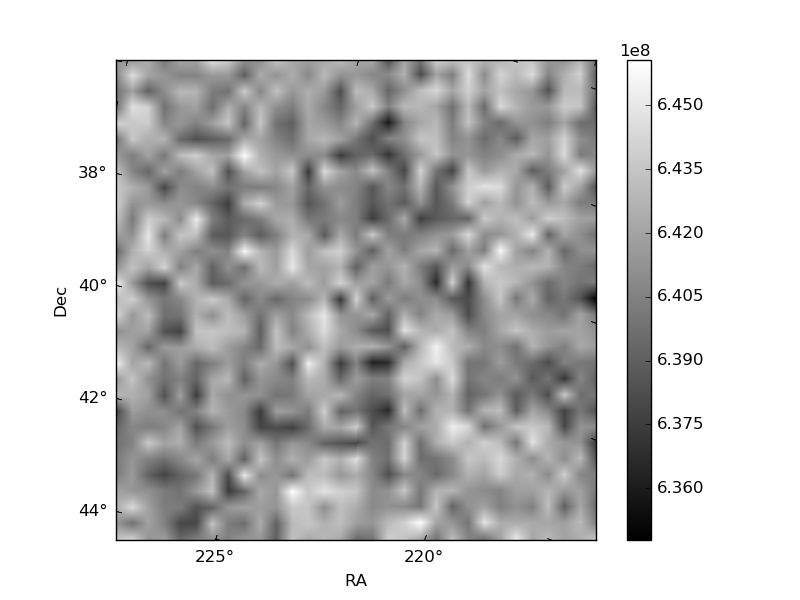
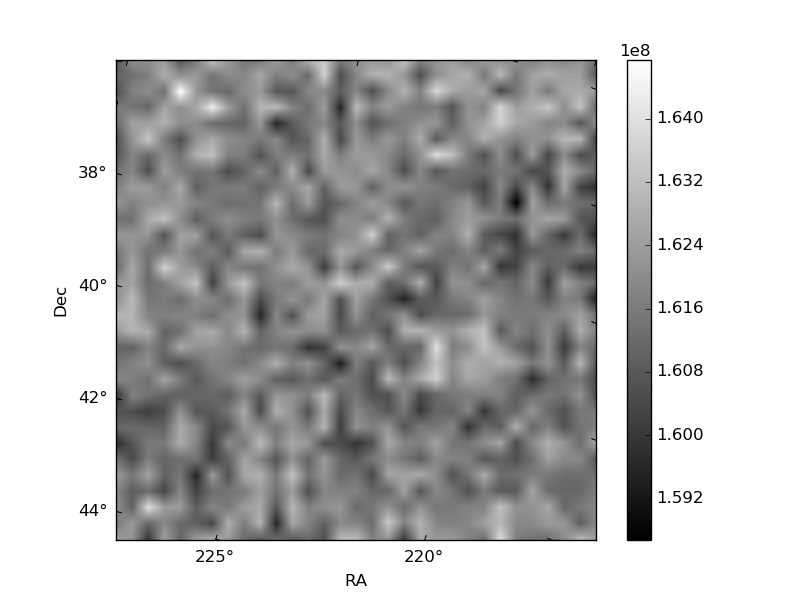
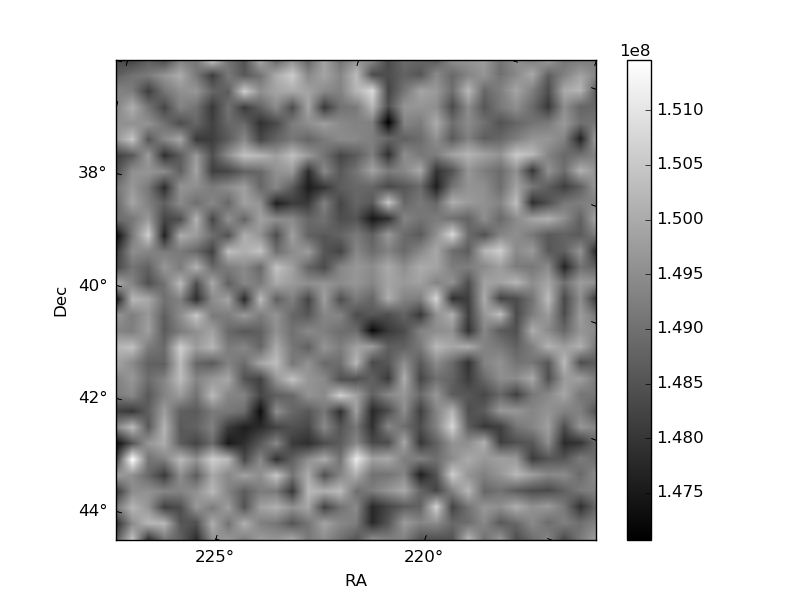
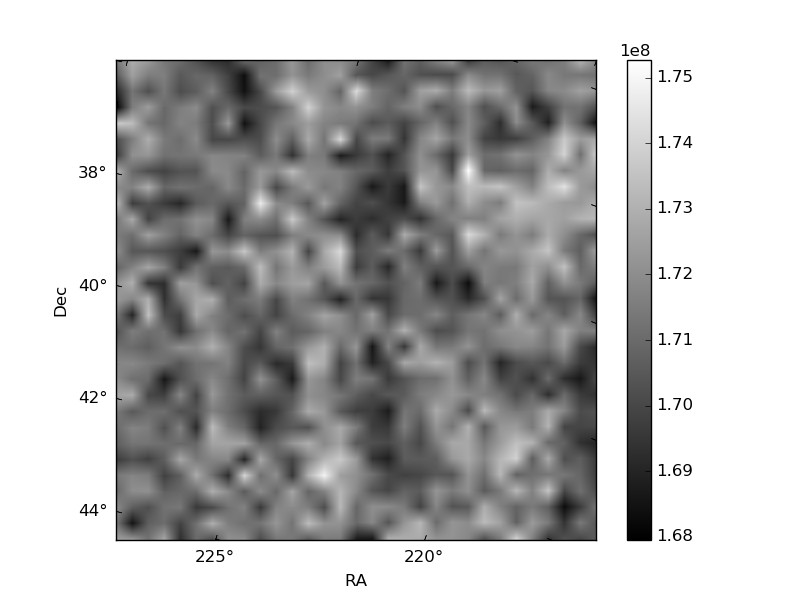
Histogram calculated using DETX and DETY for each event in the final _common_clean file
| Quadrant A | 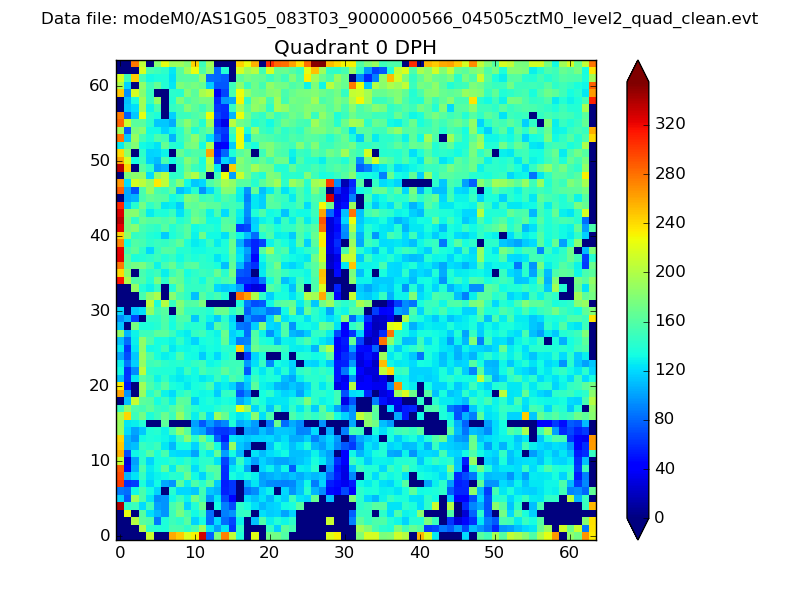 |
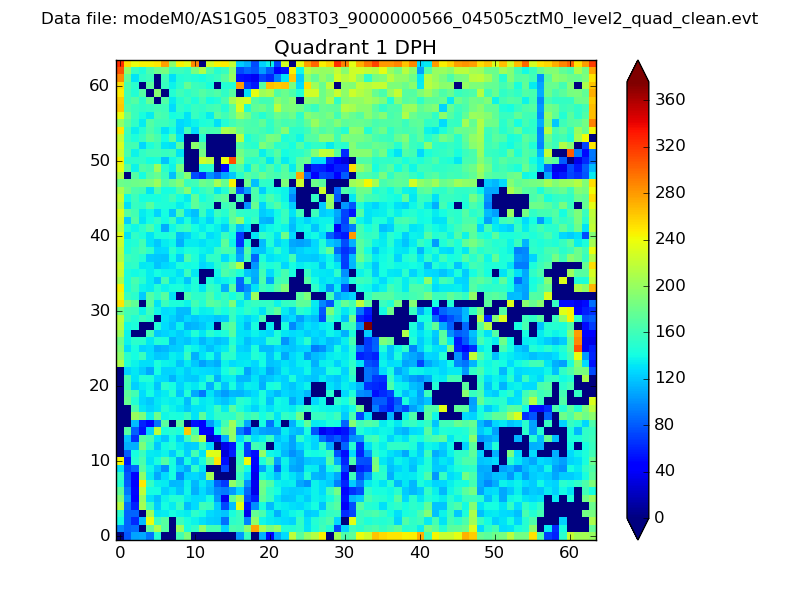 |
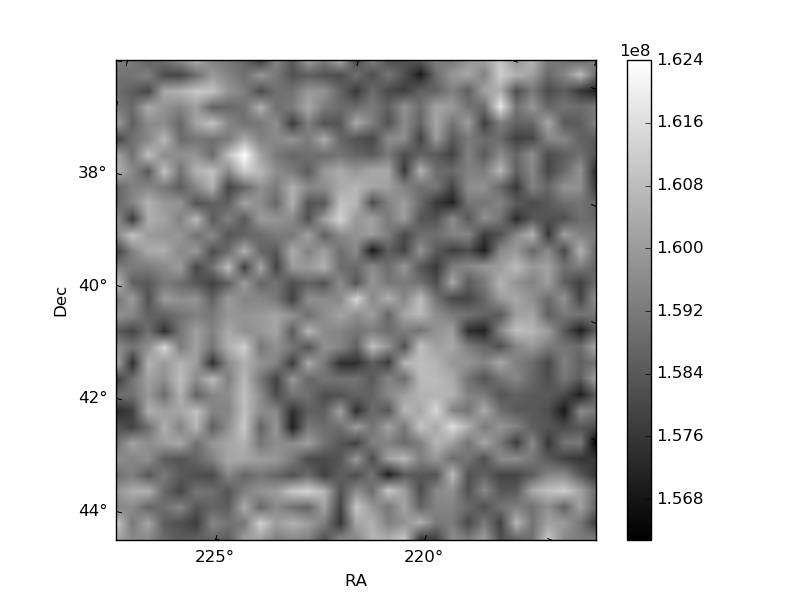
Quadrant B |
|---|---|---|---|
| Quadrant D | 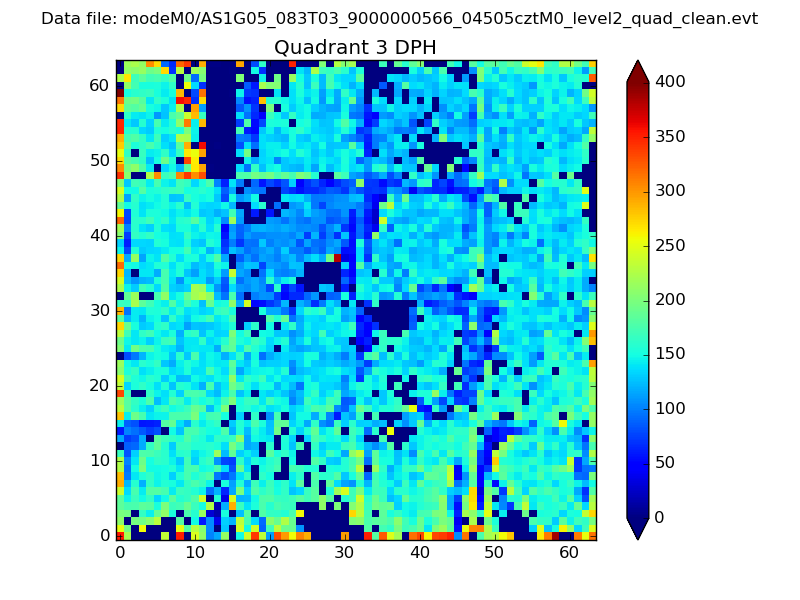 |
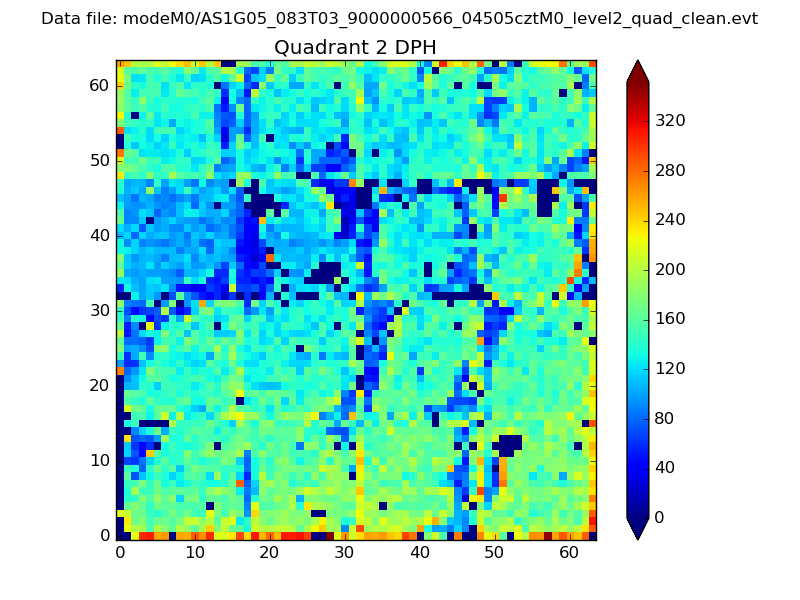 |
Quadrant C |
| Plot type | Count rate plots | Images |
|---|---|---|
| Comparison with Poisson distribution Blue bars denote a histogram of data divided into 1 sec bins. Red curve is a Poisson curve with rate = median count rate of data. |
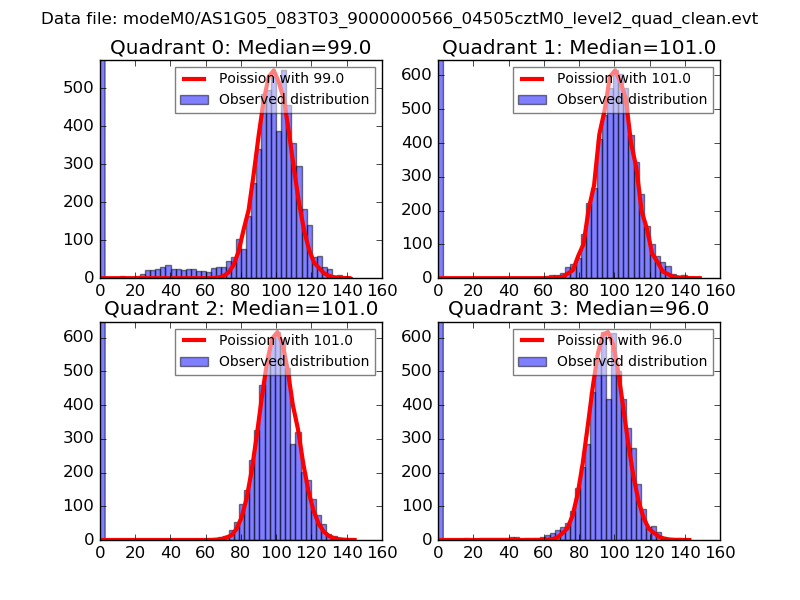 |
 |
| Quadrant-wise count rates Data is divided into 100 sec bins |
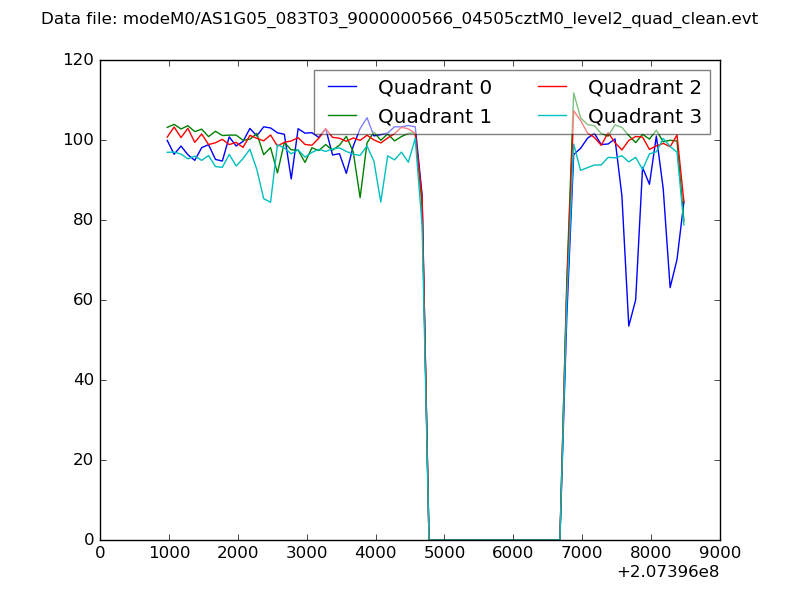 |
|
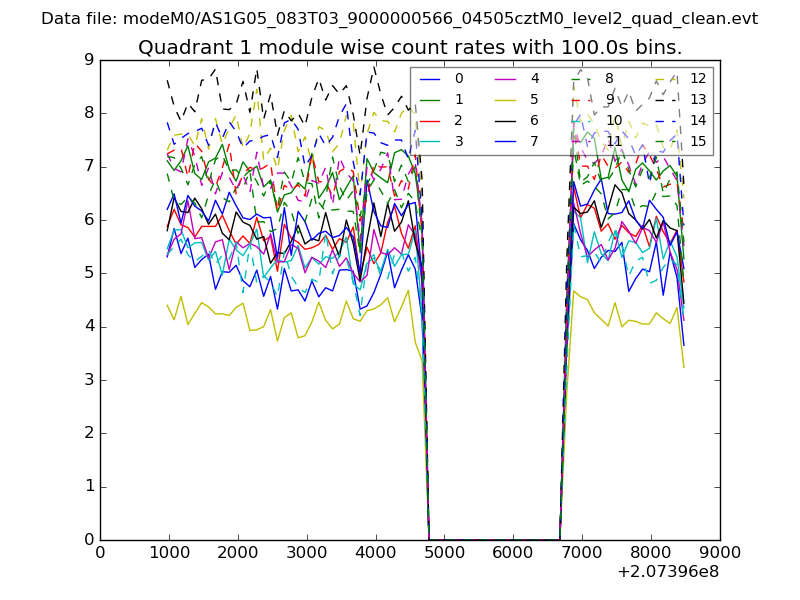
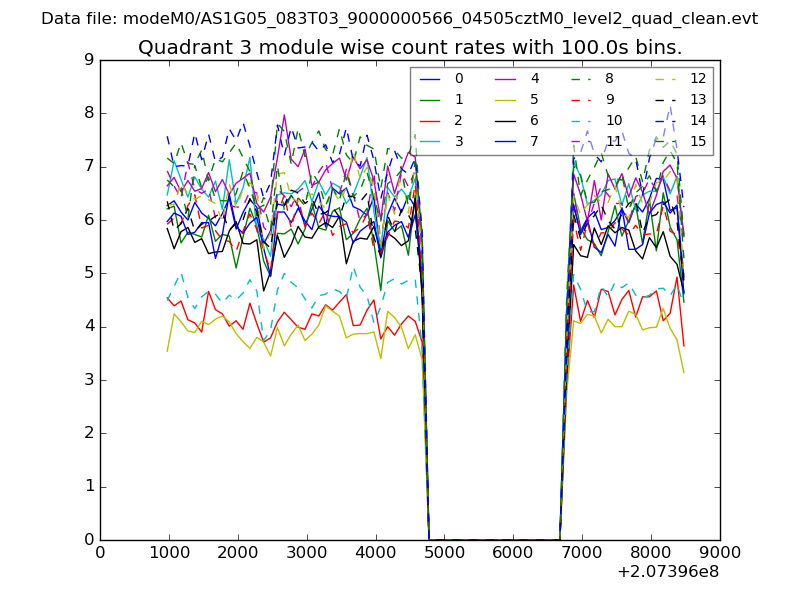
| Module-wise count rates for Quadrant A Data is divided into 100 sec bins |
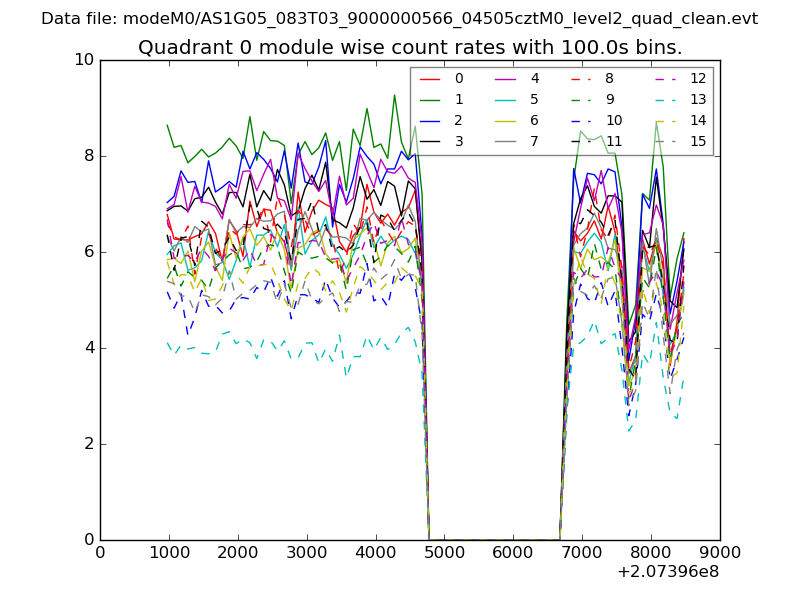 |
 |
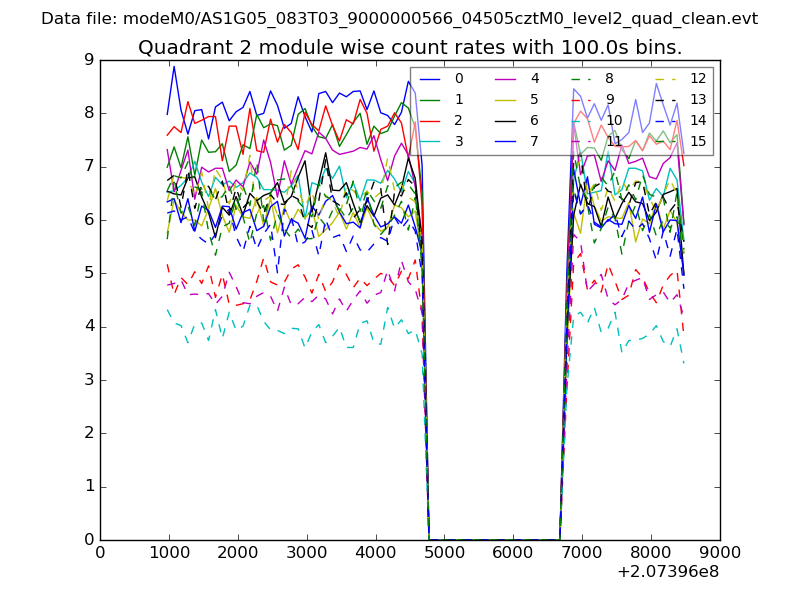
| Module-wise count rates for Quadrant B Data is divided into 100 sec bins |
 |
 |
| Module-wise count rates for Quadrant C Data is divided into 100 sec bins |
 |
 |
| Module-wise count rates for Quadrant D Data is divided into 100 sec bins |
 |
 |
| Parameter | Plot |
|---|---|
| CZT HV Monitor | 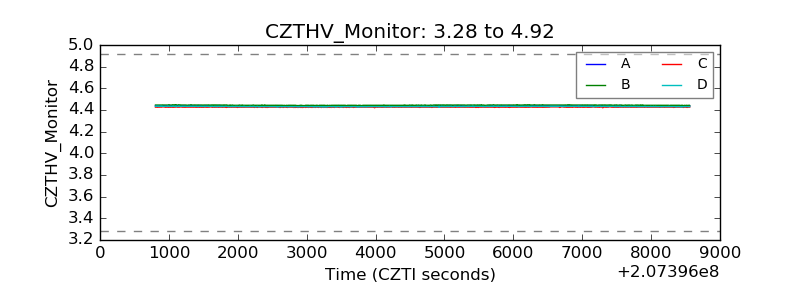 |
| D_VDD | 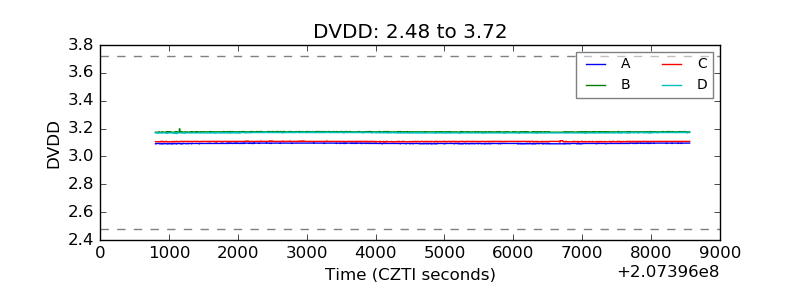 |
| Temperature 1 | 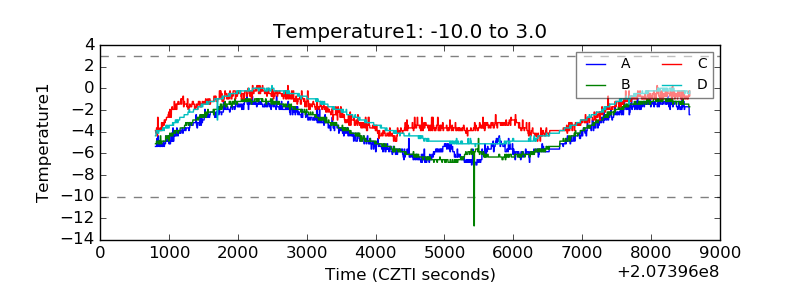 |
| Veto HV Monitor |  |
| Veto LLD | 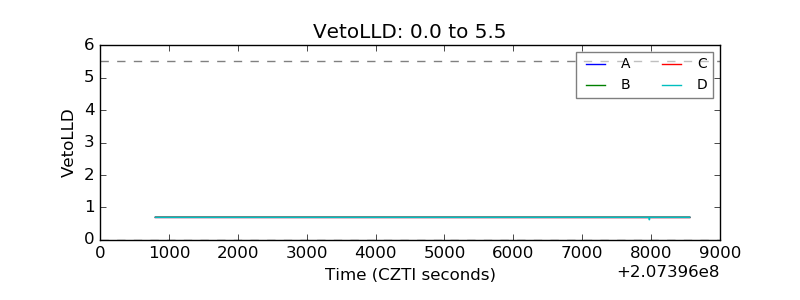 |
| Alpha Counter | 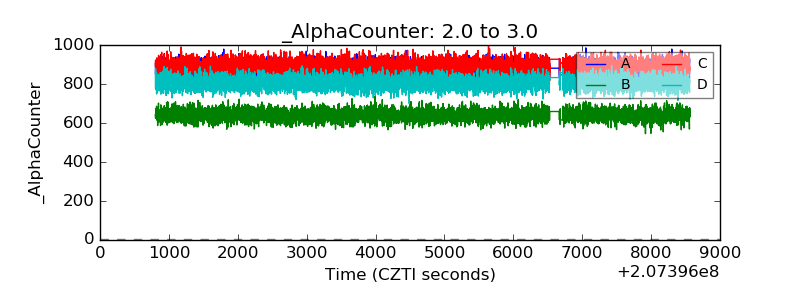 |
| _CPM_Rate | 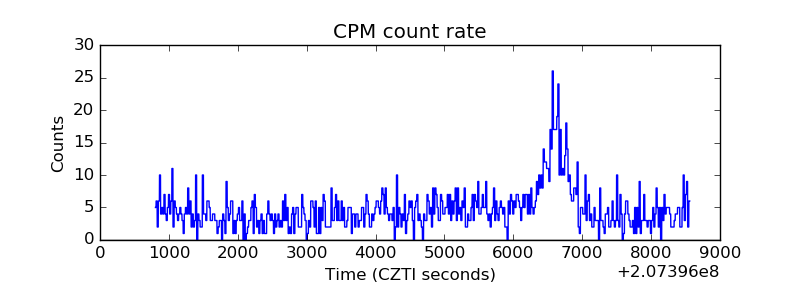 |
| CZT Counter | 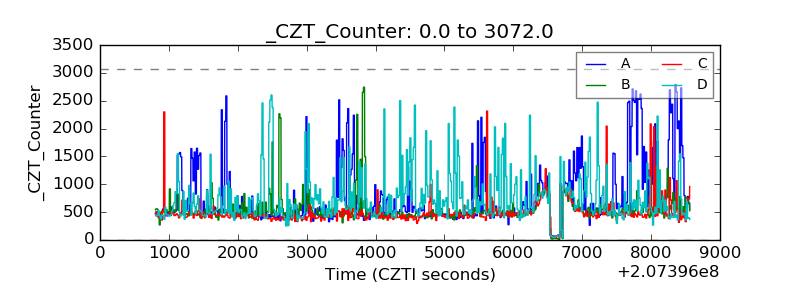 |
| +2.5 Volts monitor |  |
| +5 Volts monitor |  |
| _ROLL_ROT | 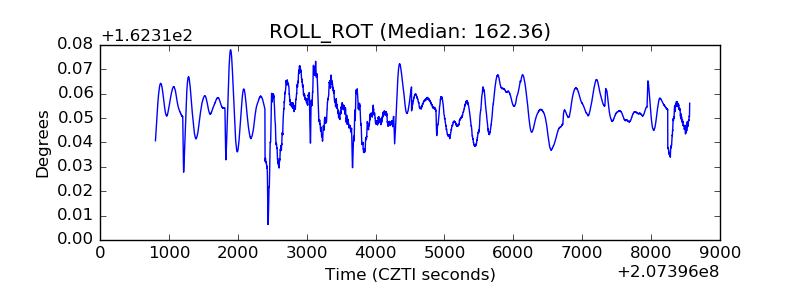 |
| _Roll_DEC | 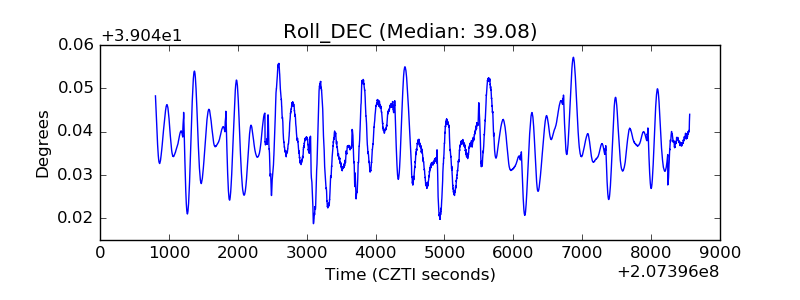 |
| _Roll_RA | 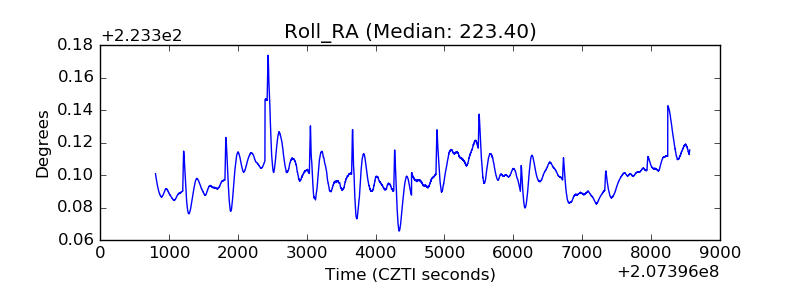 |
| Veto Counter | 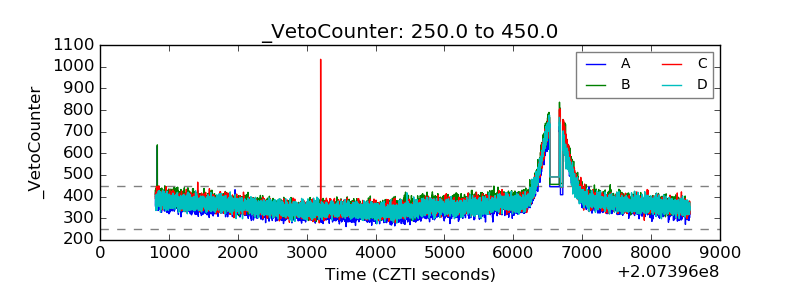 |