| Param | Original file | Final file |
|---|---|---|
| Filename | modeM0/AS1G05_083T03_9000000566_04506cztM0_level2.evt | modeM0/AS1G05_083T03_9000000566_04506cztM0_level2_quad_clean.evt |
| Size (bytes) | 636,428,160 | 84,139,200 |
| Size | 606.9 MB | 80.2 MB |
| Events in quadrant A | 4,956,159 | 504,271 |
| Events in quadrant B | 3,817,882 | 523,950 |
| Events in quadrant C | 4,351,495 | 519,150 |
| Events in quadrant D | 5,658,905 | 496,249 |
| Mode SS | |||
|---|---|---|---|
| Quadrant | BADHDUFLAG | Total packets | Discarded packets |
| A | 0 | 146 | 0 |
| B | 0 | 146 | 0 |
| C | 0 | 146 | 0 |
| D | 0 | 146 | 0 |
| Mode M0 | |||
|---|---|---|---|
| Quadrant | BADHDUFLAG | Total packets | Discarded packets |
| A | 0 | 19741 | 2 |
| B | 0 | 16067 | 4 |
| C | 0 | 18013 | 1 |
| D | 0 | 21838 | 1 |
| Mode M9 | |||
|---|---|---|---|
| Quadrant | BADHDUFLAG | Total packets | Discarded packets |
| A | 0 | 2 | 0 |
| B | 0 | 2 | 0 |
| C | 0 | 2 | 0 |
| D | 0 | 2 | 0 |
| Quadrant | Total seconds | Saturated seconds | Saturation percentage |
|---|---|---|---|
| A | 7243 | 599 | 8.270054% |
| B | 7242 | 131 | 1.808893% |
| C | 7243 | 166 | 2.291868% |
| D | 7243 | 643 | 8.877537% |
Noise dominated data is calculated using 1-second bins in cleaned event files. If a bin has >2000 counts, and if more than 50% of those come from <1% of pixels, then it is considered to be noise-dominated and hence unusable.
| Quadrant | # 1 sec bins | Bins with >0 counts | Bins with >2000 counts | High rate bins dominated by noise | Noise dominated (total time) | Noise dominated (detector-on time) | Marked lightcurve |
|---|---|---|---|---|---|---|---|
| A | 7378 | 7245 | 377 | 377 | 5.11% | 5.20% | 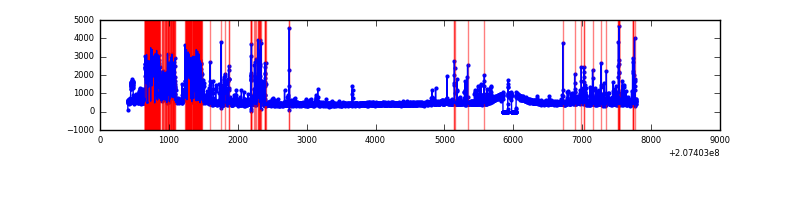 |
| B | 7378 | 7245 | 7 | 7 | 0.09% | 0.10% | 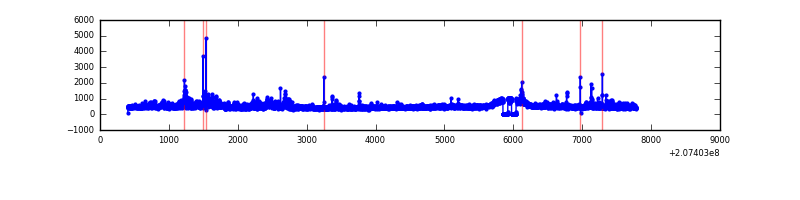 |
| C | 7378 | 7245 | 80 | 80 | 1.08% | 1.10% |  |
| D | 7378 | 7245 | 485 | 485 | 6.57% | 6.69% | 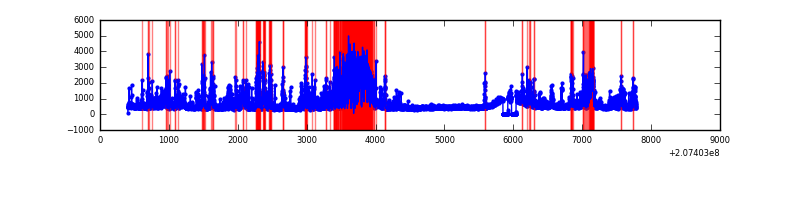 |
Top three noisy pixels from each quadrant. If the there are fewer than three noisy pixels in the level2.evt file, extra rows are filled as -1
| Pixel properties | Quadrant properties | ||||||
|---|---|---|---|---|---|---|---|
| Quadrant | DetID | PixID | Counts | Sigma | Mean | Median | Sigma |
| A | 0 | 31 | 800300 | 4694.27 | 824 | 805 | 170.3 |
| A | 0 | 13 | 598204 | 3507.66 | 824 | 805 | 170.3 |
| A | 0 | 118 | 259020 | 1516.12 | 824 | 805 | 170.3 |
| B | 15 | 204 | 165443 | 991.65 | 851 | 829 | 166.0 |
| B | 8 | 3 | 131676 | 788.23 | 851 | 829 | 166.0 |
| B | 4 | 169 | 42913 | 253.52 | 851 | 829 | 166.0 |
| C | 9 | 247 | 753871 | 3886.6 | 823 | 827 | 193.8 |
| C | 9 | 54 | 343603 | 1769.13 | 823 | 827 | 193.8 |
| C | 14 | 48 | 30920 | 155.32 | 823 | 827 | 193.8 |
| D | 14 | 34 | 1057358 | 5307.15 | 805 | 778 | 199.1 |
| D | 13 | 53 | 910153 | 4567.74 | 805 | 778 | 199.1 |
| D | 13 | 235 | 254832 | 1276.1 | 805 | 778 | 199.1 |
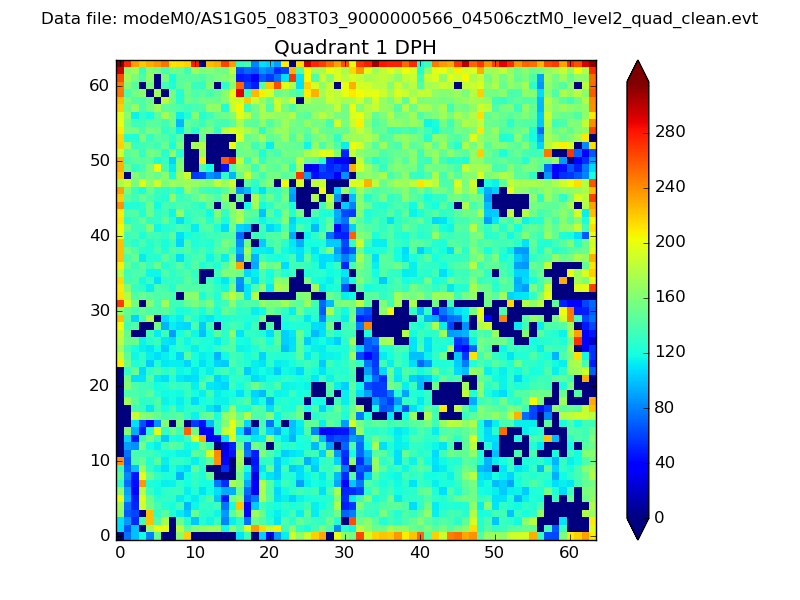
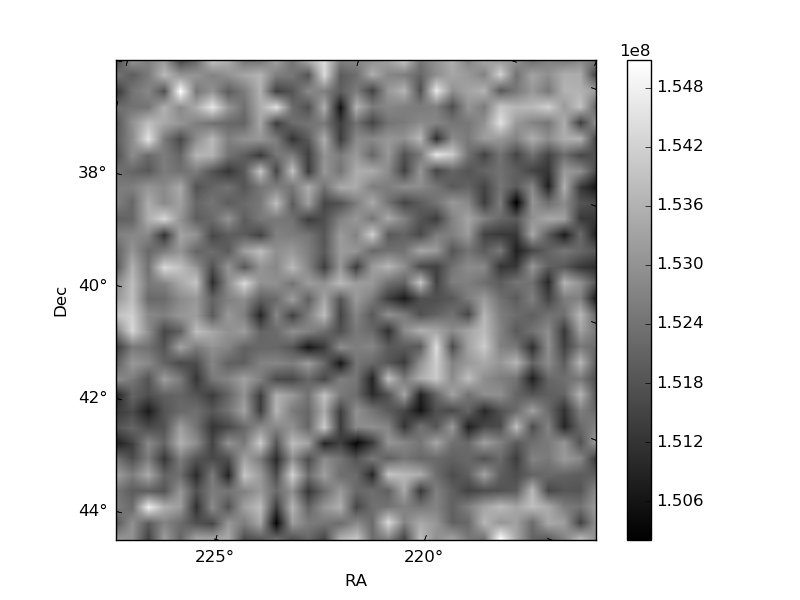
Histogram calculated using DETX and DETY for each event in the final _common_clean file
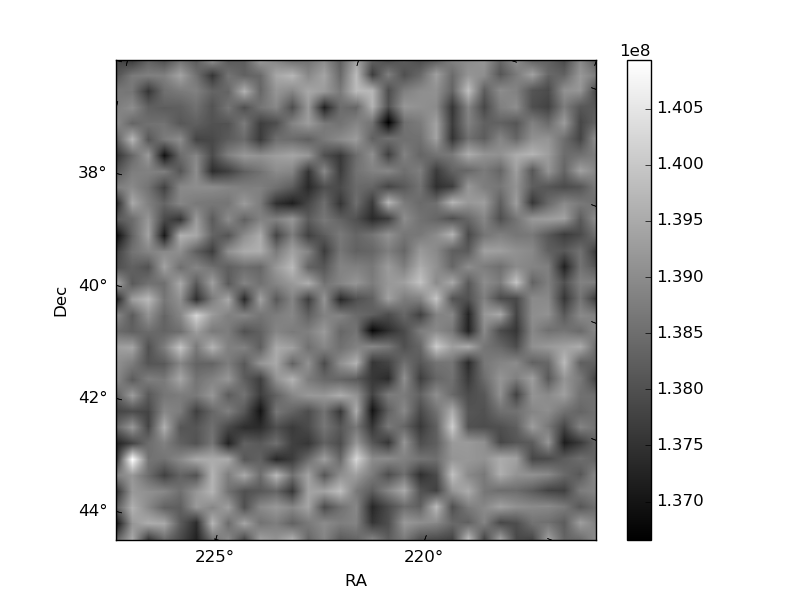
| Quadrant A | 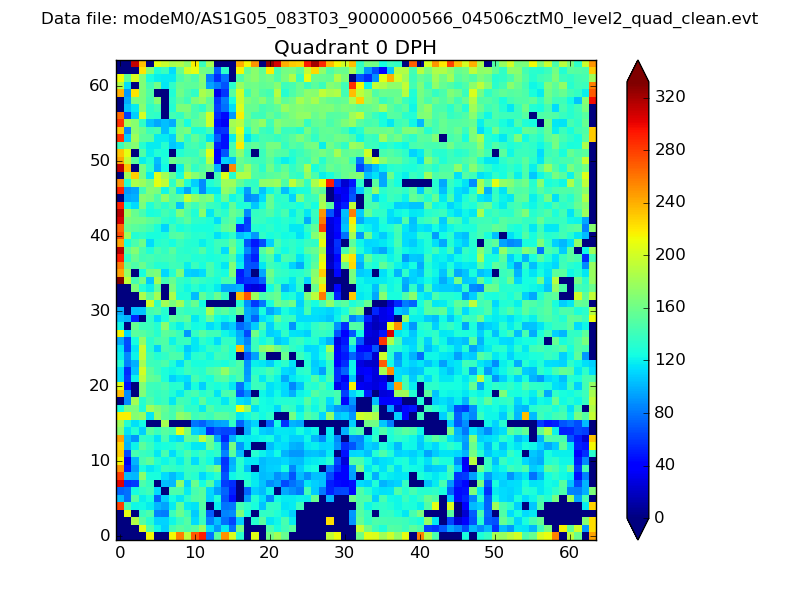 |
 |
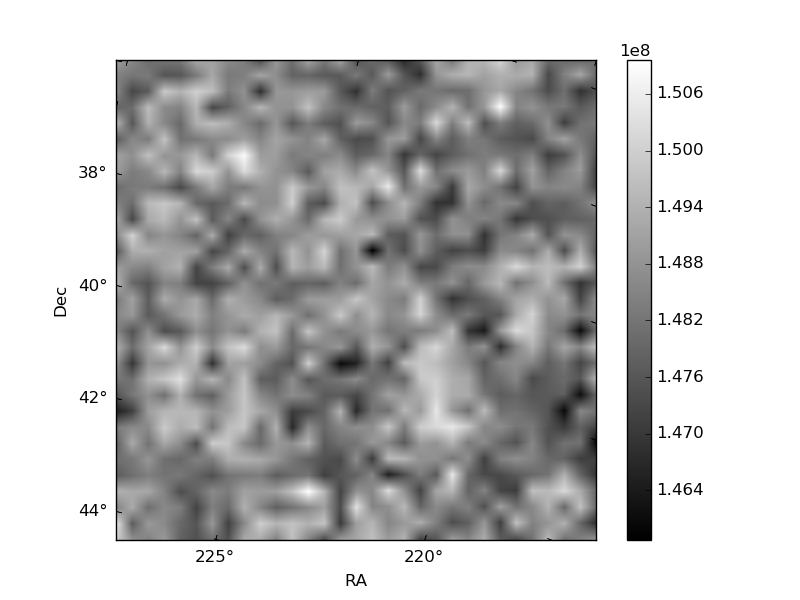
Quadrant B |
|---|---|---|---|
| Quadrant D | 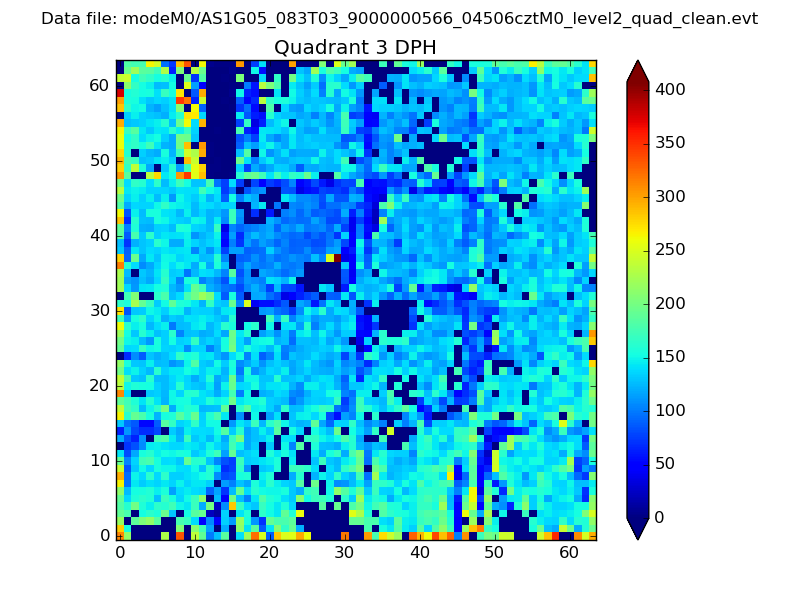 |
 |
Quadrant C |
| Plot type | Count rate plots | Images |
|---|---|---|
| Comparison with Poisson distribution Blue bars denote a histogram of data divided into 1 sec bins. Red curve is a Poisson curve with rate = median count rate of data. |
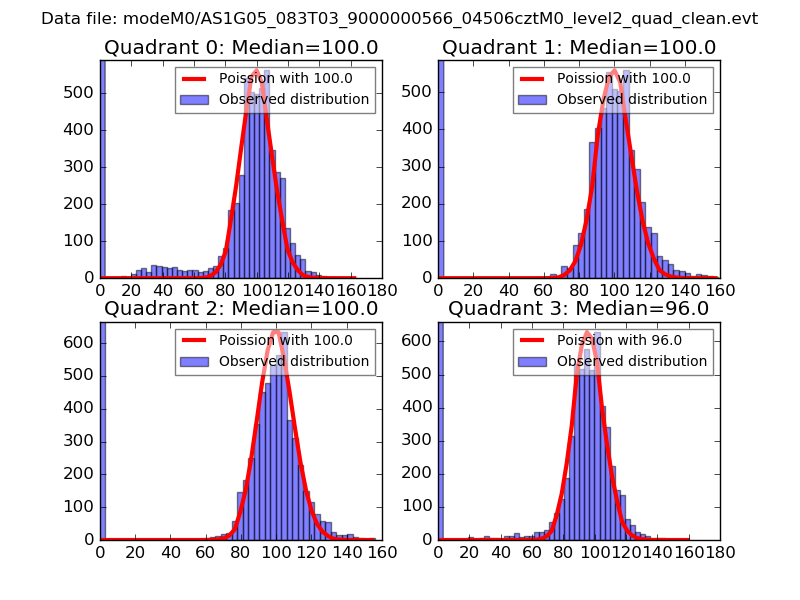 |
 |
| Quadrant-wise count rates Data is divided into 100 sec bins |
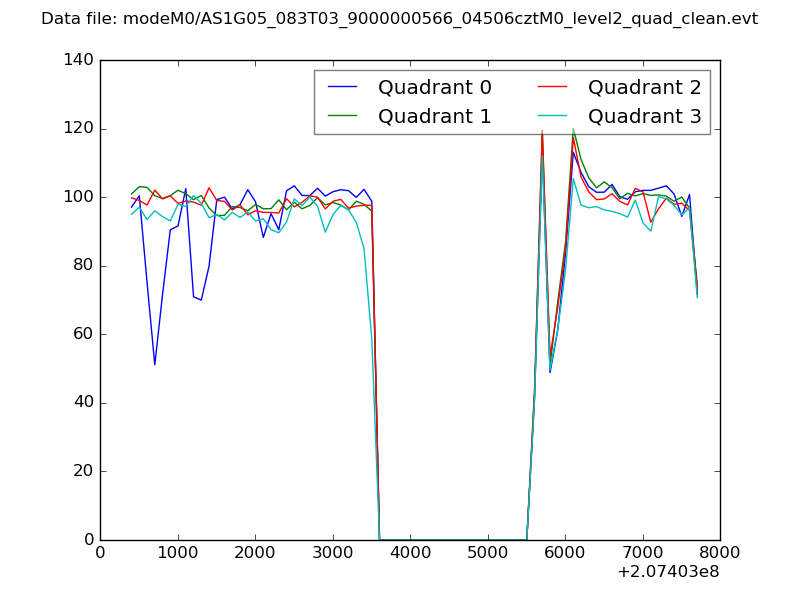 |
|
| Module-wise count rates for Quadrant A Data is divided into 100 sec bins |
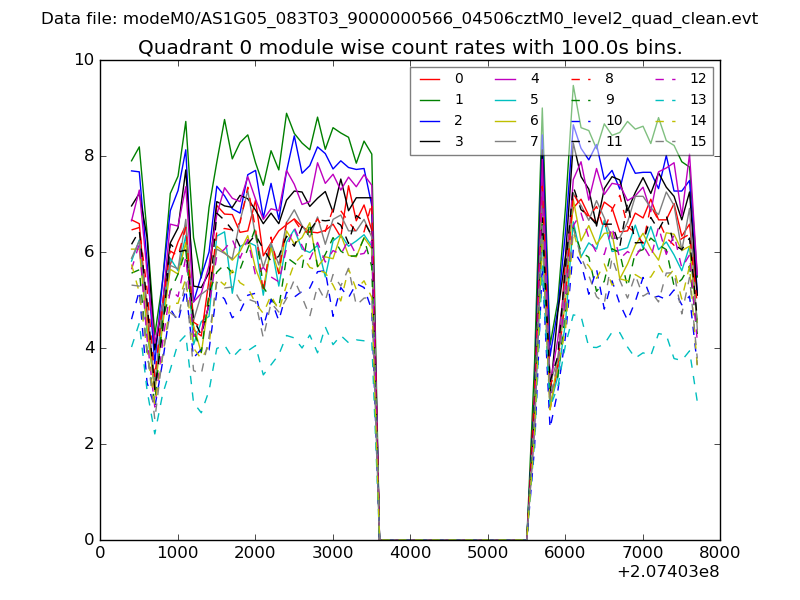 |
 |
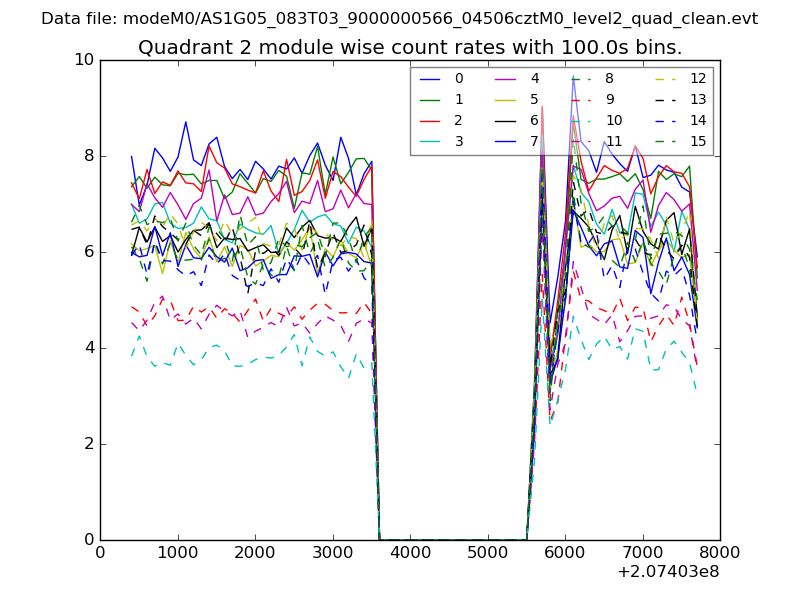
| Module-wise count rates for Quadrant B Data is divided into 100 sec bins |
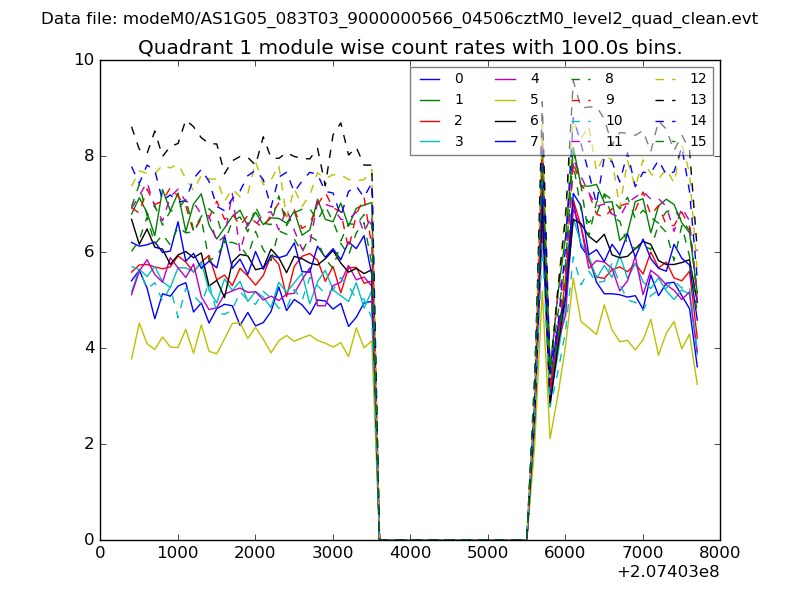 |
 |
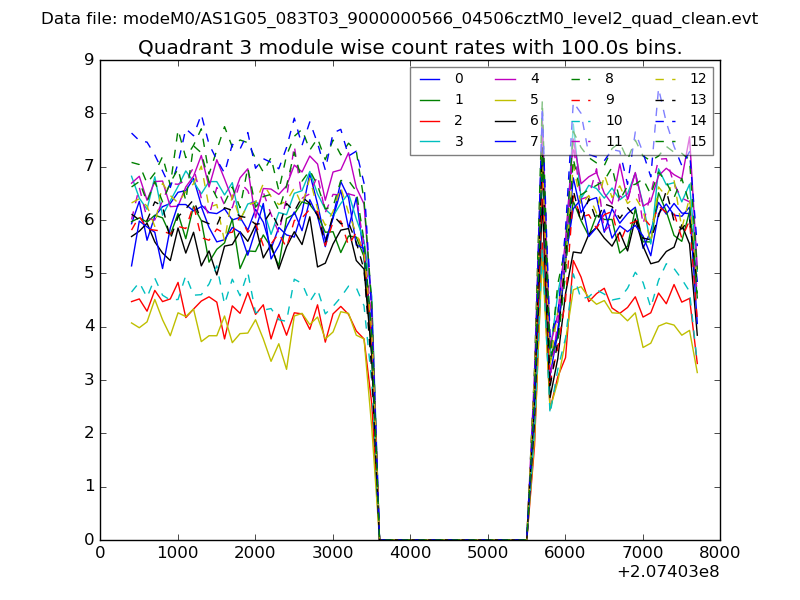
| Module-wise count rates for Quadrant C Data is divided into 100 sec bins |
 |
 |
| Module-wise count rates for Quadrant D Data is divided into 100 sec bins |
 |
 |
| Parameter | Plot |
|---|---|
| CZT HV Monitor | 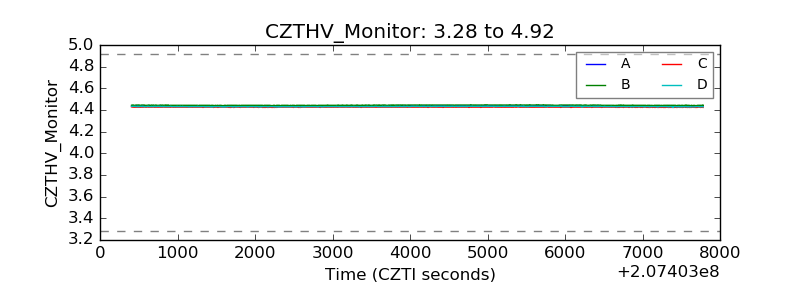 |
| D_VDD | 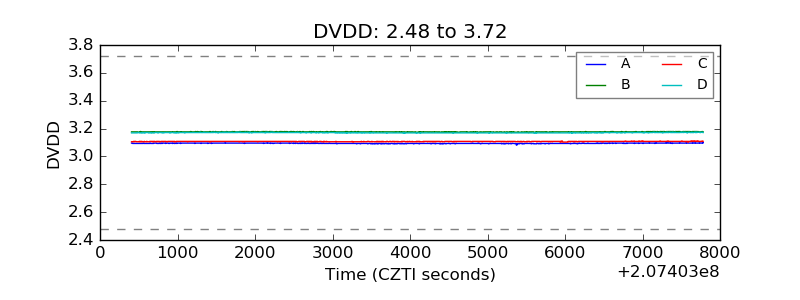 |
| Temperature 1 | 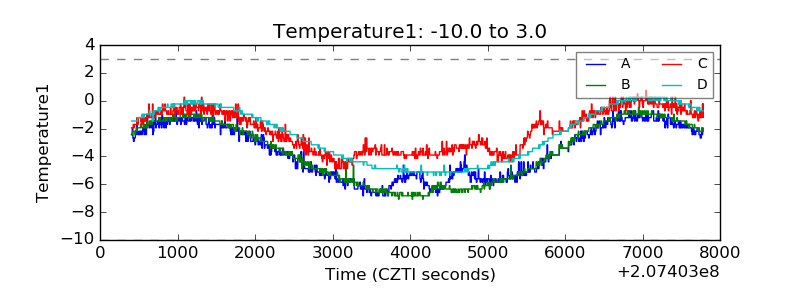 |
| Veto HV Monitor | 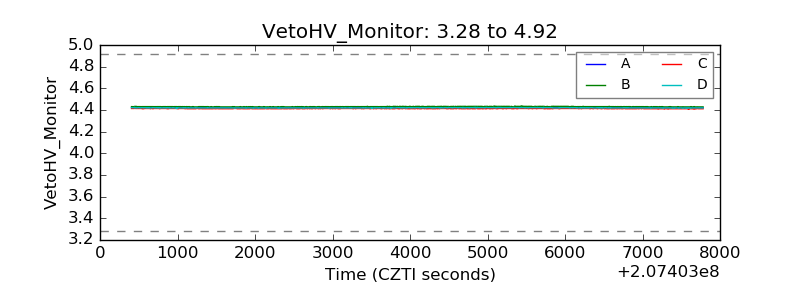 |
| Veto LLD | 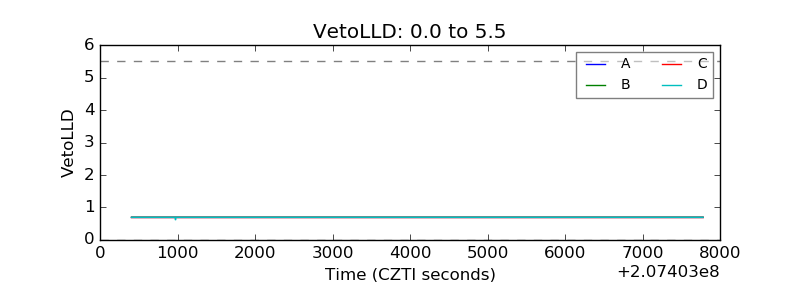 |
| Alpha Counter | 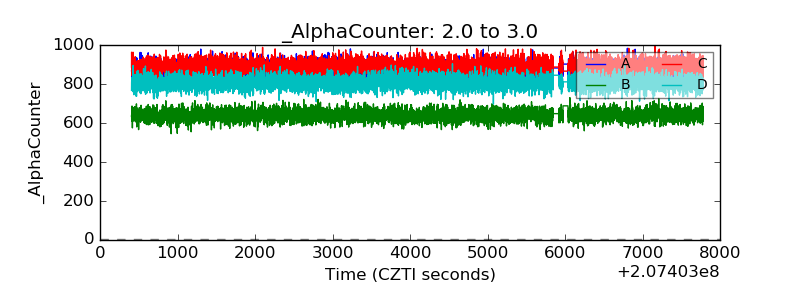 |
| _CPM_Rate | 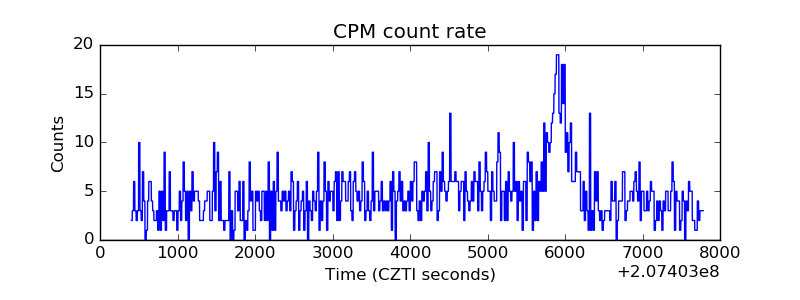 |
| CZT Counter | 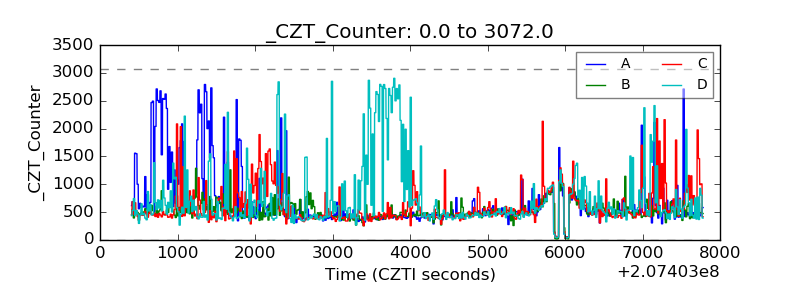 |
| +2.5 Volts monitor |  |
| +5 Volts monitor |  |
| _ROLL_ROT | 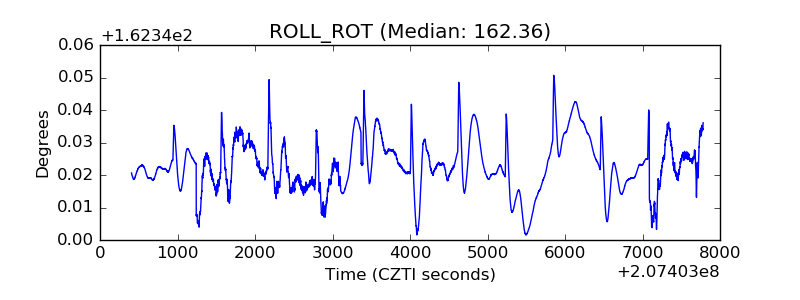 |
| _Roll_DEC | 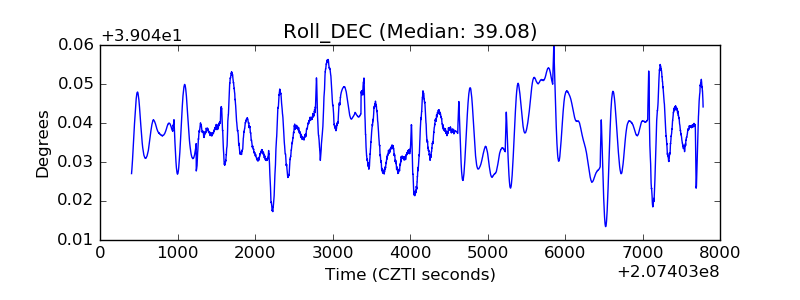 |
| _Roll_RA | 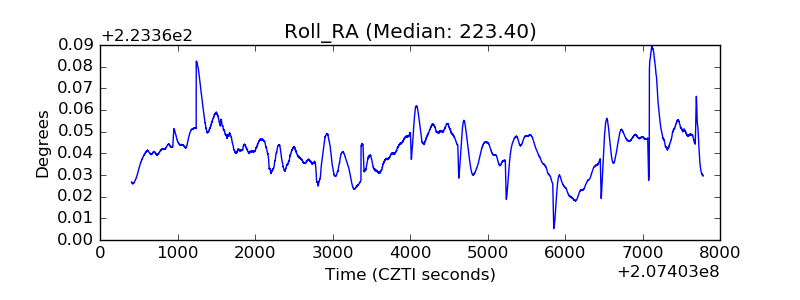 |
| Veto Counter | 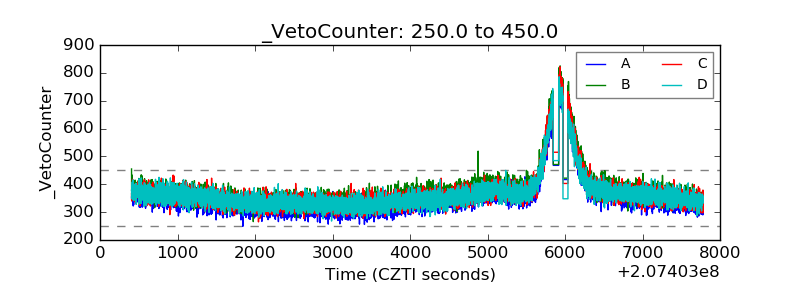 |