| Param | Original file | Final file |
|---|---|---|
| Filename | modeM0/AS1G05_083T03_9000000566_04510cztM0_level2.evt | modeM0/AS1G05_083T03_9000000566_04510cztM0_level2_quad_clean.evt |
| Size (bytes) | 9,218,880 | 2,531,520 |
| Size | 8.8 MB | 2.4 MB |
| Events in quadrant A | 62,736 | 13,892 |
| Events in quadrant B | 73,148 | 15,190 |
| Events in quadrant C | 57,545 | 13,837 |
| Events in quadrant D | 72,758 | 15,233 |
| Mode SS | |||
|---|---|---|---|
| Quadrant | BADHDUFLAG | Total packets | Discarded packets |
| A | 0 | 126 | 122 |
| B | 0 | 130 | 126 |
| C | 0 | 130 | 130 |
| D | 0 | 128 | 124 |
| Mode M0 | |||
|---|---|---|---|
| Quadrant | BADHDUFLAG | Total packets | Discarded packets |
| A | 0 | 14478 | 14199 |
| B | 0 | 13655 | 13338 |
| C | 0 | 12881 | 12604 |
| D | 0 | 16058 | 15741 |
| Mode M9 | |||
|---|---|---|---|
| Quadrant | BADHDUFLAG | Total packets | Discarded packets |
| A | 0 | 5 | 5 |
| B | 0 | 6 | 6 |
| C | 0 | 4 | 4 |
| D | 0 | 6 | 6 |
| Quadrant | Total seconds | Saturated seconds | Saturation percentage |
|---|---|---|---|
| A | 137 | 0 | 0.000000% |
| B | 154 | 0 | 0.000000% |
| C | 139 | 0 | 0.000000% |
| D | 152 | 0 | 0.000000% |
Noise dominated data is calculated using 1-second bins in cleaned event files. If a bin has >2000 counts, and if more than 50% of those come from <1% of pixels, then it is considered to be noise-dominated and hence unusable.
| Quadrant | # 1 sec bins | Bins with >0 counts | Bins with >2000 counts | High rate bins dominated by noise | Noise dominated (total time) | Noise dominated (detector-on time) | Marked lightcurve |
|---|---|---|---|---|---|---|---|
| A | 7640 | 252 | 0 | 0 | 0.00% | 0.00% | 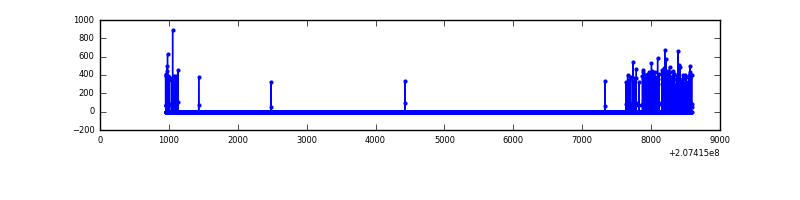 |
| B | 7657 | 282 | 0 | 0 | 0.00% | 0.00% | 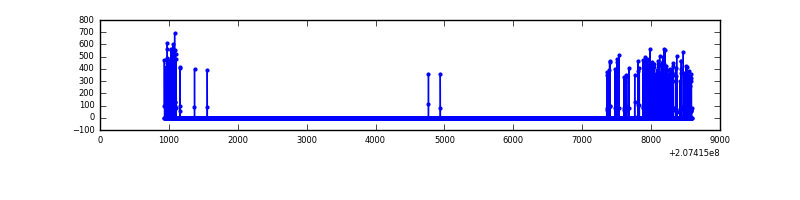 |
| C | 7610 | 255 | 0 | 0 | 0.00% | 0.00% | 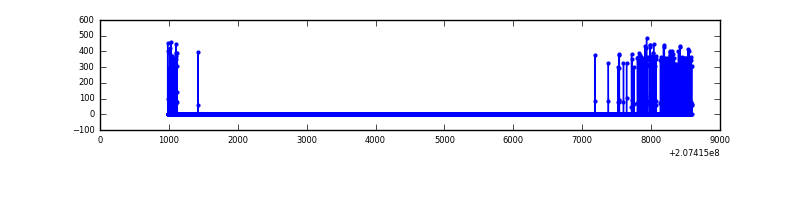 |
| D | 7654 | 291 | 0 | 0 | 0.00% | 0.00% | 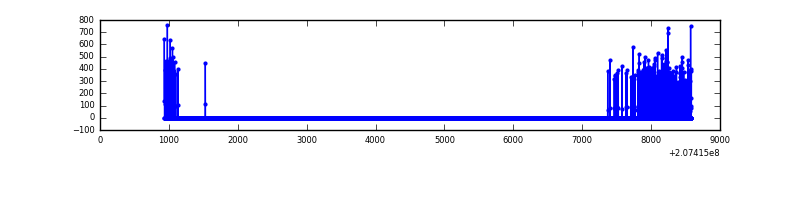 |
Top three noisy pixels from each quadrant. If the there are fewer than three noisy pixels in the level2.evt file, extra rows are filled as -1
| Pixel properties | Quadrant properties | ||||||
|---|---|---|---|---|---|---|---|
| Quadrant | DetID | PixID | Counts | Sigma | Mean | Median | Sigma |
| A | 0 | 118 | 3274 | 668.8 | 14 | 14 | 4.9 |
| A | 0 | 13 | 1715 | 348.97 | 14 | 14 | 4.9 |
| A | 0 | 50 | 847 | 170.89 | 14 | 14 | 4.9 |
| B | 15 | 204 | 4527 | 864.92 | 16 | 16 | 5.2 |
| B | 8 | 3 | 1868 | 355.09 | 16 | 16 | 5.2 |
| B | 14 | 167 | 838 | 157.61 | 16 | 16 | 5.2 |
| C | 14 | 48 | 365 | 69.82 | 14 | 14 | 5.0 |
| C | 9 | 16 | 235 | 43.96 | 14 | 14 | 5.0 |
| C | 13 | 61 | 121 | 21.28 | 14 | 14 | 5.0 |
| D | 11 | 132 | 4400 | 788.47 | 16 | 15 | 5.6 |
| D | 14 | 34 | 2101 | 375.08 | 16 | 15 | 5.6 |
| D | 2 | 63 | 1348 | 239.69 | 16 | 15 | 5.6 |
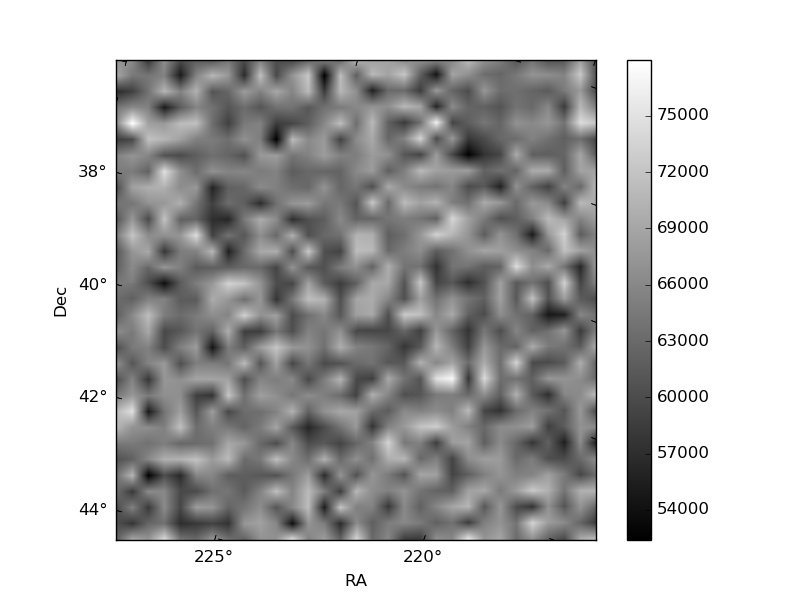
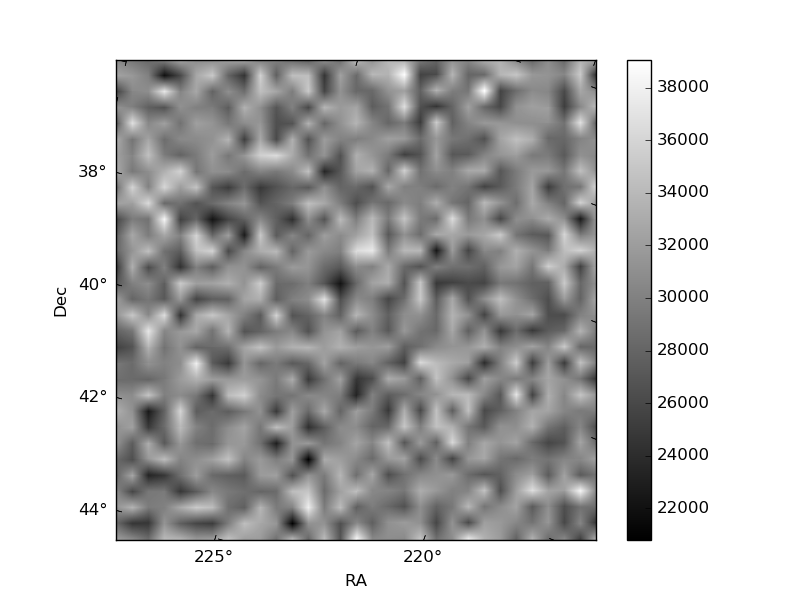
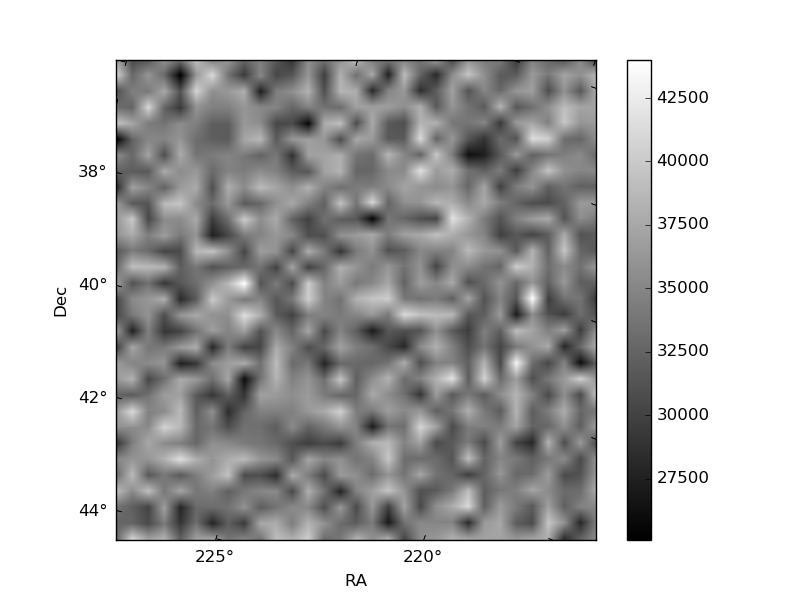
Histogram calculated using DETX and DETY for each event in the final _common_clean file
| Quadrant A | 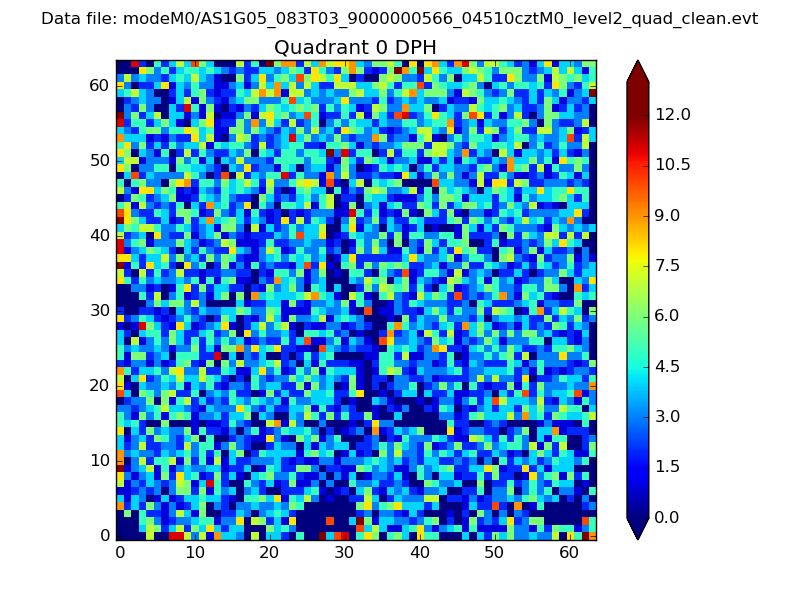 |
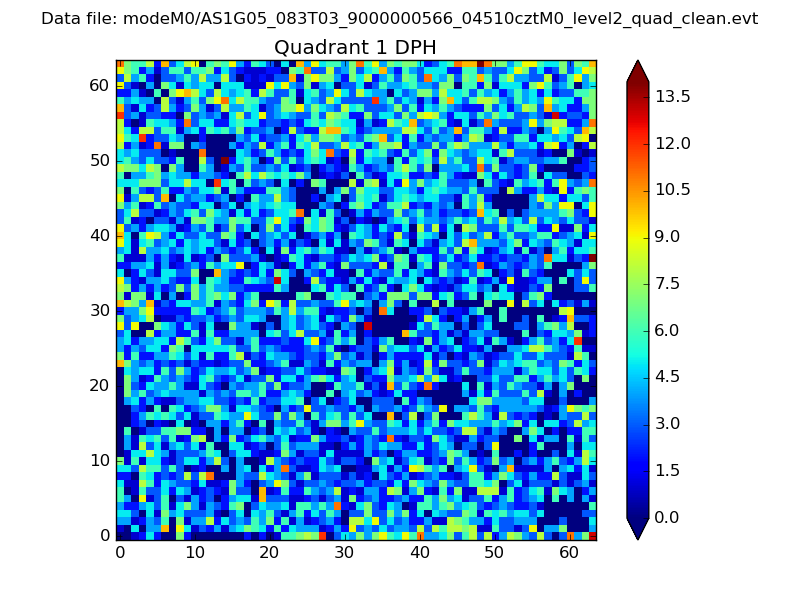 |
Quadrant B |
|---|---|---|---|
| Quadrant D | 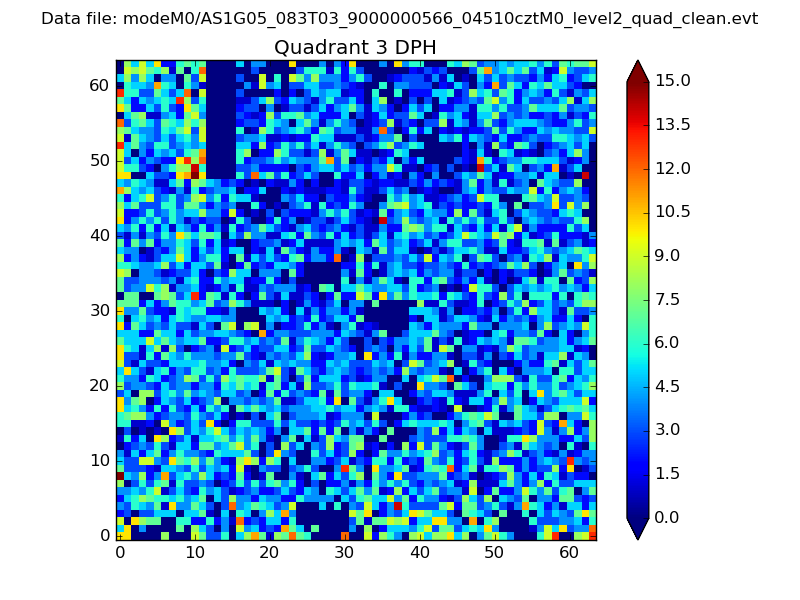 |
 |
Quadrant C |
| Plot type | Count rate plots | Images |
|---|---|---|
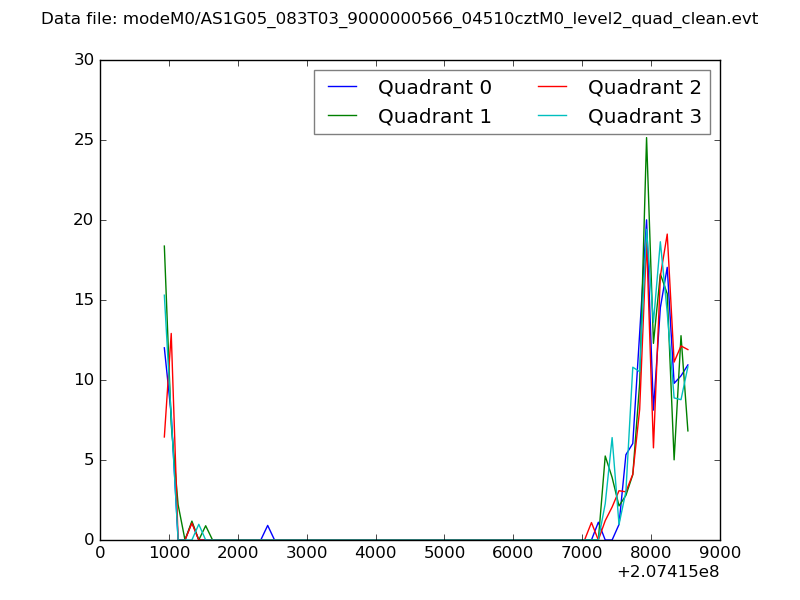
| Comparison with Poisson distribution Blue bars denote a histogram of data divided into 1 sec bins. Red curve is a Poisson curve with rate = median count rate of data. |
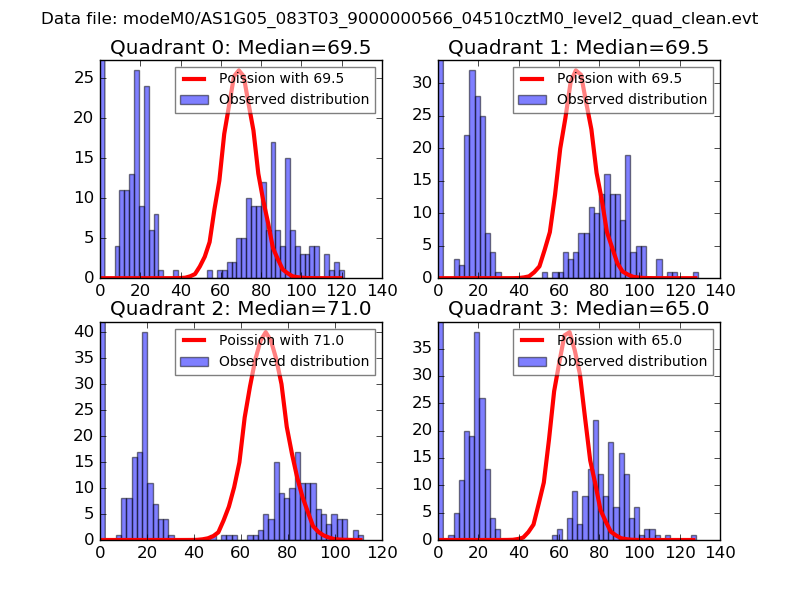 |
 |
| Quadrant-wise count rates Data is divided into 100 sec bins |
 |
|
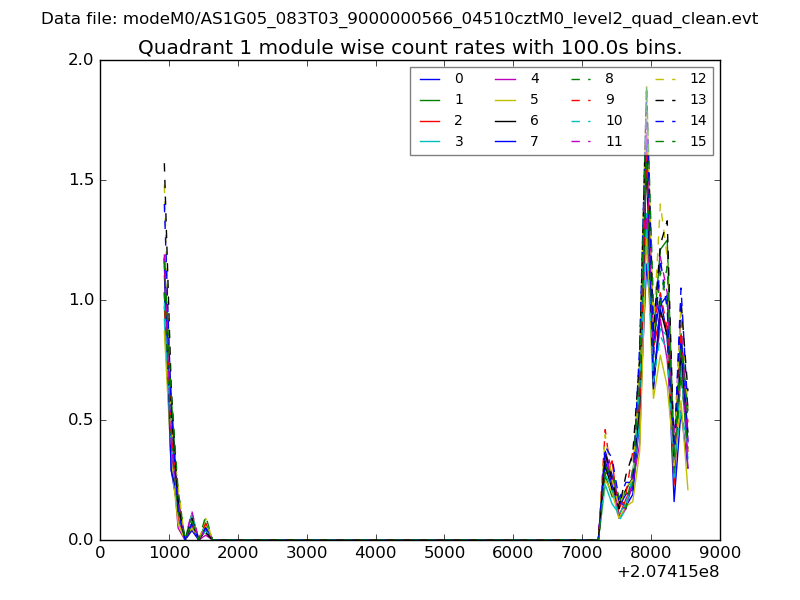
| Module-wise count rates for Quadrant A Data is divided into 100 sec bins |
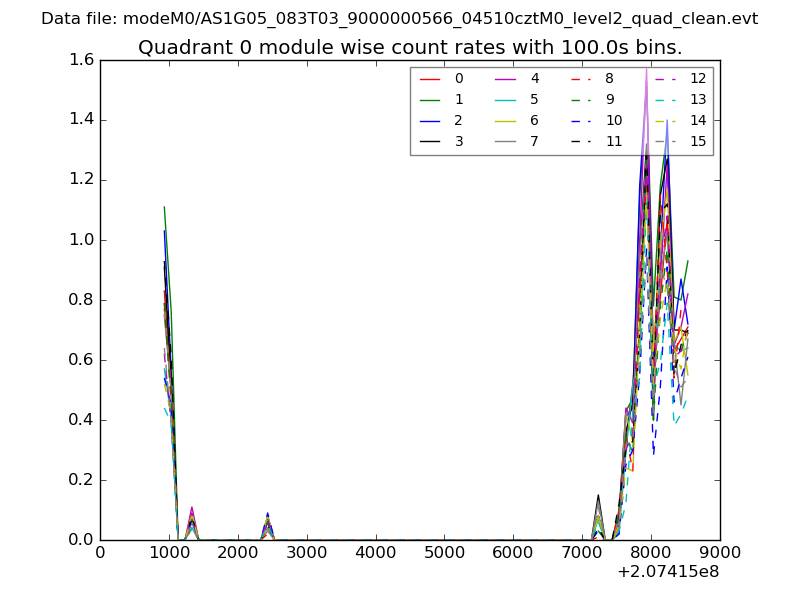 |
 |
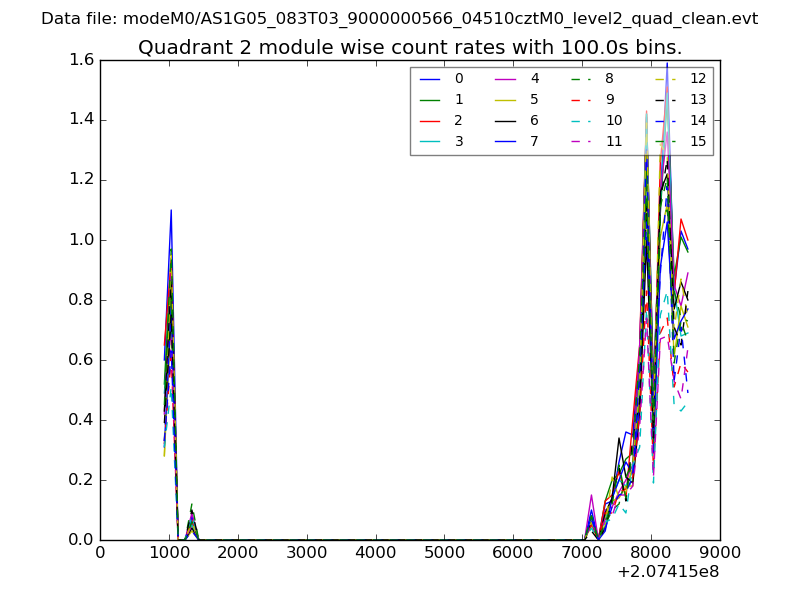
| Module-wise count rates for Quadrant B Data is divided into 100 sec bins |
 |
 |
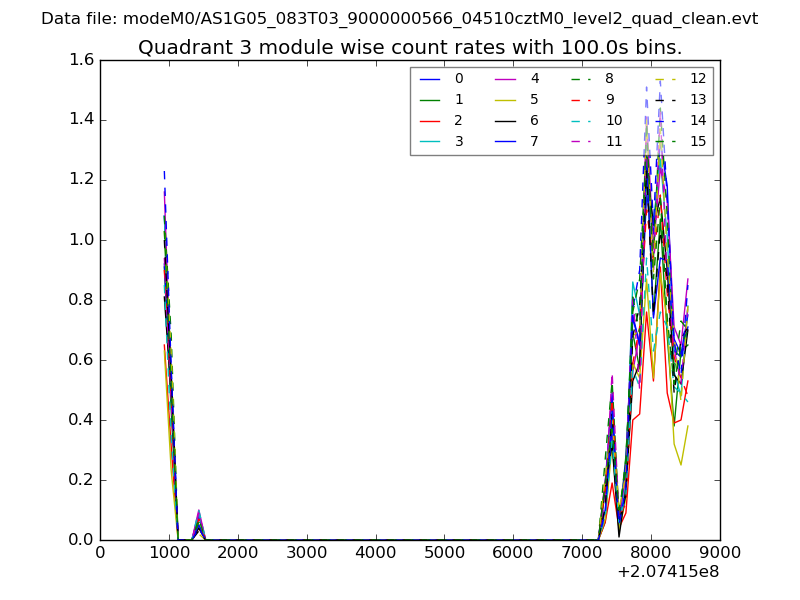
| Module-wise count rates for Quadrant C Data is divided into 100 sec bins |
 |
 |
| Module-wise count rates for Quadrant D Data is divided into 100 sec bins |
 |
 |
| Parameter | Plot |
|---|---|
| CZT HV Monitor | 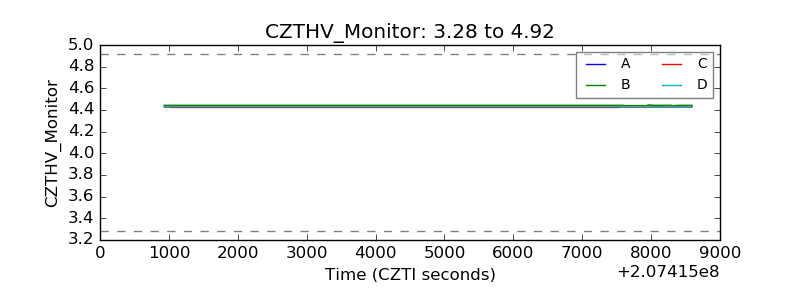 |
| D_VDD | 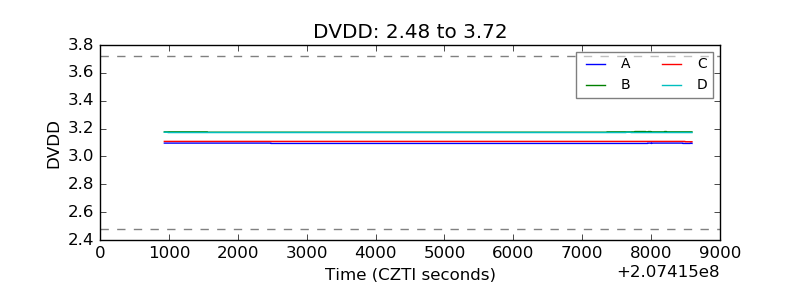 |
| Temperature 1 | 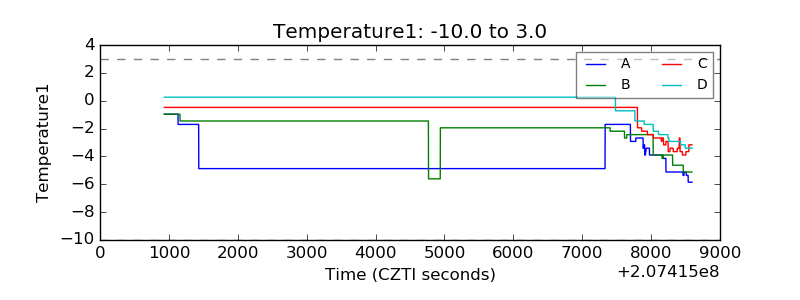 |
| Veto HV Monitor | 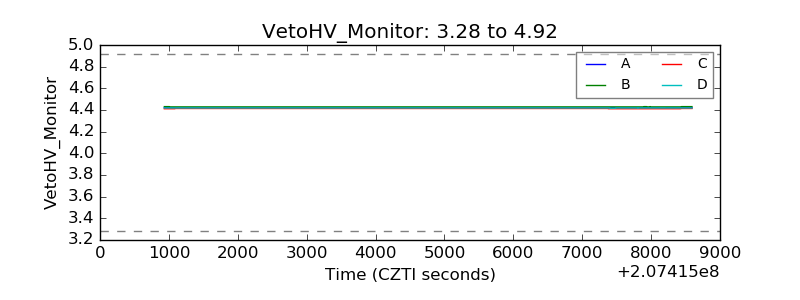 |
| Veto LLD | 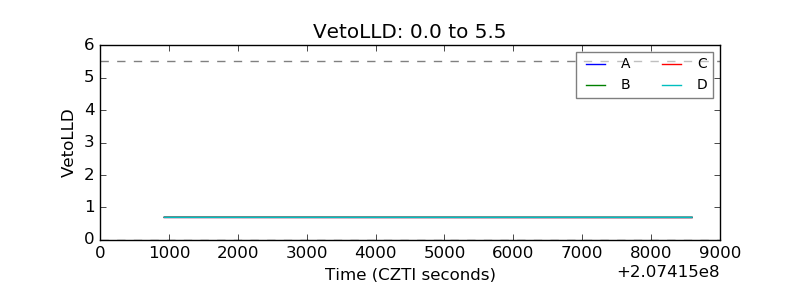 |
| Alpha Counter | 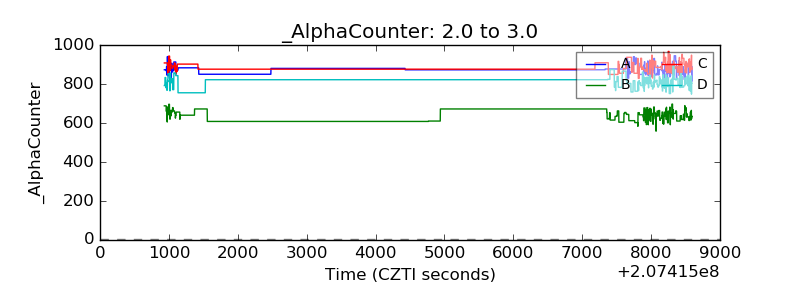 |
| _CPM_Rate | 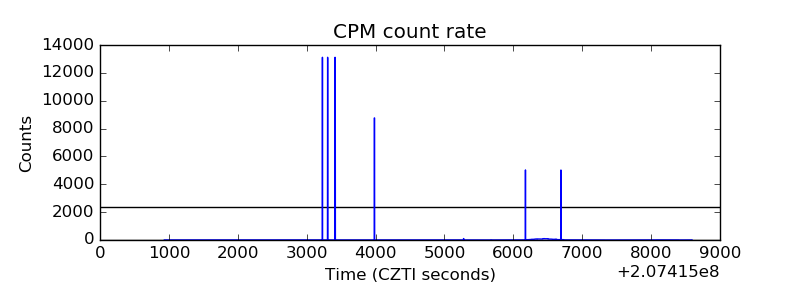 |
| CZT Counter | 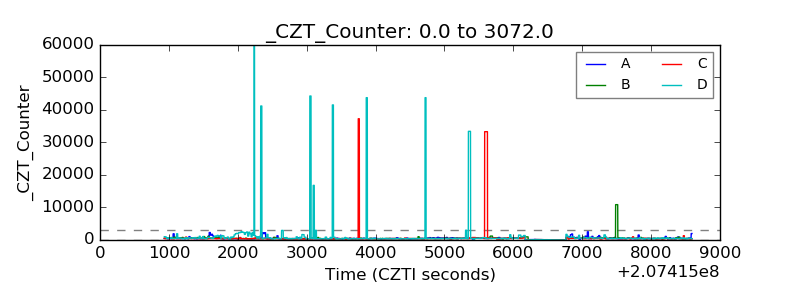 |
| +2.5 Volts monitor |  |
| +5 Volts monitor |  |
| _ROLL_ROT | 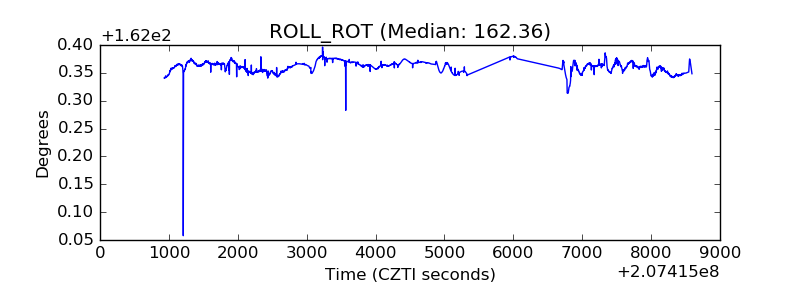 |
| _Roll_DEC | 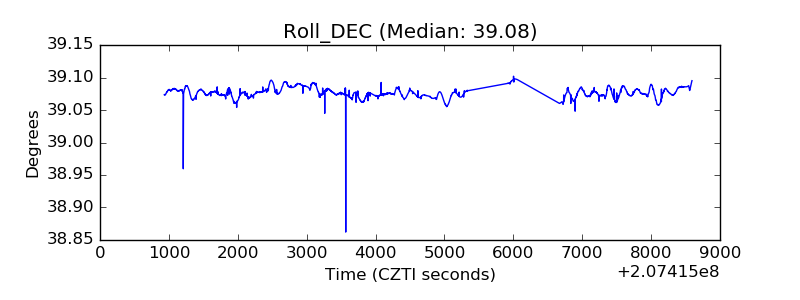 |
| _Roll_RA | 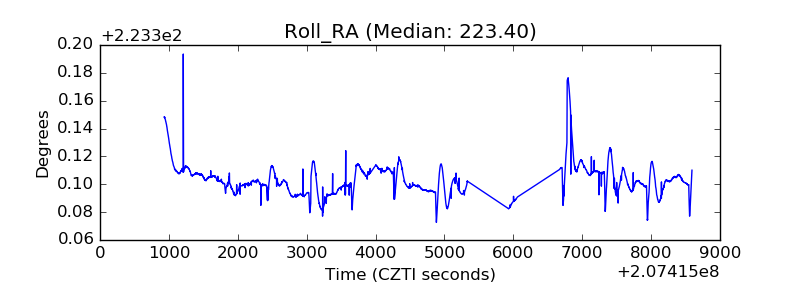 |
| Veto Counter | 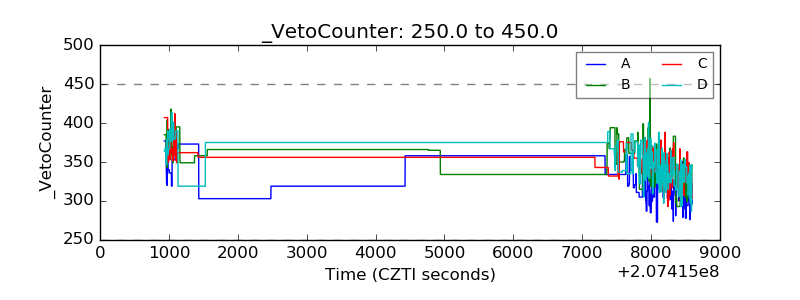 |