| Param | Original file | Final file |
|---|---|---|
| Filename | modeM0/AS1G05_083T03_9000000566_04514cztM0_level2.evt | modeM0/AS1G05_083T03_9000000566_04514cztM0_level2_quad_clean.evt |
| Size (bytes) | 436,256,640 | 69,402,240 |
| Size | 416.0 MB | 66.2 MB |
| Events in quadrant A | 3,229,355 | 422,829 |
| Events in quadrant B | 3,038,133 | 419,431 |
| Events in quadrant C | 2,713,385 | 422,010 |
| Events in quadrant D | 3,807,629 | 402,296 |
| Mode SS | |||
|---|---|---|---|
| Quadrant | BADHDUFLAG | Total packets | Discarded packets |
| A | 0 | 126 | 0 |
| B | 0 | 126 | 0 |
| C | 0 | 126 | 0 |
| D | 0 | 126 | 0 |
| Mode M0 | |||
|---|---|---|---|
| Quadrant | BADHDUFLAG | Total packets | Discarded packets |
| A | 0 | 13948 | 1 |
| B | 0 | 13275 | 1 |
| C | 0 | 12674 | 1 |
| D | 0 | 15737 | 1 |
| Mode M9 | |||
|---|---|---|---|
| Quadrant | BADHDUFLAG | Total packets | Discarded packets |
| A | 0 | 6 | 0 |
| B | 0 | 6 | 0 |
| C | 0 | 6 | 0 |
| D | 0 | 6 | 0 |
| Quadrant | Total seconds | Saturated seconds | Saturation percentage |
|---|---|---|---|
| A | 6232 | 102 | 1.636714% |
| B | 6232 | 23 | 0.369063% |
| C | 6232 | 8 | 0.128370% |
| D | 6232 | 262 | 4.204108% |
Noise dominated data is calculated using 1-second bins in cleaned event files. If a bin has >2000 counts, and if more than 50% of those come from <1% of pixels, then it is considered to be noise-dominated and hence unusable.
| Quadrant | # 1 sec bins | Bins with >0 counts | Bins with >2000 counts | High rate bins dominated by noise | Noise dominated (total time) | Noise dominated (detector-on time) | Marked lightcurve |
|---|---|---|---|---|---|---|---|
| A | 6817 | 6233 | 52 | 52 | 0.76% | 0.83% | 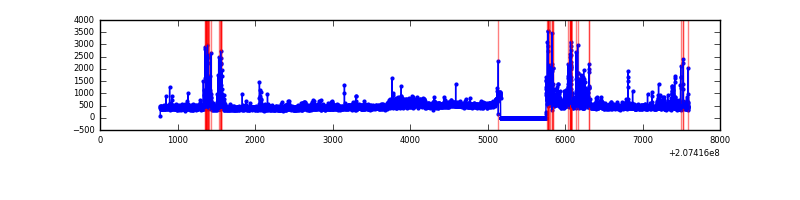 |
| B | 6817 | 6233 | 5 | 5 | 0.07% | 0.08% | 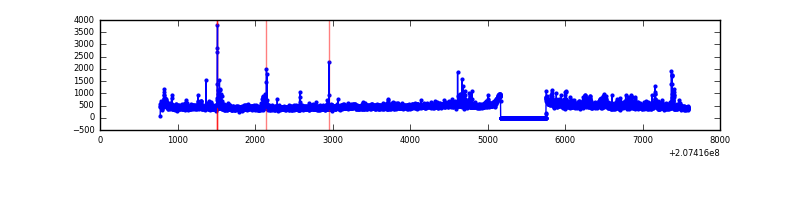 |
| C | 6817 | 6233 | 1 | 1 | 0.01% | 0.02% | 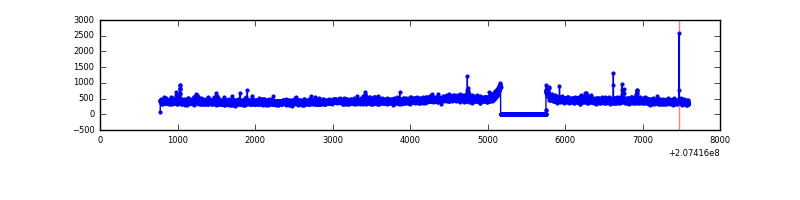 |
| D | 6817 | 6233 | 207 | 207 | 3.04% | 3.32% | 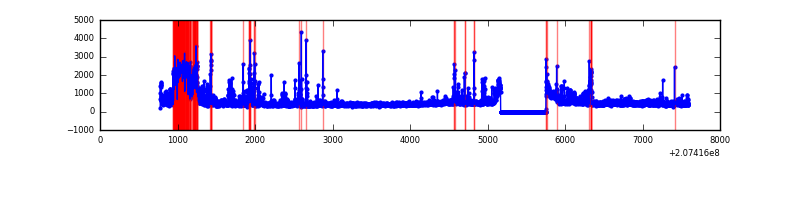 |
Top three noisy pixels from each quadrant. If the there are fewer than three noisy pixels in the level2.evt file, extra rows are filled as -1
| Pixel properties | Quadrant properties | ||||||
|---|---|---|---|---|---|---|---|
| Quadrant | DetID | PixID | Counts | Sigma | Mean | Median | Sigma |
| A | 0 | 13 | 278085 | 1920.96 | 696 | 680 | 144.4 |
| A | 0 | 118 | 128959 | 888.3 | 696 | 680 | 144.4 |
| A | 0 | 50 | 68112 | 466.95 | 696 | 680 | 144.4 |
| B | 15 | 204 | 110950 | 803.28 | 705 | 688 | 137.3 |
| B | 10 | 246 | 37859 | 270.8 | 705 | 688 | 137.3 |
| B | 4 | 48 | 37044 | 264.86 | 705 | 688 | 137.3 |
| C | 9 | 247 | 18661 | 112.33 | 682 | 686 | 160.0 |
| C | 14 | 48 | 14864 | 88.6 | 682 | 686 | 160.0 |
| C | 9 | 54 | 6917 | 38.94 | 682 | 686 | 160.0 |
| D | 9 | 35 | 587947 | 3583.03 | 671 | 652 | 163.9 |
| D | 11 | 132 | 259704 | 1580.45 | 671 | 652 | 163.9 |
| D | 13 | 235 | 96234 | 583.14 | 671 | 652 | 163.9 |
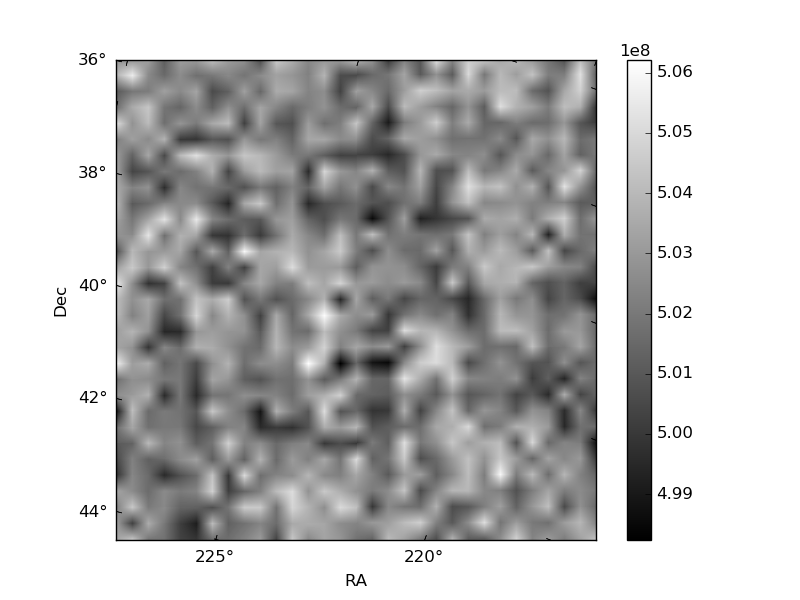
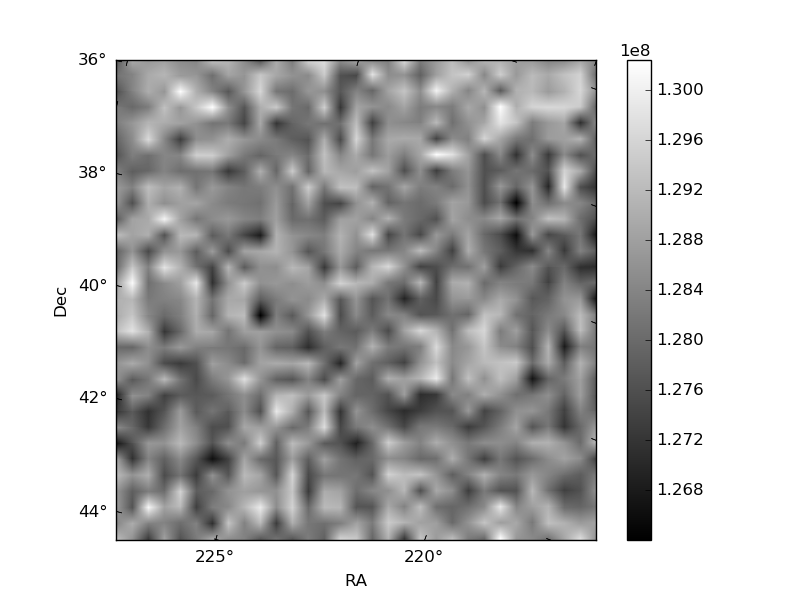
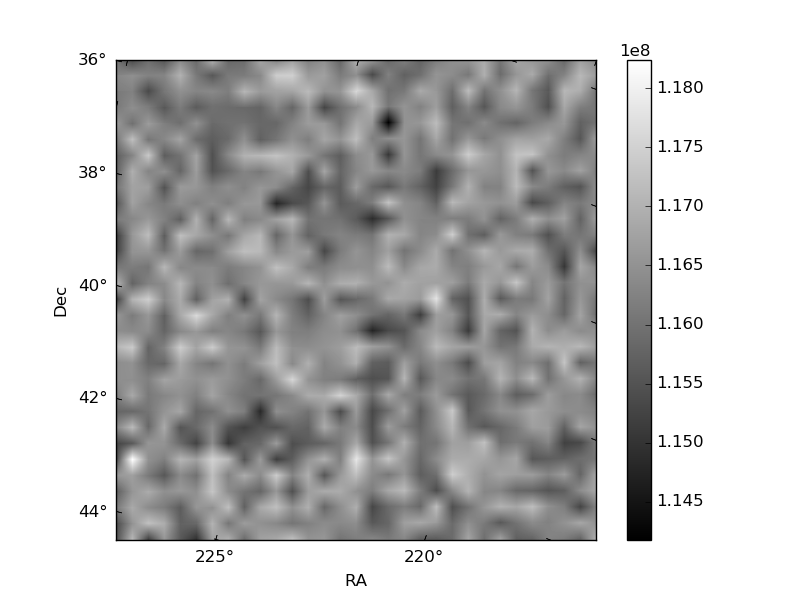
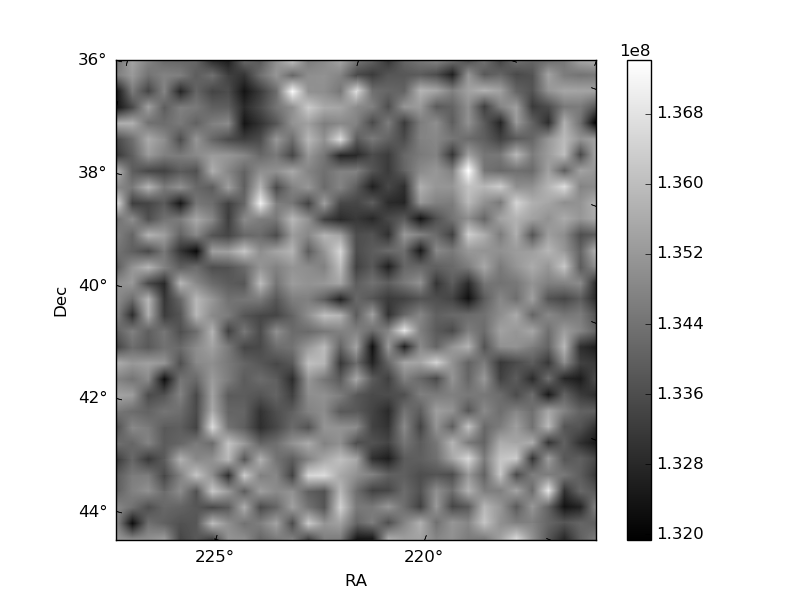
Histogram calculated using DETX and DETY for each event in the final _common_clean file
| Quadrant A | 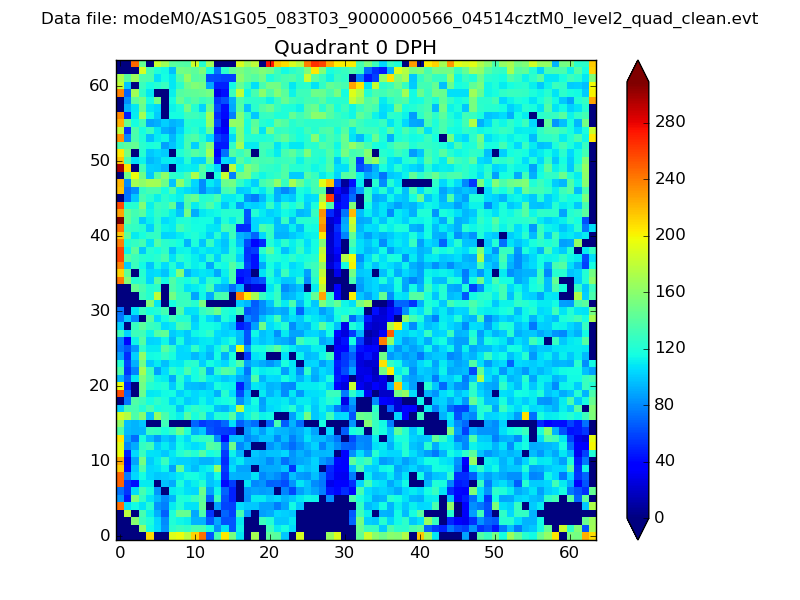 |
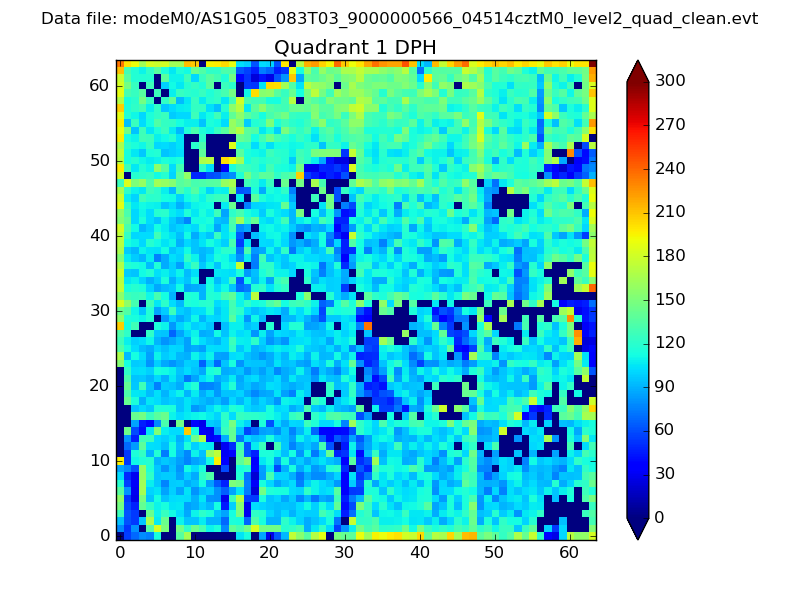 |
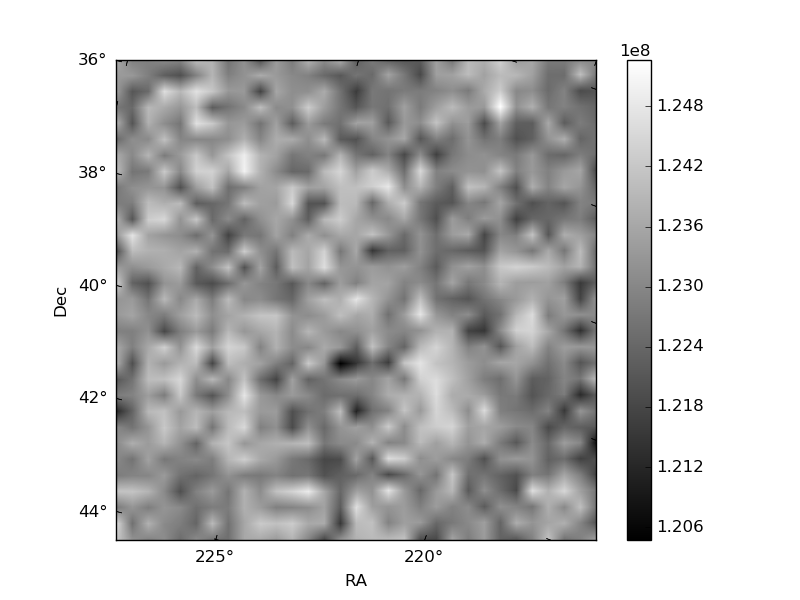
Quadrant B |
|---|---|---|---|
| Quadrant D | 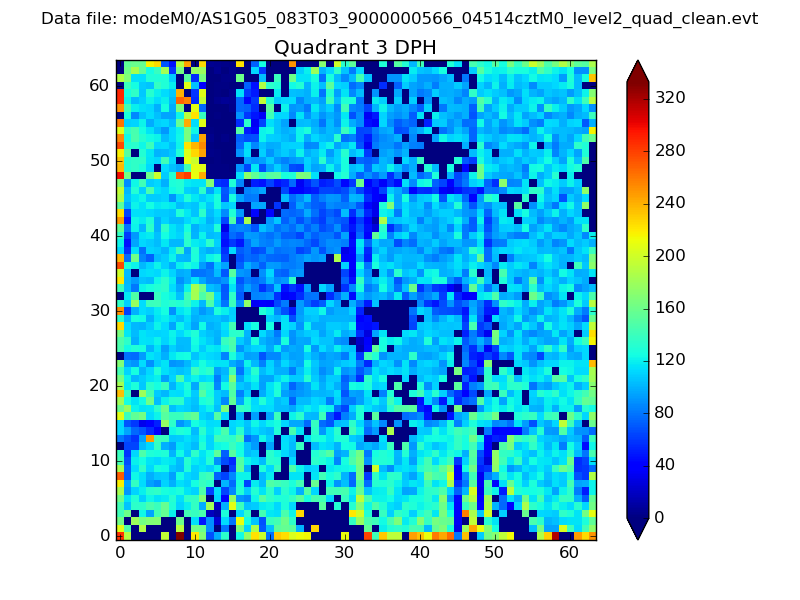 |
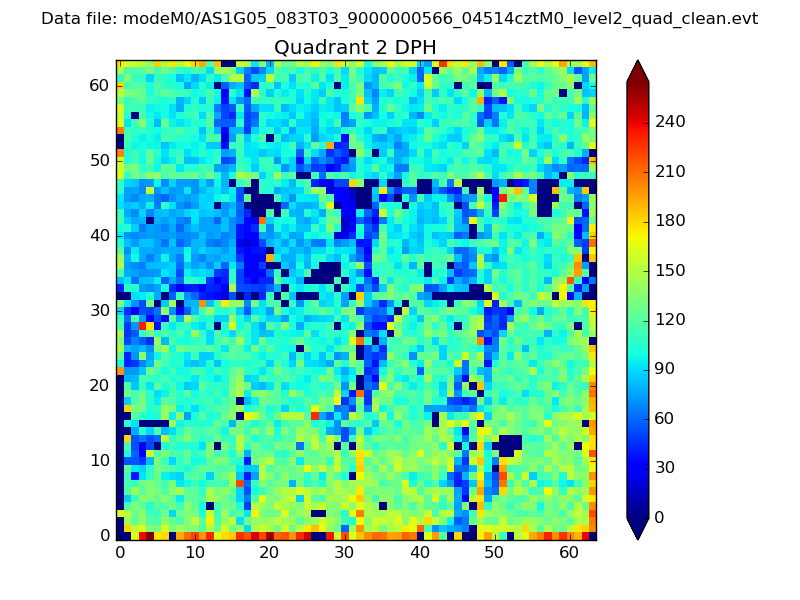 |
Quadrant C |
| Plot type | Count rate plots | Images |
|---|---|---|
| Comparison with Poisson distribution Blue bars denote a histogram of data divided into 1 sec bins. Red curve is a Poisson curve with rate = median count rate of data. |
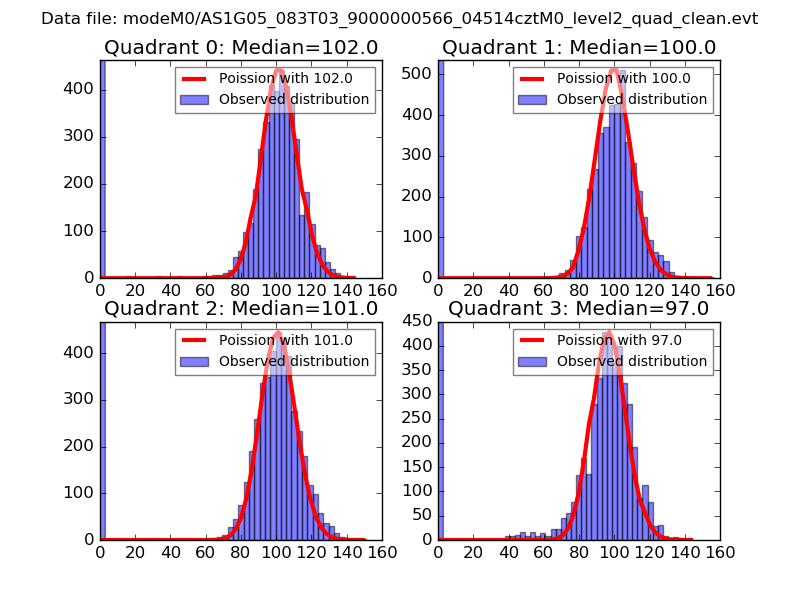 |
 |
| Quadrant-wise count rates Data is divided into 100 sec bins |
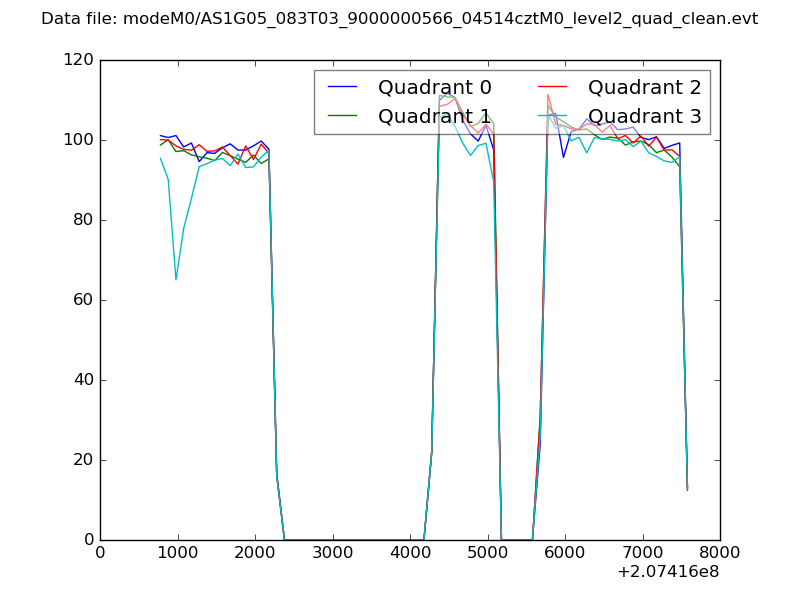 |
|
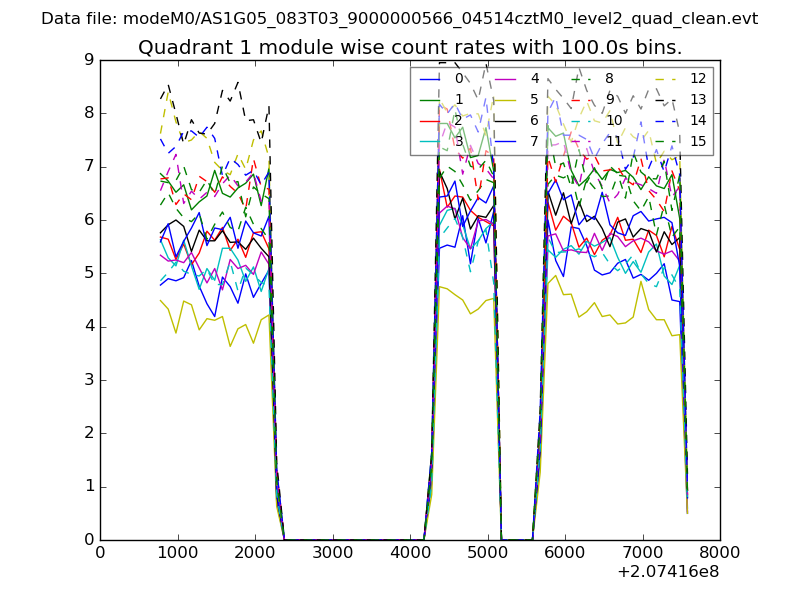
| Module-wise count rates for Quadrant A Data is divided into 100 sec bins |
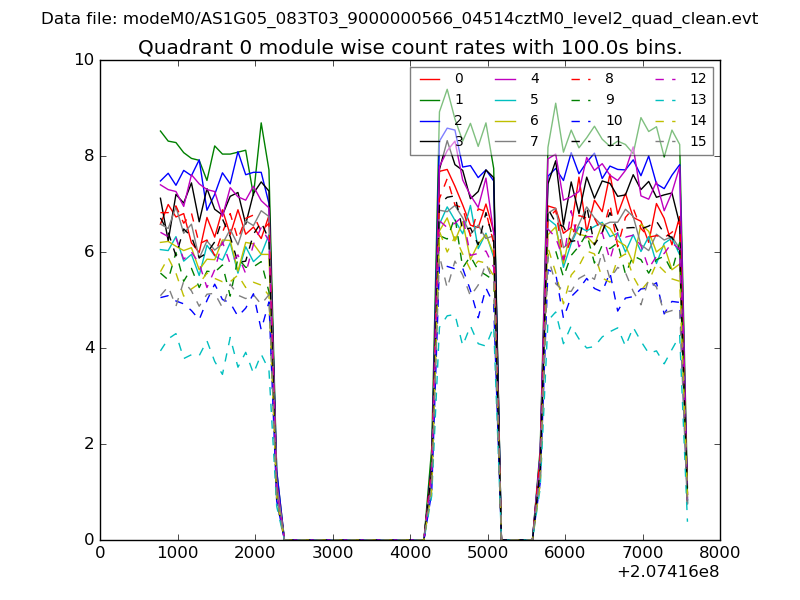 |
 |
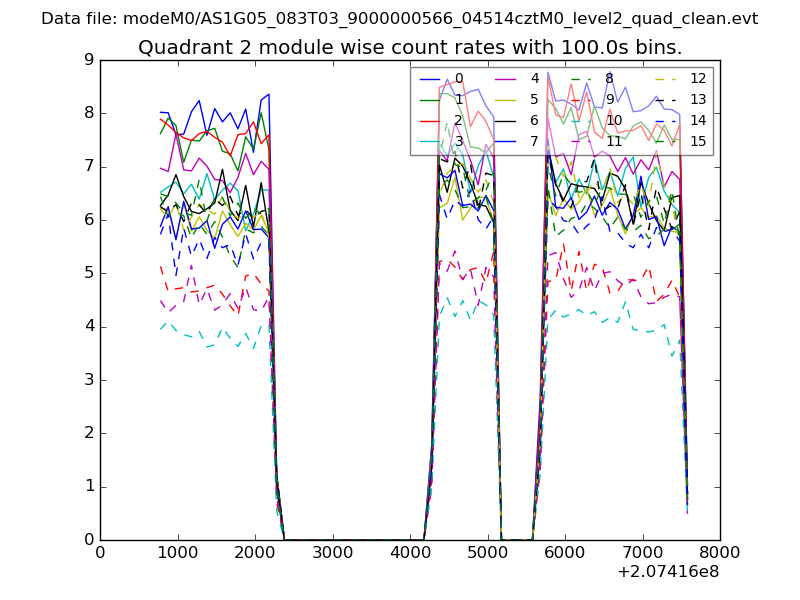
| Module-wise count rates for Quadrant B Data is divided into 100 sec bins |
 |
 |
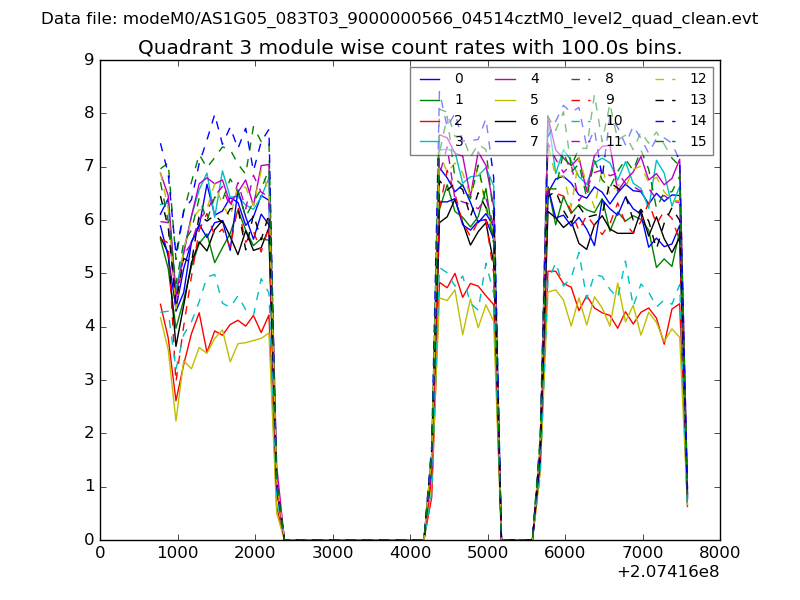
| Module-wise count rates for Quadrant C Data is divided into 100 sec bins |
 |
 |
| Module-wise count rates for Quadrant D Data is divided into 100 sec bins |
 |
 |
| Parameter | Plot |
|---|---|
| CZT HV Monitor | 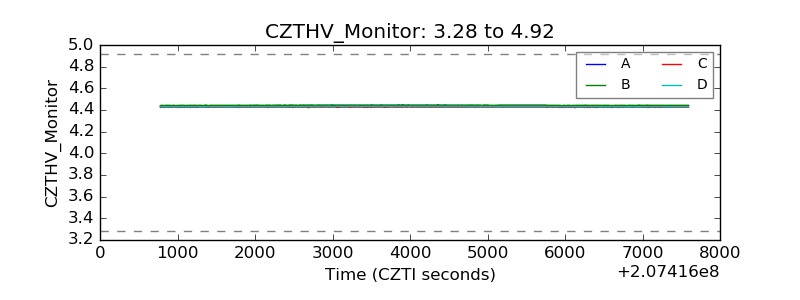 |
| D_VDD | 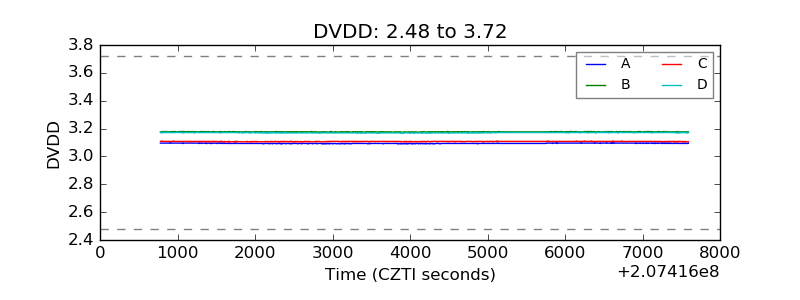 |
| Temperature 1 | 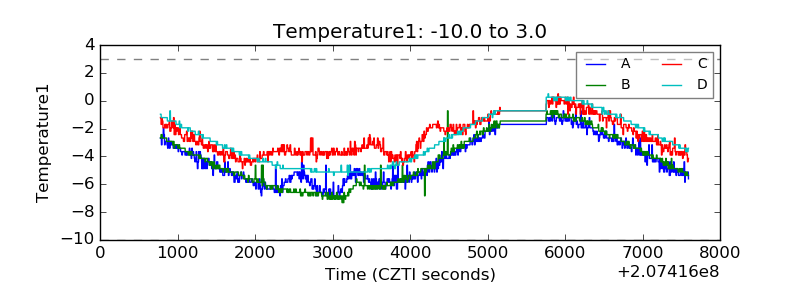 |
| Veto HV Monitor | 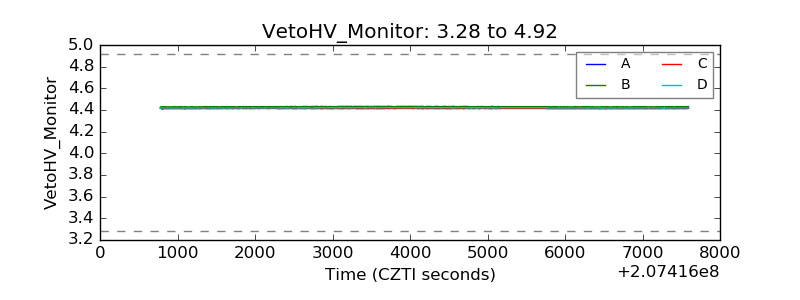 |
| Veto LLD | 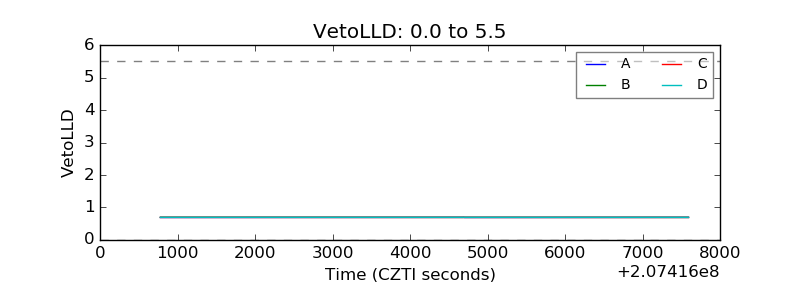 |
| Alpha Counter | 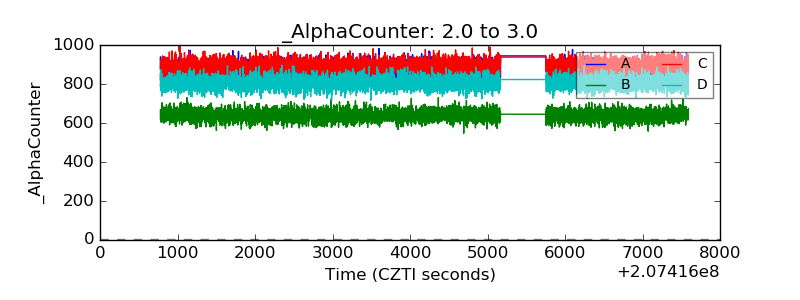 |
| _CPM_Rate | 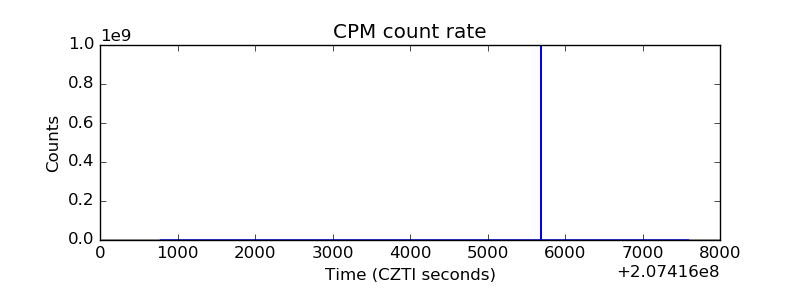 |
| CZT Counter | 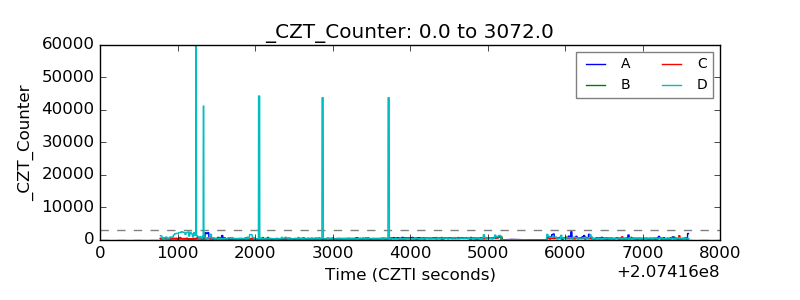 |
| +2.5 Volts monitor |  |
| +5 Volts monitor |  |
| _ROLL_ROT | 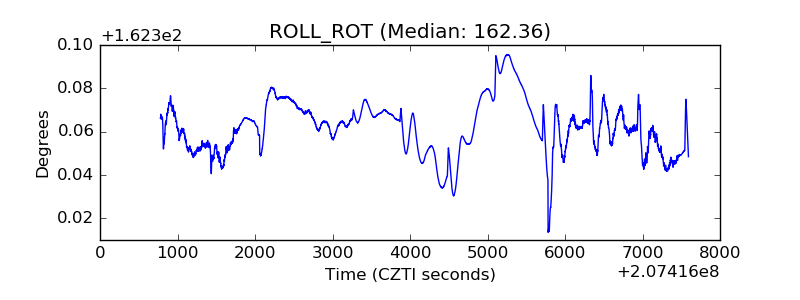 |
| _Roll_DEC | 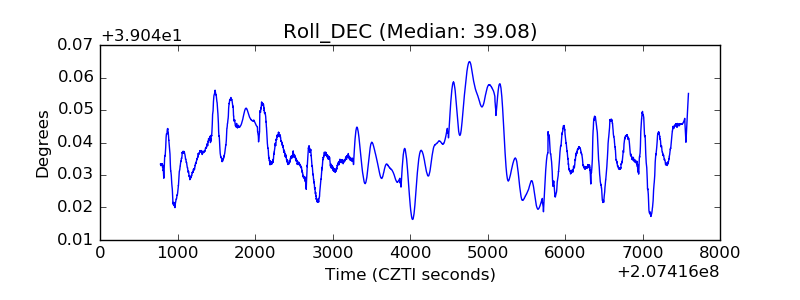 |
| _Roll_RA |  |
| Veto Counter | 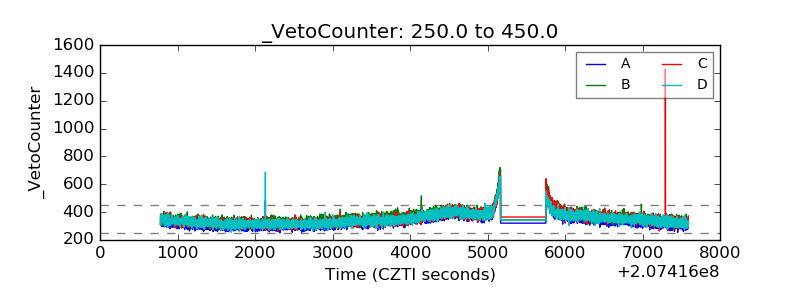 |