| Param | Original file | Final file |
|---|---|---|
| Filename | modeM0/AS1G05_250T01_9000000568cztM0_level2.fits | modeM0/AS1G05_250T01_9000000568cztM0_level2_quad_clean.evt |
| Size (bytes) | 1,396,278,720 | 1,506,510,720 |
| Size | 1.3 GB | 1.4 GB |
| Events in quadrant A | 7,920,956 | 8,539,798 |
| Events in quadrant B | 8,185,100 | 9,287,328 |
| Events in quadrant C | 8,307,200 | 8,851,442 |
| Events in quadrant D | 7,086,830 | 8,173,046 |
| Mode M0 | |||
|---|---|---|---|
| Quadrant | BADHDUFLAG | Total packets | Discarded packets |
| A | 0 | 467438 | 0 |
| B | 0 | 333380 | 0 |
| C | 0 | 331627 | 0 |
| D | 0 | 364910 | 0 |
| Mode SS | |||
|---|---|---|---|
| Quadrant | BADHDUFLAG | Total packets | Discarded packets |
| A | 0 | 3216 | 0 |
| B | 0 | 3218 | 0 |
| C | 0 | 3228 | 0 |
| D | 0 | 3230 | 0 |
| Mode M9 | |||
|---|---|---|---|
| Quadrant | BADHDUFLAG | Total packets | Discarded packets |
| A | 0 | 247 | 0 |
| B | 0 | 244 | 0 |
| C | 0 | 246 | 0 |
| D | 0 | 248 | 0 |
| Quadrant | Total seconds | Saturated seconds | Saturation percentage |
|---|---|---|---|
| A | 156802 | 17592 | 11.219245% |
| B | 157423 | 2541 | 1.614122% |
| C | 157437 | 2141 | 1.359909% |
| D | 157079 | 3567 | 2.270832% |
Noise dominated data is calculated using 1-second bins in cleaned event files. If a bin has >2000 counts, and if more than 50% of those come from <1% of pixels, then it is considered to be noise-dominated and hence unusable.
| Quadrant | # 1 sec bins | Bins with >0 counts | Bins with >2000 counts | High rate bins dominated by noise | Noise dominated (total time) | Noise dominated (detector-on time) | Marked lightcurve |
|---|---|---|---|---|---|---|---|
| A | 202082 | 157682 | 0 | 0 | 0.00% | 0.00% |  |
| B | 202082 | 158664 | 0 | 0 | 0.00% | 0.00% | 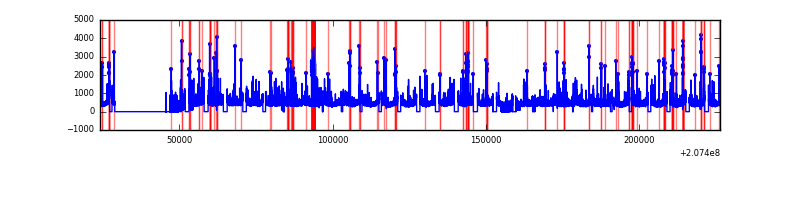 |
| C | 202082 | 158637 | 0 | 0 | 0.00% | 0.00% |  |
| D | 202082 | 158330 | 0 | 0 | 0.00% | 0.00% |  |
Top three noisy pixels from each quadrant. If the there are fewer than three noisy pixels in the level2.evt file, extra rows are filled as -1
| Pixel properties | Quadrant properties | ||||||
|---|---|---|---|---|---|---|---|
| Quadrant | DetID | PixID | Counts | Sigma | Mean | Median | Sigma |
| A | 7 | 110 | 6792 | 9.18 | 2062 | 1928 | 529.6 |
| A | 0 | 29 | 6612 | 8.85 | 2062 | 1928 | 529.6 |
| A | 9 | 19 | 5889 | 7.48 | 2062 | 1928 | 529.6 |
| B | 2 | 9 | 7192 | 11.9 | 2163 | 2058 | 431.5 |
| B | 14 | 254 | 5907 | 8.92 | 2163 | 2058 | 431.5 |
| B | 12 | 226 | 5876 | 8.85 | 2163 | 2058 | 431.5 |
| C | 1 | 81 | 6232 | 7.23 | 2193 | 2026 | 581.6 |
| C | 1 | 80 | 6208 | 7.19 | 2193 | 2026 | 581.6 |
| C | 12 | 241 | 5928 | 6.71 | 2193 | 2026 | 581.6 |
| D | 11 | 82 | 6031 | 7.71 | 2023 | 1832 | 544.3 |
| D | 4 | 160 | 5251 | 6.28 | 2023 | 1832 | 544.3 |
| D | 6 | 231 | 5241 | 6.26 | 2023 | 1832 | 544.3 |
Histogram calculated using DETX and DETY for each event in the final _common_clean file
| Quadrant A | 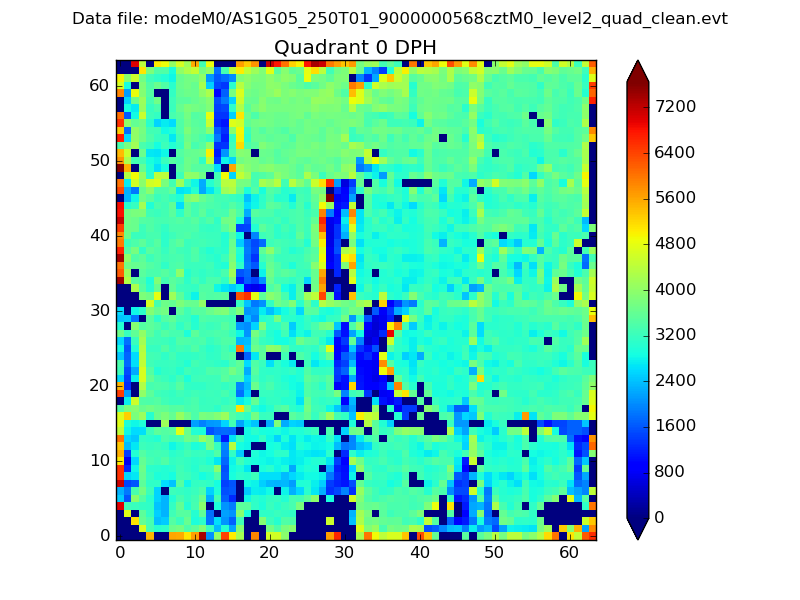 |
 |
Quadrant B |
|---|---|---|---|
| Quadrant D |  |
 |
Quadrant C |
| Plot type | Count rate plots | Images |
|---|---|---|
| Comparison with Poisson distribution Blue bars denote a histogram of data divided into 1 sec bins. Red curve is a Poisson curve with rate = median count rate of data. |
 |
 |
| Quadrant-wise count rates Data is divided into 100 sec bins |
 |
|
| Module-wise count rates for Quadrant A Data is divided into 100 sec bins |
 |
 |
| Module-wise count rates for Quadrant B Data is divided into 100 sec bins |
 |
 |
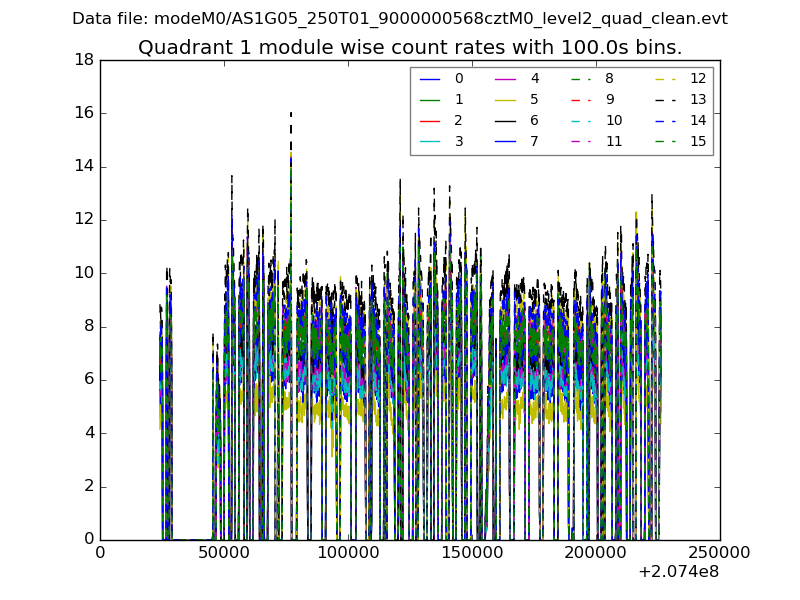
| Module-wise count rates for Quadrant C Data is divided into 100 sec bins |
 |
 |
| Module-wise count rates for Quadrant D Data is divided into 100 sec bins |
 |
 |
| Parameter | Plot |
|---|---|
| CZT HV Monitor |  |
| D_VDD |  |
| Temperature 1 |  |
| Veto HV Monitor |  |
| Veto LLD |  |
| Alpha Counter |  |
| _CPM_Rate |  |
| CZT Counter |  |
| +2.5 Volts monitor |  |
| +5 Volts monitor |  |
| _ROLL_ROT |  |
| _Roll_DEC |  |
| _Roll_RA |  |
| Veto Counter |  |