| Param | Original file | Final file |
|---|---|---|
| Filename | modeM0/AS1G05_250T01_9000000568_04511cztM0_level2.evt | modeM0/AS1G05_250T01_9000000568_04511cztM0_level2_quad_clean.evt |
| Size (bytes) | 428,676,480 | 70,997,760 |
| Size | 408.8 MB | 67.7 MB |
| Events in quadrant A | 2,506,376 | 483,241 |
| Events in quadrant B | 2,769,148 | 441,169 |
| Events in quadrant C | 2,443,020 | 450,476 |
| Events in quadrant D | 4,889,824 | 389,596 |
| Mode M0 | |||
|---|---|---|---|
| Quadrant | BADHDUFLAG | Total packets | Discarded packets |
| A | 0 | 13962 | 2270 |
| B | 0 | 14844 | 2665 |
| C | 0 | 13899 | 2414 |
| D | 0 | 23787 | 5697 |
| Mode SS | |||
|---|---|---|---|
| Quadrant | BADHDUFLAG | Total packets | Discarded packets |
| A | 0 | 132 | 16 |
| B | 0 | 132 | 30 |
| C | 0 | 132 | 22 |
| D | 0 | 132 | 16 |
| Mode M9 | |||
|---|---|---|---|
| Quadrant | BADHDUFLAG | Total packets | Discarded packets |
| A | 0 | 18 | 6 |
| B | 0 | 17 | 5 |
| C | 0 | 18 | 2 |
| D | 0 | 19 | 4 |
| Quadrant | Total seconds | Saturated seconds | Saturation percentage |
|---|---|---|---|
| A | 5607 | 22 | 0.392367% |
| B | 5508 | 26 | 0.472041% |
| C | 5578 | 12 | 0.215131% |
| D | 5241 | 642 | 12.249571% |
Noise dominated data is calculated using 1-second bins in cleaned event files. If a bin has >2000 counts, and if more than 50% of those come from <1% of pixels, then it is considered to be noise-dominated and hence unusable.
| Quadrant | # 1 sec bins | Bins with >0 counts | Bins with >2000 counts | High rate bins dominated by noise | Noise dominated (total time) | Noise dominated (detector-on time) | Marked lightcurve |
|---|---|---|---|---|---|---|---|
| A | 7617 | 6180 | 0 | 0 | 0.00% | 0.00% | 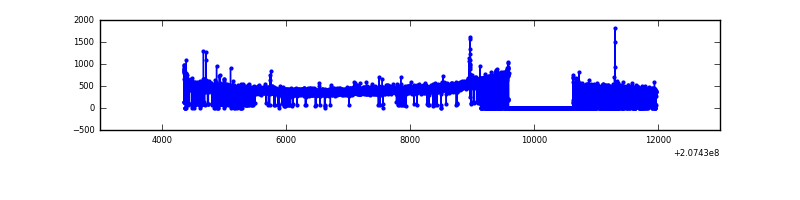 |
| B | 7617 | 6091 | 4 | 4 | 0.05% | 0.07% | 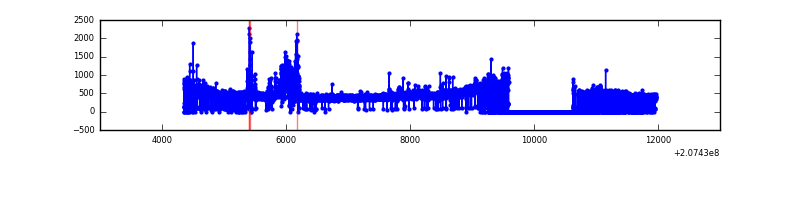 |
| C | 7617 | 6147 | 1 | 1 | 0.01% | 0.02% | 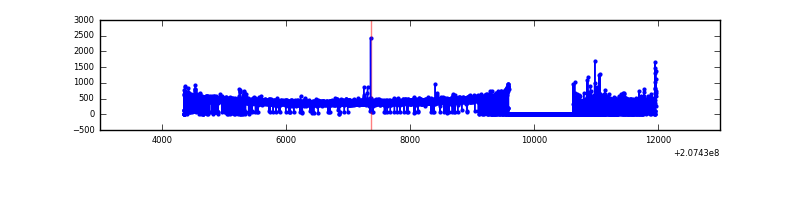 |
| D | 7614 | 5939 | 436 | 436 | 5.73% | 7.34% |  |
Top three noisy pixels from each quadrant. If the there are fewer than three noisy pixels in the level2.evt file, extra rows are filled as -1
| Pixel properties | Quadrant properties | ||||||
|---|---|---|---|---|---|---|---|
| Quadrant | DetID | PixID | Counts | Sigma | Mean | Median | Sigma |
| A | 0 | 13 | 18166 | 135.29 | 635 | 621 | 129.7 |
| A | 0 | 50 | 16879 | 125.36 | 635 | 621 | 129.7 |
| A | 8 | 15 | 6783 | 47.51 | 635 | 621 | 129.7 |
| B | 4 | 80 | 240779 | 2006.95 | 622 | 606 | 119.7 |
| B | 8 | 3 | 50050 | 413.17 | 622 | 606 | 119.7 |
| B | 15 | 204 | 44942 | 370.48 | 622 | 606 | 119.7 |
| C | 9 | 247 | 36318 | 250.48 | 609 | 612 | 142.6 |
| C | 14 | 48 | 12945 | 86.52 | 609 | 612 | 142.6 |
| C | 9 | 54 | 11519 | 76.51 | 609 | 612 | 142.6 |
| D | 1 | 20 | 1627590 | 12102.0 | 550 | 535 | 134.4 |
| D | 10 | 40 | 559646 | 4158.66 | 550 | 535 | 134.4 |
| D | 11 | 132 | 227852 | 1690.78 | 550 | 535 | 134.4 |
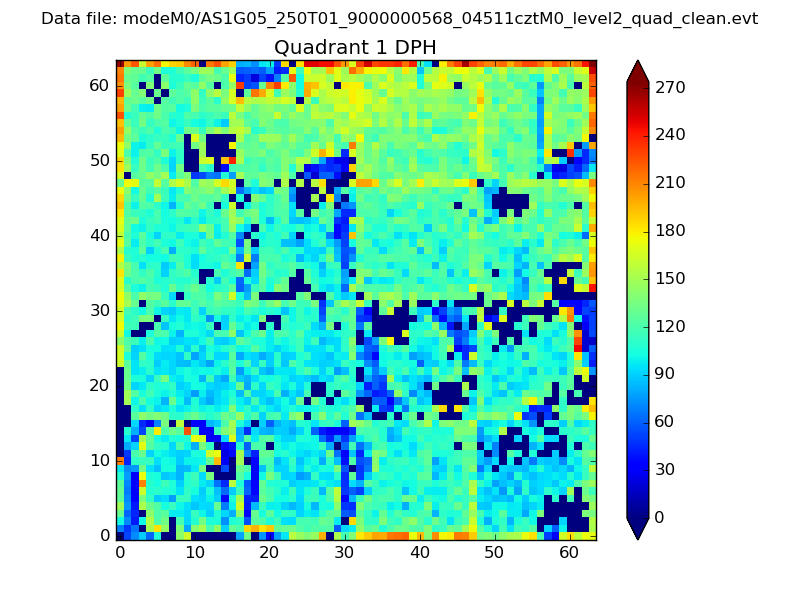
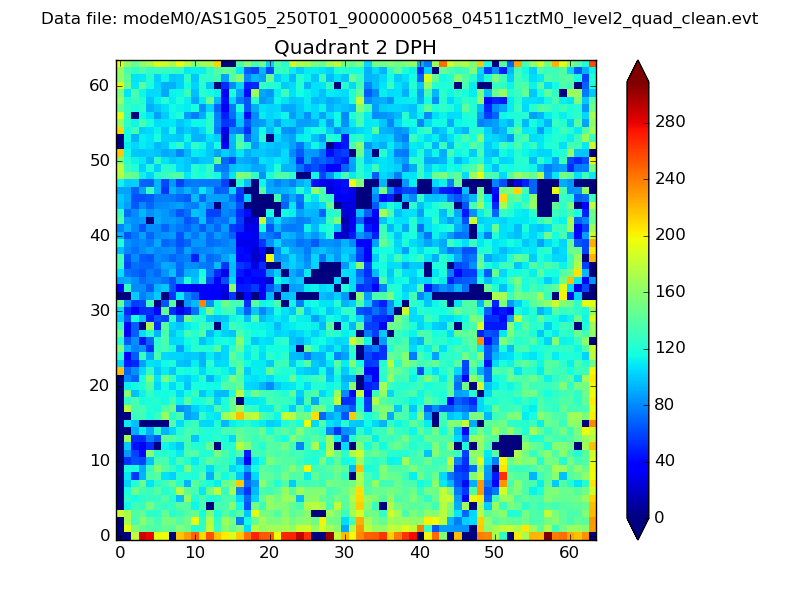
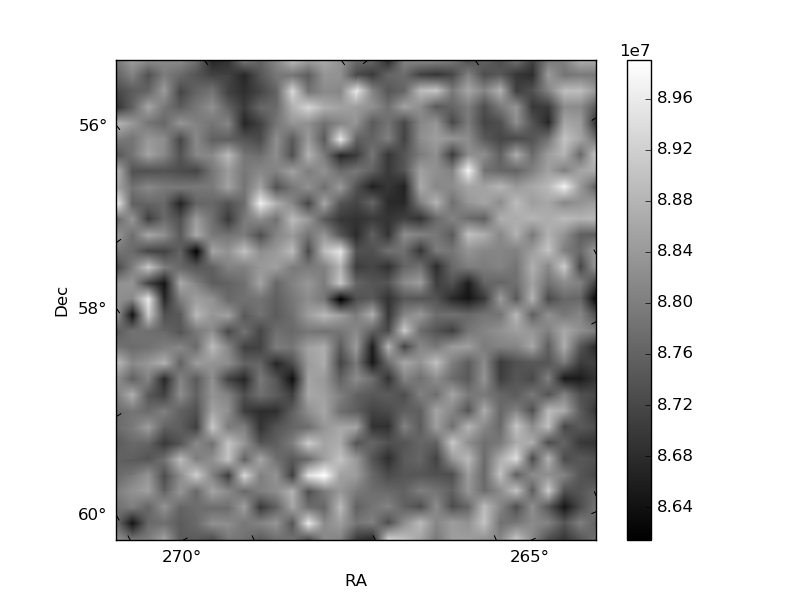
Histogram calculated using DETX and DETY for each event in the final _common_clean file
| Quadrant A | 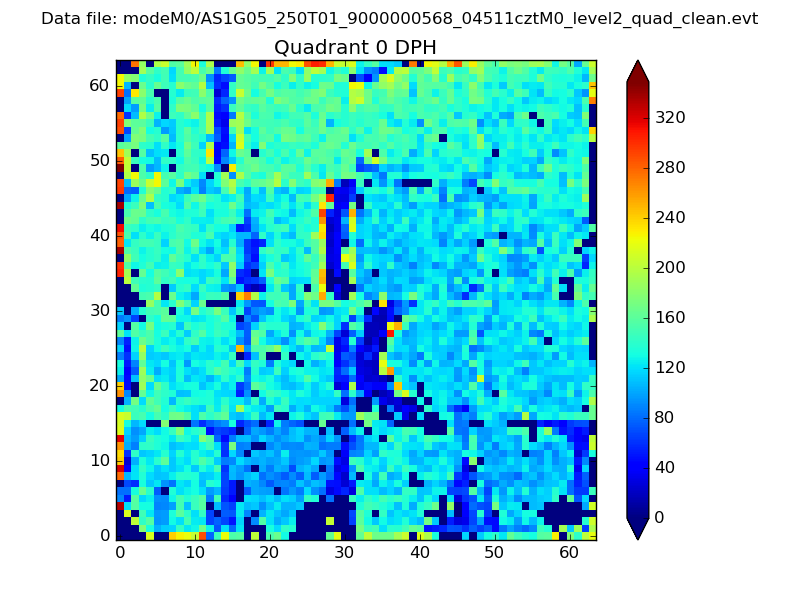 |
 |
Quadrant B |
|---|---|---|---|
| Quadrant D | 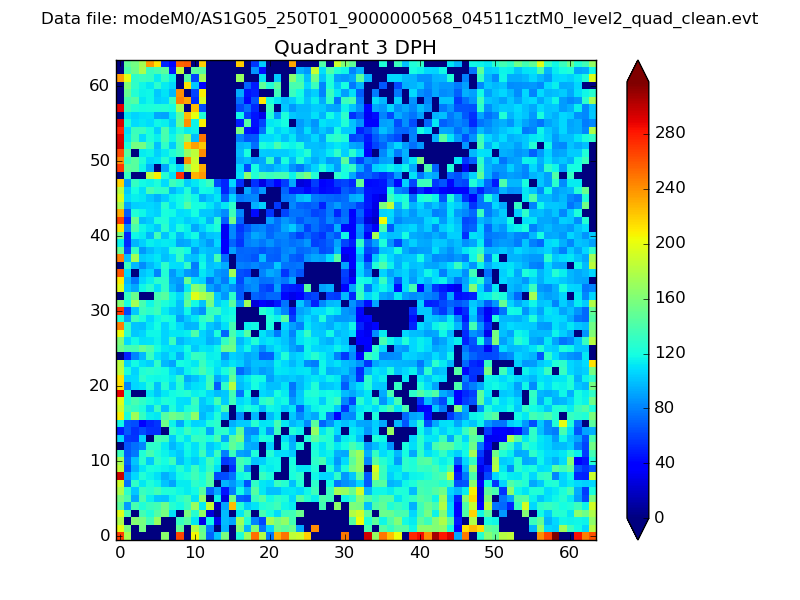 |
 |
Quadrant C |
| Plot type | Count rate plots | Images |
|---|---|---|
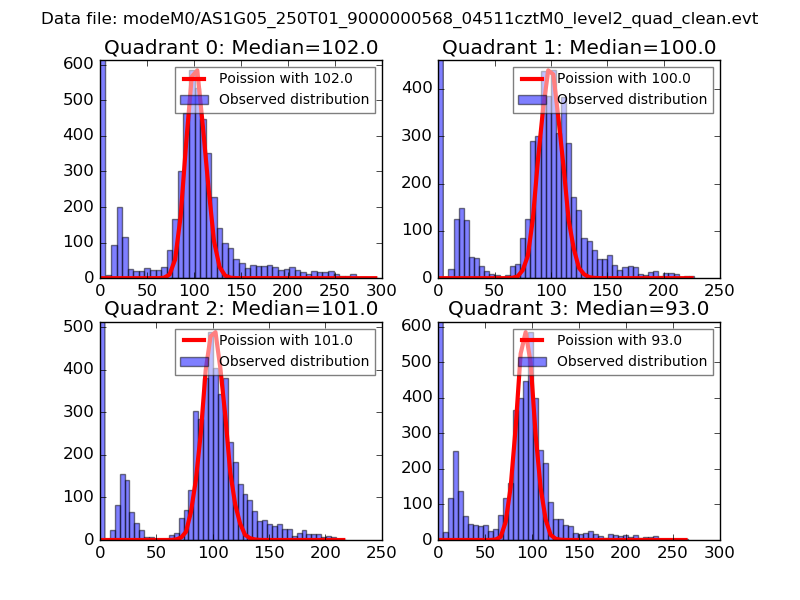
| Comparison with Poisson distribution Blue bars denote a histogram of data divided into 1 sec bins. Red curve is a Poisson curve with rate = median count rate of data. |
 |
 |
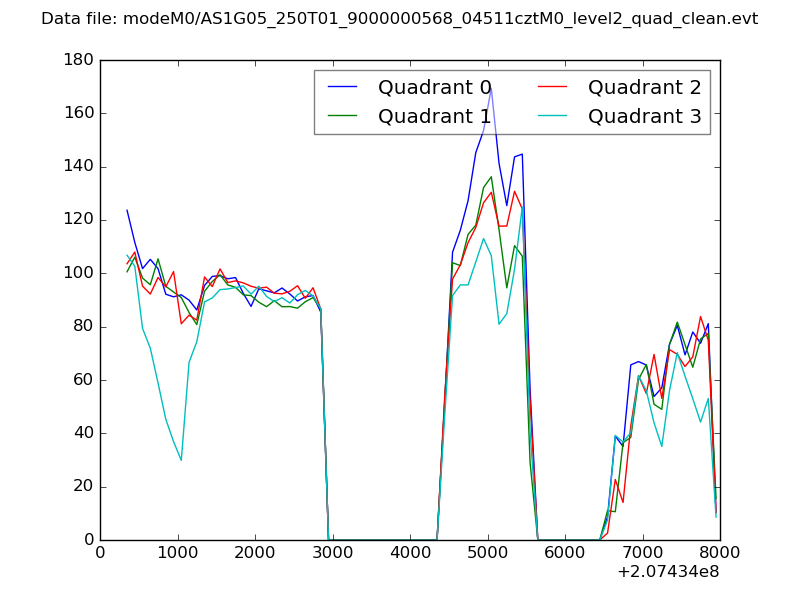
| Quadrant-wise count rates Data is divided into 100 sec bins |
 |
|
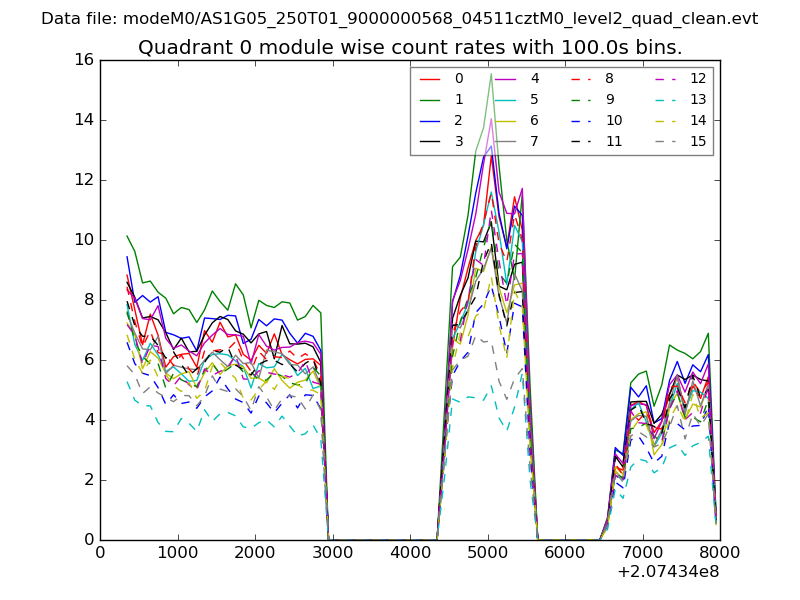
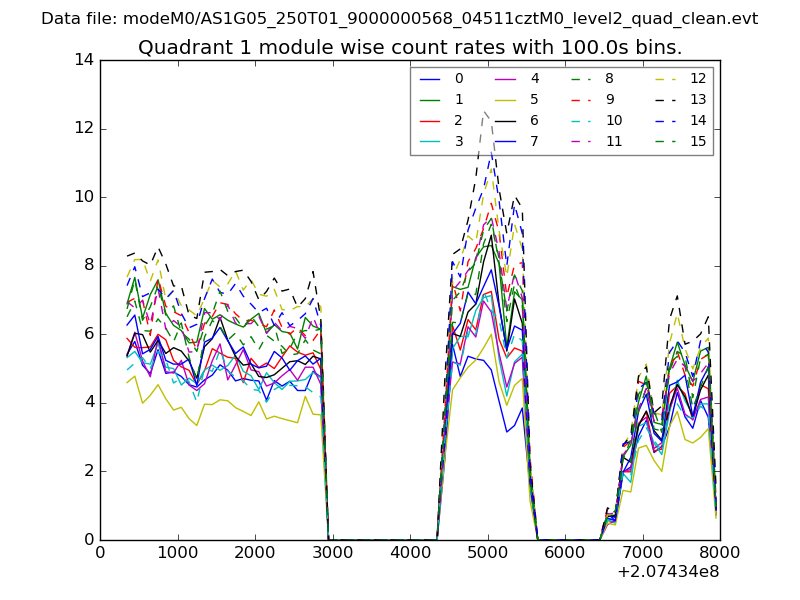
| Module-wise count rates for Quadrant A Data is divided into 100 sec bins |
 |
 |
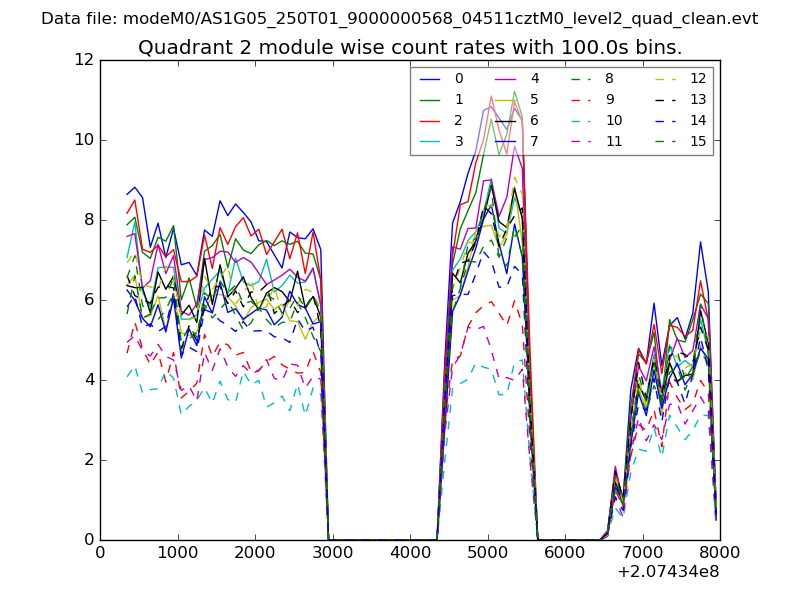
| Module-wise count rates for Quadrant B Data is divided into 100 sec bins |
 |
 |
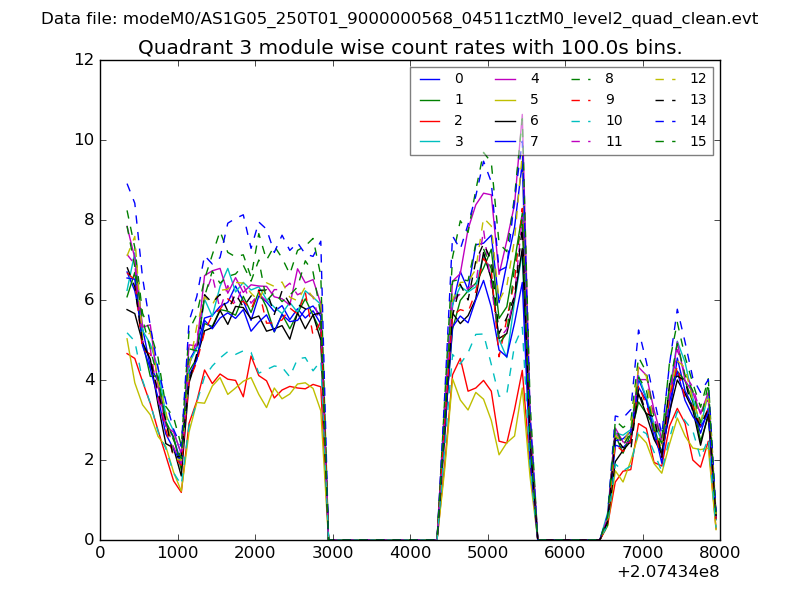
| Module-wise count rates for Quadrant C Data is divided into 100 sec bins |
 |
 |
| Module-wise count rates for Quadrant D Data is divided into 100 sec bins |
 |
 |
| Parameter | Plot |
|---|---|
| CZT HV Monitor | 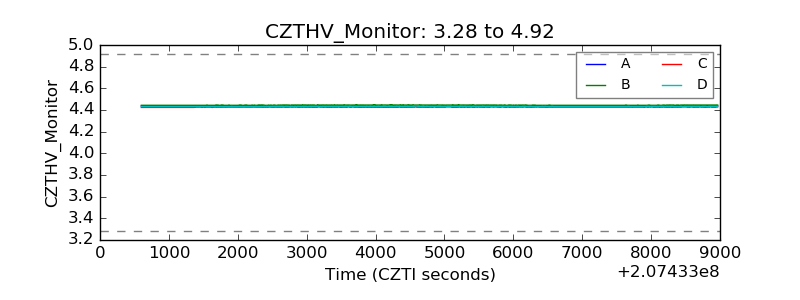 |
| D_VDD | 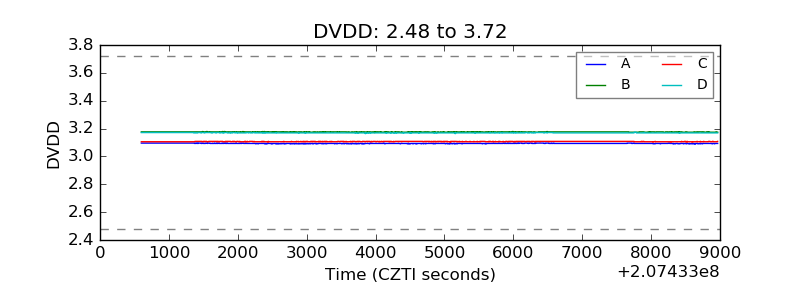 |
| Temperature 1 | 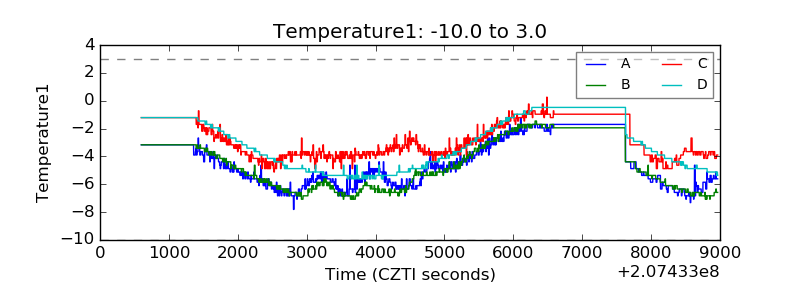 |
| Veto HV Monitor | 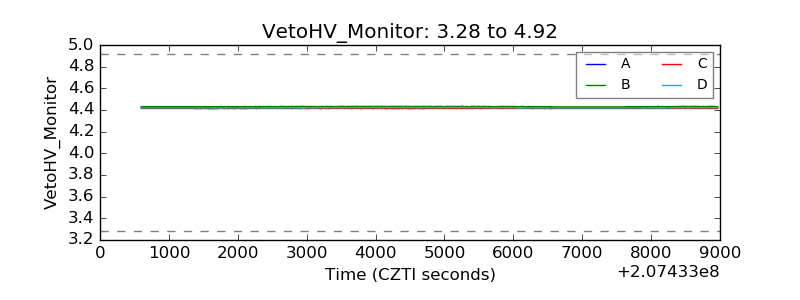 |
| Veto LLD | 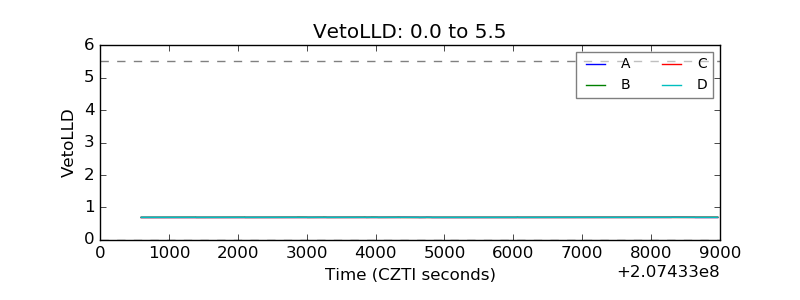 |
| Alpha Counter | 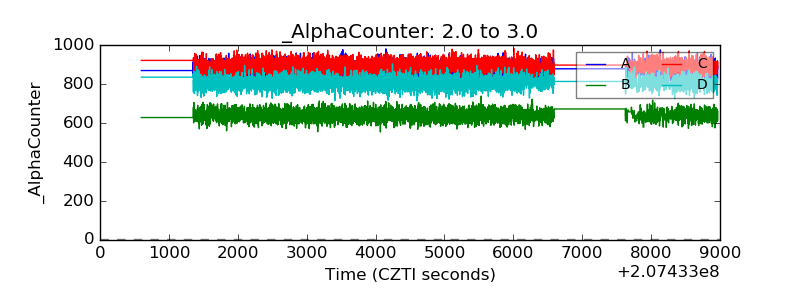 |
| _CPM_Rate | 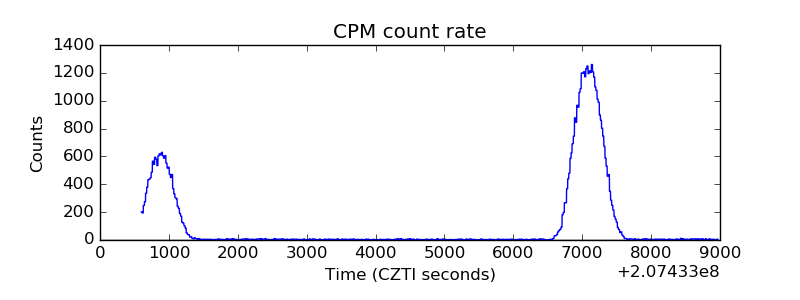 |
| CZT Counter | 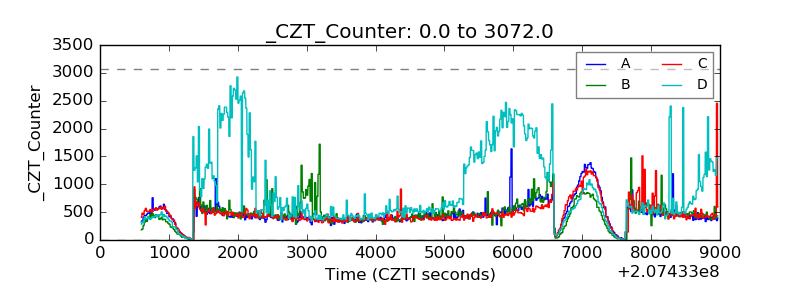 |
| +2.5 Volts monitor |  |
| +5 Volts monitor |  |
| _ROLL_ROT | 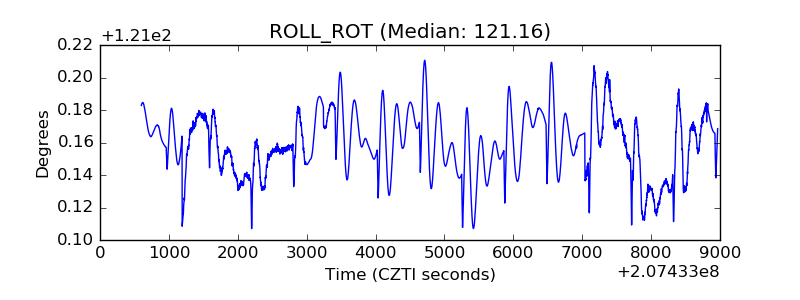 |
| _Roll_DEC | 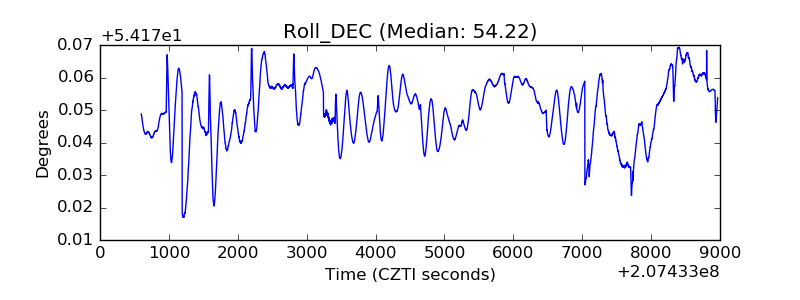 |
| _Roll_RA | 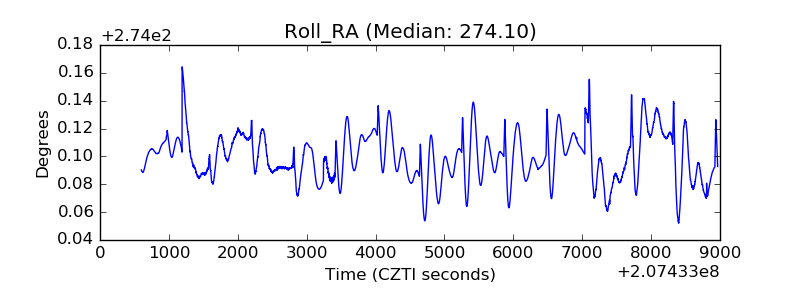 |
| Veto Counter | 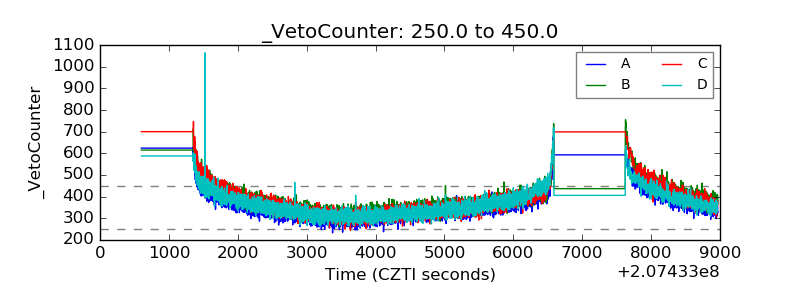 |