| Param | Original file | Final file |
|---|---|---|
| Filename | modeM0/AS1G05_250T01_9000000568_04513cztM0_level2.evt | modeM0/AS1G05_250T01_9000000568_04513cztM0_level2_quad_clean.evt |
| Size (bytes) | 500,676,480 | 83,635,200 |
| Size | 477.5 MB | 79.8 MB |
| Events in quadrant A | 3,171,907 | 540,123 |
| Events in quadrant B | 3,031,222 | 536,445 |
| Events in quadrant C | 2,916,779 | 531,737 |
| Events in quadrant D | 5,624,165 | 493,360 |
| Mode M0 | |||
|---|---|---|---|
| Quadrant | BADHDUFLAG | Total packets | Discarded packets |
| A | 0 | 14409 | 562 |
| B | 0 | 13942 | 549 |
| C | 0 | 13708 | 563 |
| D | 0 | 22432 | 1571 |
| Mode SS | |||
|---|---|---|---|
| Quadrant | BADHDUFLAG | Total packets | Discarded packets |
| A | 0 | 132 | 8 |
| B | 0 | 132 | 4 |
| C | 0 | 132 | 6 |
| D | 0 | 132 | 8 |
| Mode M9 | |||
|---|---|---|---|
| Quadrant | BADHDUFLAG | Total packets | Discarded packets |
| A | 0 | 23 | 0 |
| B | 0 | 23 | 0 |
| C | 0 | 23 | 0 |
| D | 0 | 23 | 2 |
| Quadrant | Total seconds | Saturated seconds | Saturation percentage |
|---|---|---|---|
| A | 6206 | 72 | 1.160168% |
| B | 6217 | 54 | 0.868586% |
| C | 6211 | 28 | 0.450813% |
| D | 6058 | 170 | 2.806207% |
Noise dominated data is calculated using 1-second bins in cleaned event files. If a bin has >2000 counts, and if more than 50% of those come from <1% of pixels, then it is considered to be noise-dominated and hence unusable.
| Quadrant | # 1 sec bins | Bins with >0 counts | Bins with >2000 counts | High rate bins dominated by noise | Noise dominated (total time) | Noise dominated (detector-on time) | Marked lightcurve |
|---|---|---|---|---|---|---|---|
| A | 8671 | 6446 | 28 | 28 | 0.32% | 0.43% |  |
| B | 8672 | 6442 | 10 | 10 | 0.12% | 0.16% |  |
| C | 8672 | 6451 | 7 | 7 | 0.08% | 0.11% |  |
| D | 8672 | 6418 | 92 | 92 | 1.06% | 1.43% | 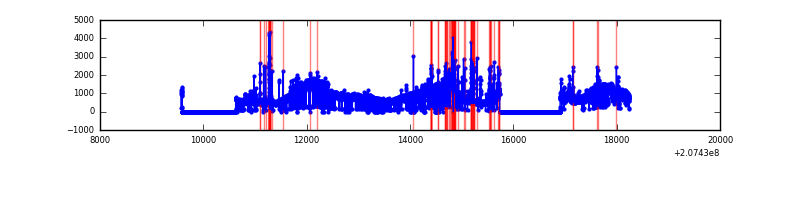 |
Top three noisy pixels from each quadrant. If the there are fewer than three noisy pixels in the level2.evt file, extra rows are filled as -1
| Pixel properties | Quadrant properties | ||||||
|---|---|---|---|---|---|---|---|
| Quadrant | DetID | PixID | Counts | Sigma | Mean | Median | Sigma |
| A | 0 | 13 | 304441 | 2116.54 | 710 | 694 | 143.5 |
| A | 0 | 118 | 47503 | 326.17 | 710 | 694 | 143.5 |
| A | 0 | 50 | 42156 | 288.91 | 710 | 694 | 143.5 |
| B | 8 | 3 | 51147 | 368.09 | 722 | 705 | 137.0 |
| B | 15 | 204 | 49296 | 354.58 | 722 | 705 | 137.0 |
| B | 10 | 16 | 47711 | 343.02 | 722 | 705 | 137.0 |
| C | 9 | 247 | 167460 | 1027.04 | 696 | 699 | 162.4 |
| C | 14 | 48 | 17528 | 103.65 | 696 | 699 | 162.4 |
| C | 13 | 61 | 5719 | 30.92 | 696 | 699 | 162.4 |
| D | 1 | 20 | 2595469 | 16055.71 | 665 | 645 | 161.6 |
| D | 13 | 235 | 161648 | 996.22 | 665 | 645 | 161.6 |
| D | 10 | 40 | 71127 | 436.11 | 665 | 645 | 161.6 |
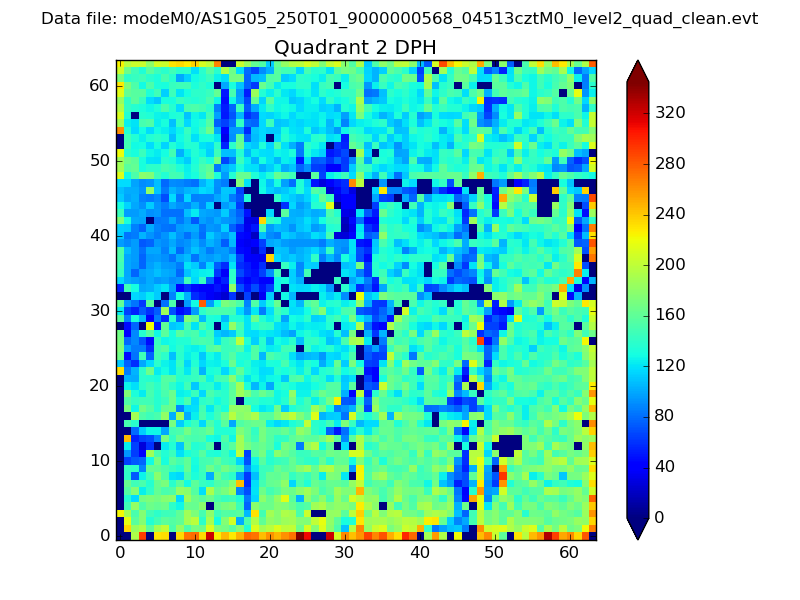
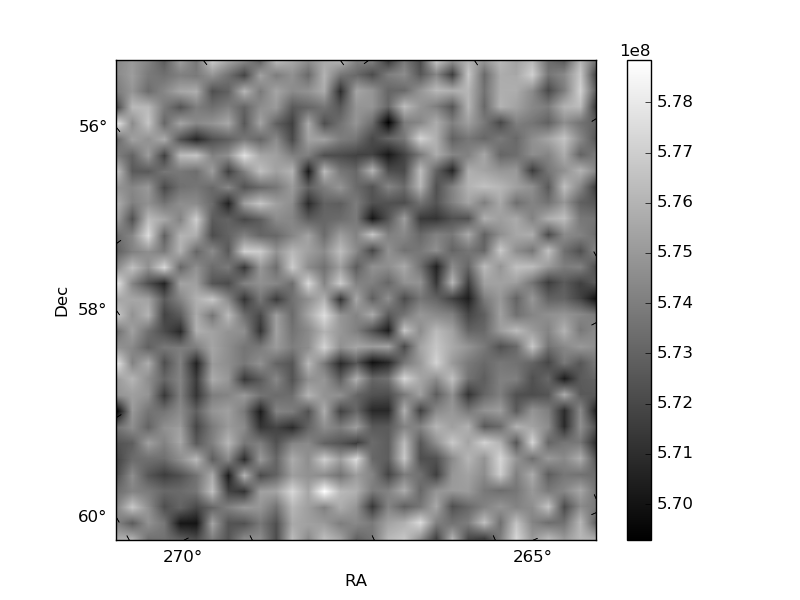
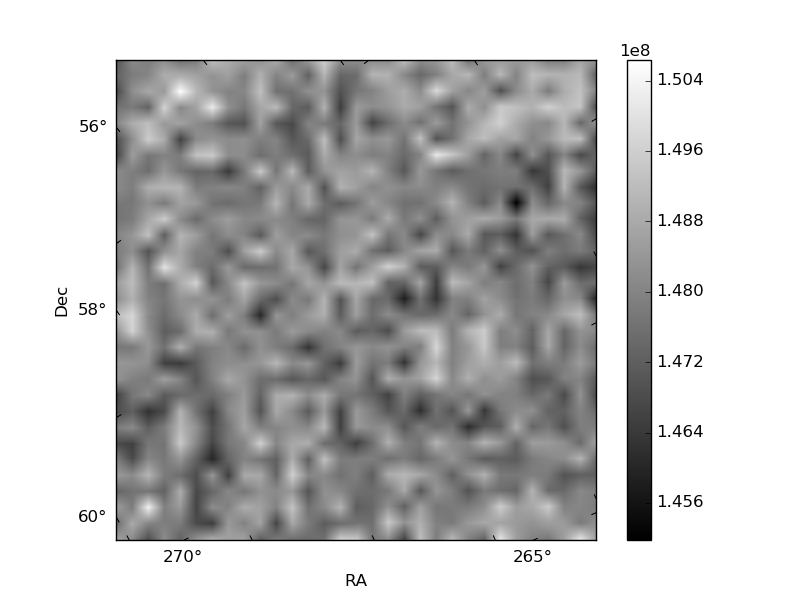
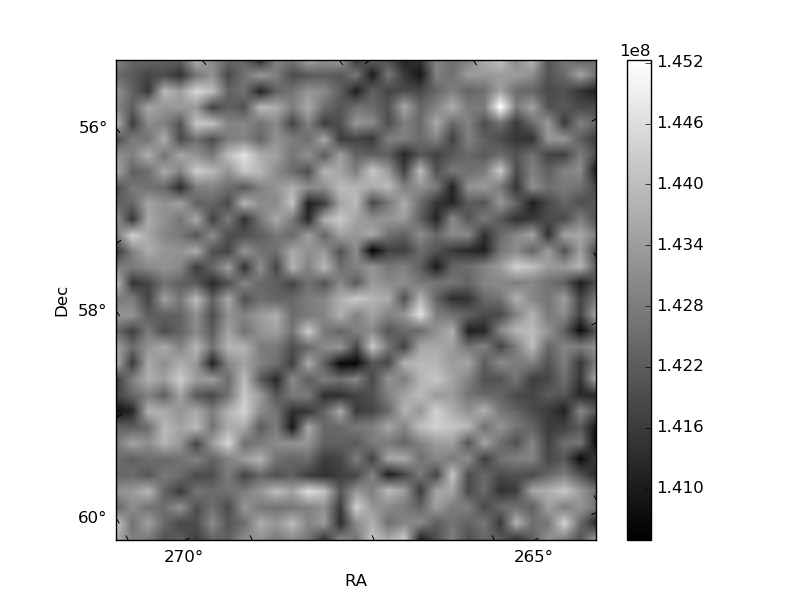
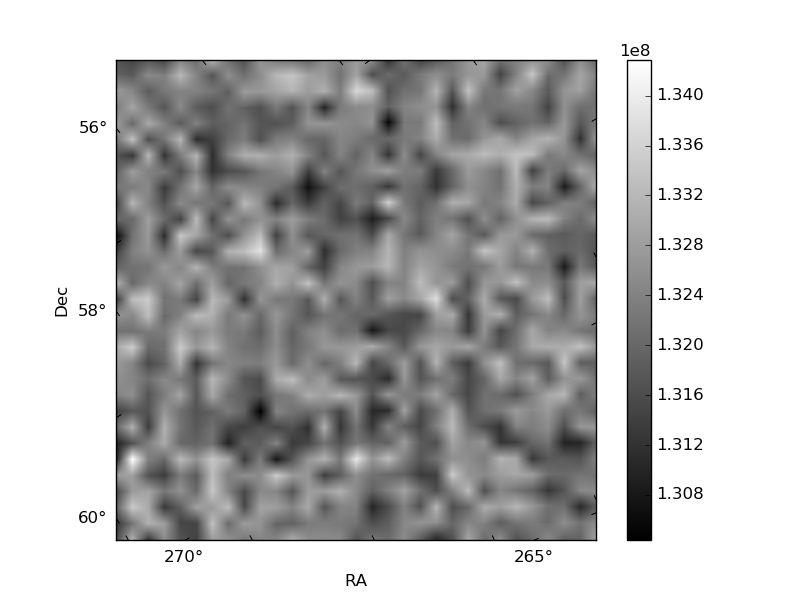
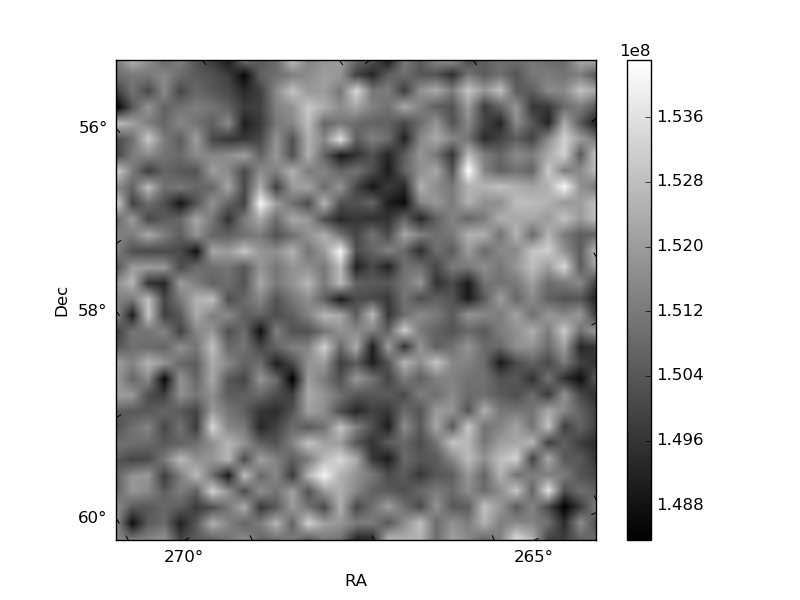
Histogram calculated using DETX and DETY for each event in the final _common_clean file
| Quadrant A |  |
 |
Quadrant B |
|---|---|---|---|
| Quadrant D | 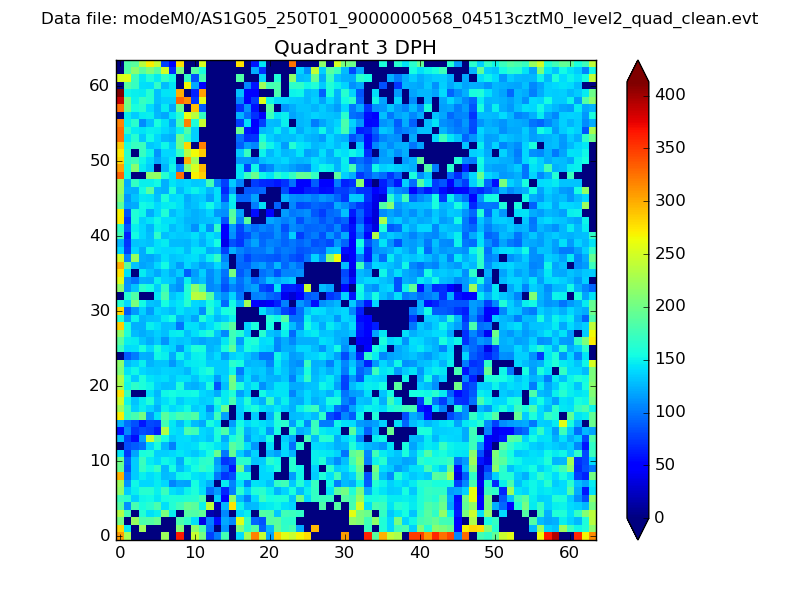 |
 |
Quadrant C |
| Plot type | Count rate plots | Images |
|---|---|---|
| Comparison with Poisson distribution Blue bars denote a histogram of data divided into 1 sec bins. Red curve is a Poisson curve with rate = median count rate of data. |
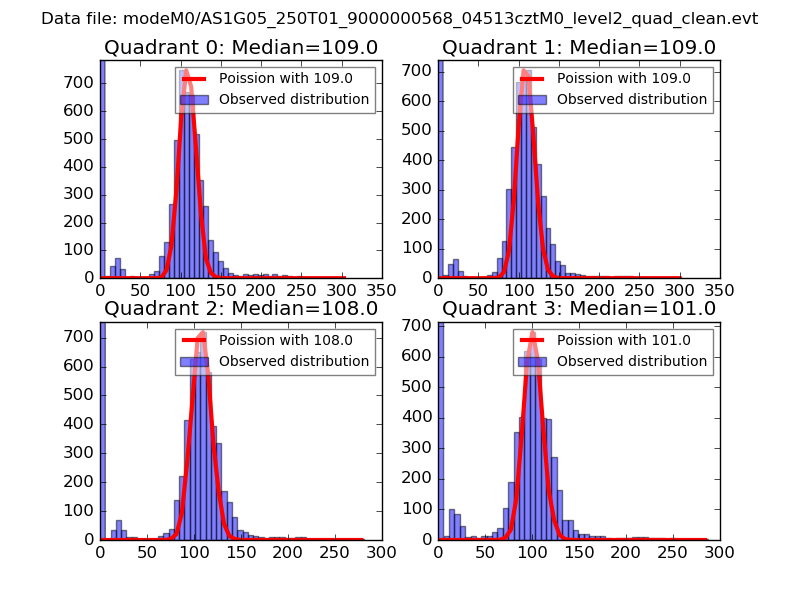 |
 |
| Quadrant-wise count rates Data is divided into 100 sec bins |
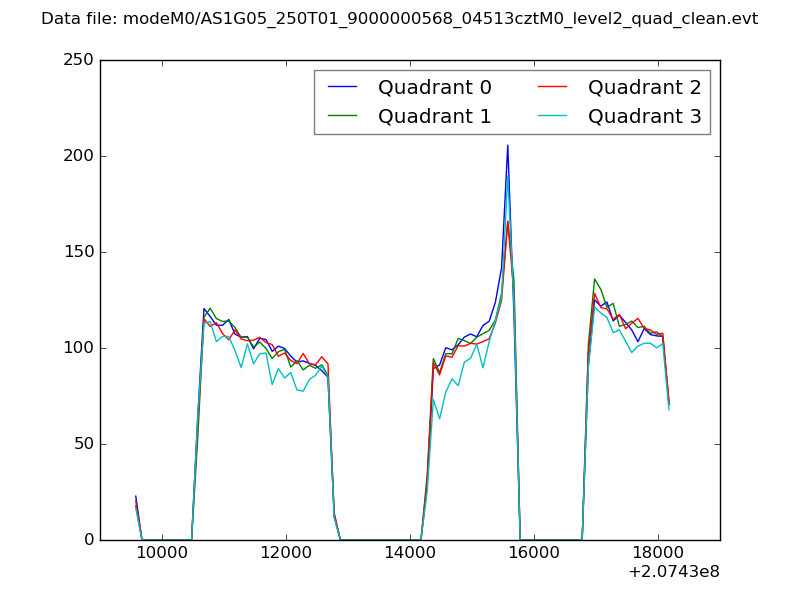 |
|
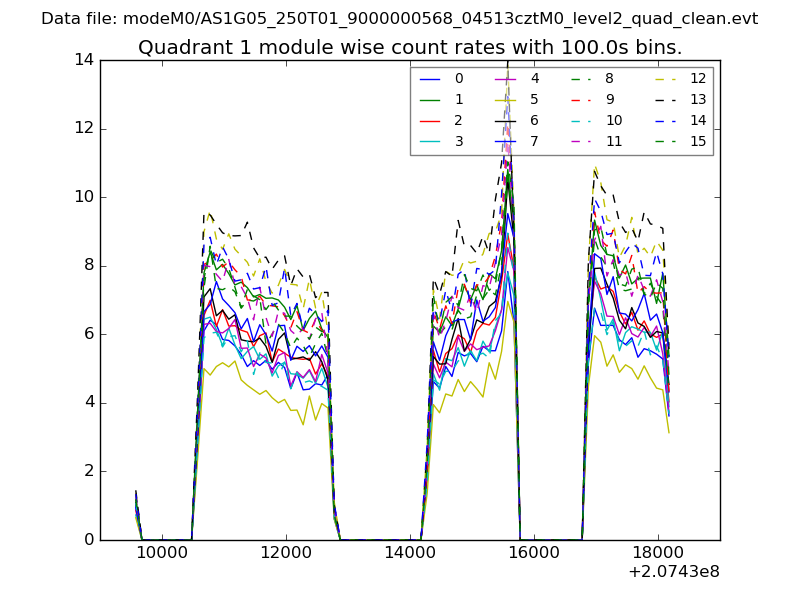
| Module-wise count rates for Quadrant A Data is divided into 100 sec bins |
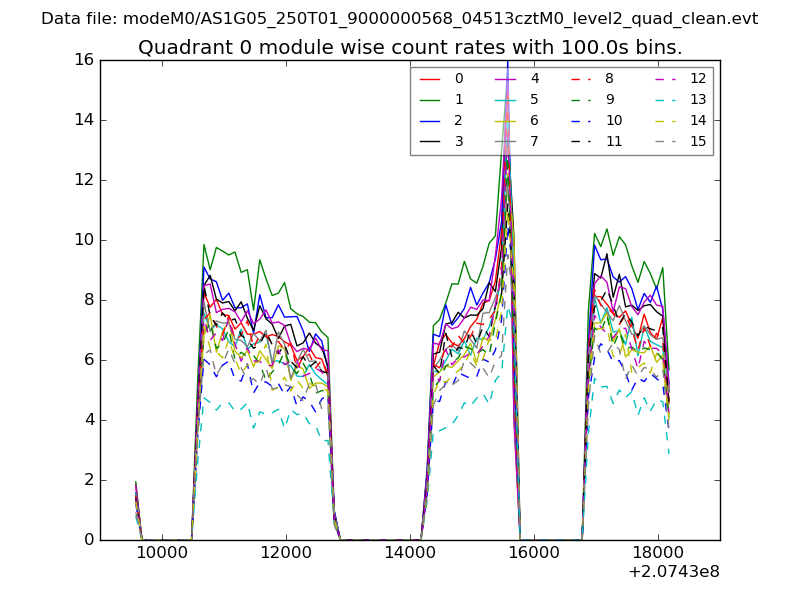 |
 |
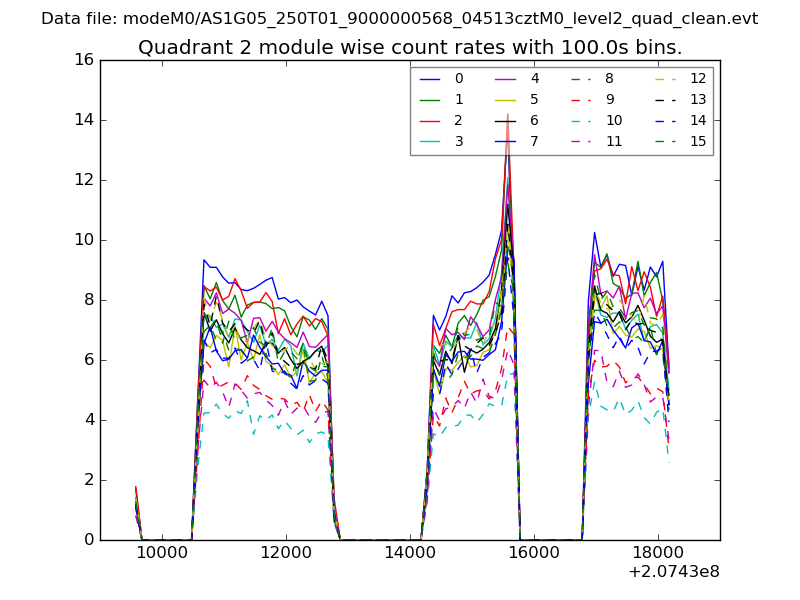
| Module-wise count rates for Quadrant B Data is divided into 100 sec bins |
 |
 |
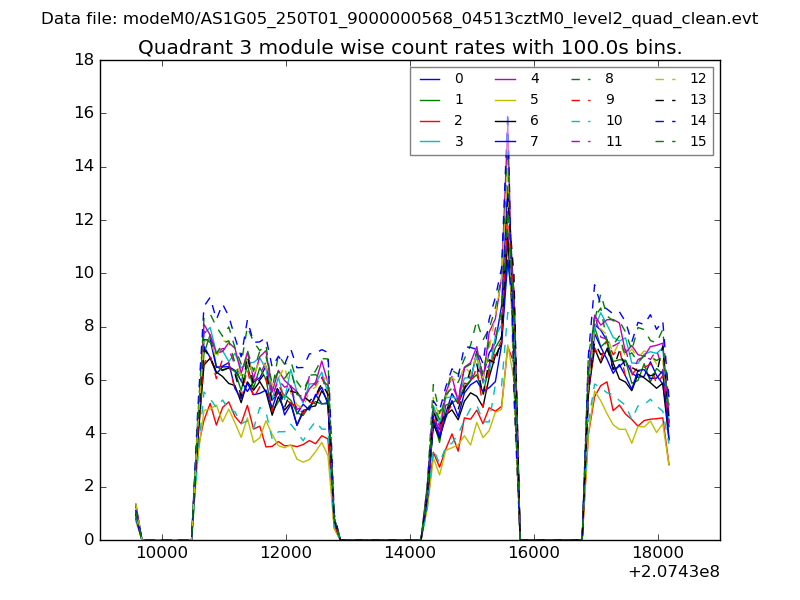
| Module-wise count rates for Quadrant C Data is divided into 100 sec bins |
 |
 |
| Module-wise count rates for Quadrant D Data is divided into 100 sec bins |
 |
 |
| Parameter | Plot |
|---|---|
| CZT HV Monitor | 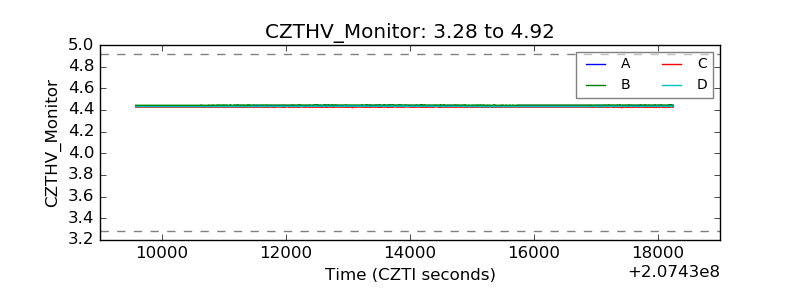 |
| D_VDD | 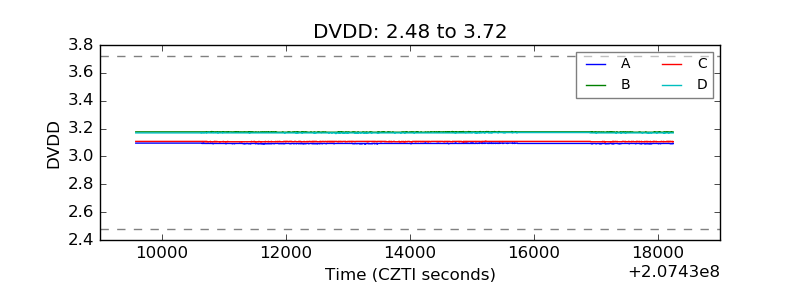 |
| Temperature 1 | 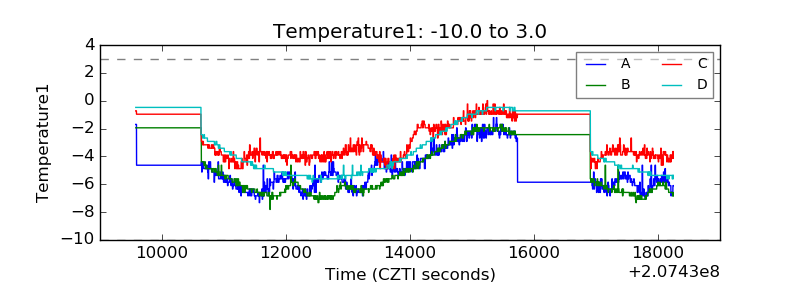 |
| Veto HV Monitor | 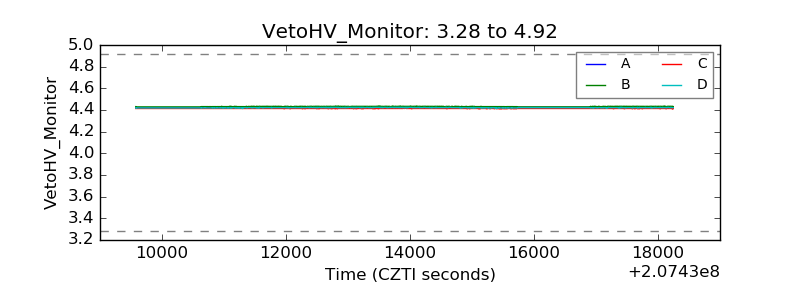 |
| Veto LLD | 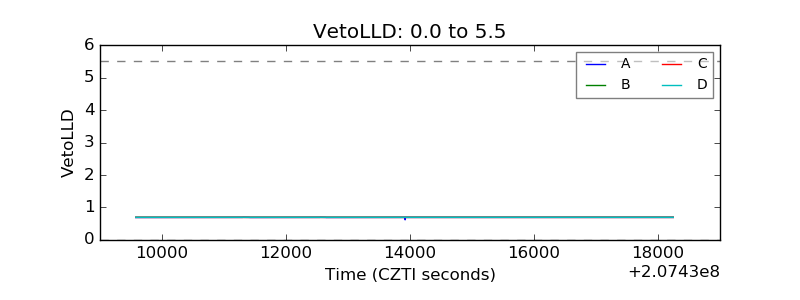 |
| Alpha Counter | 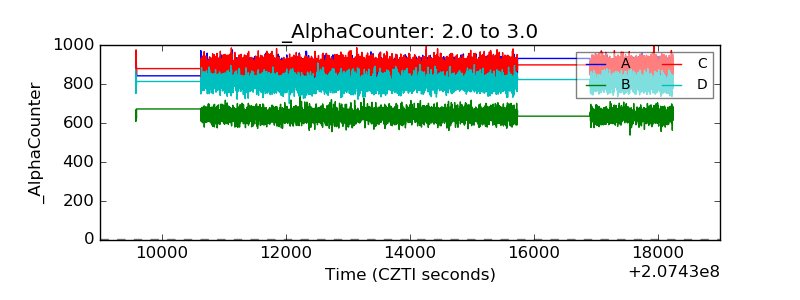 |
| _CPM_Rate | 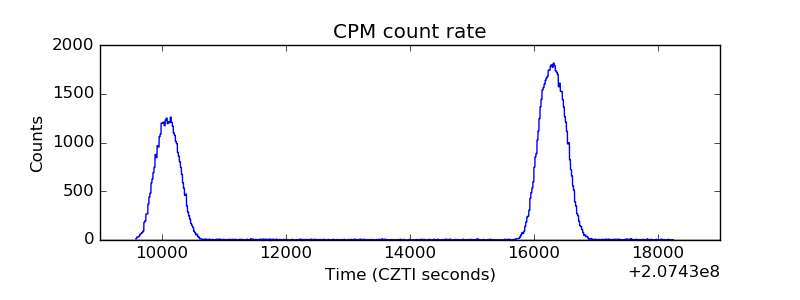 |
| CZT Counter | 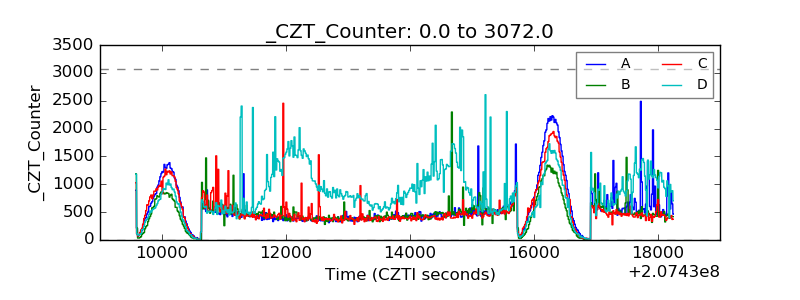 |
| +2.5 Volts monitor | 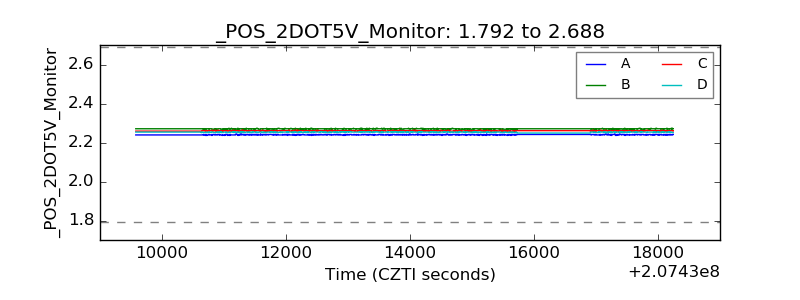 |
| +5 Volts monitor |  |
| _ROLL_ROT | 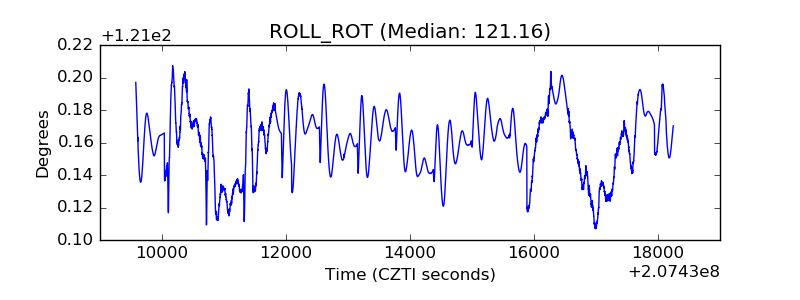 |
| _Roll_DEC | 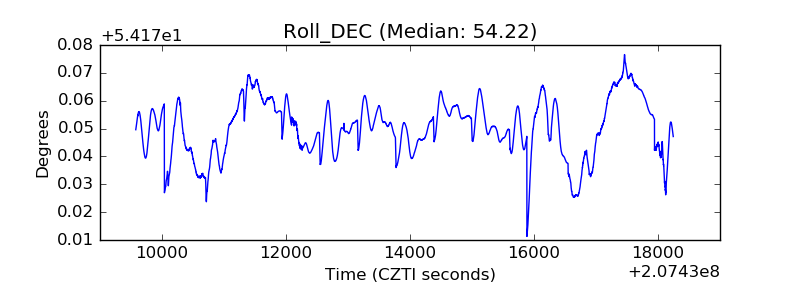 |
| _Roll_RA | 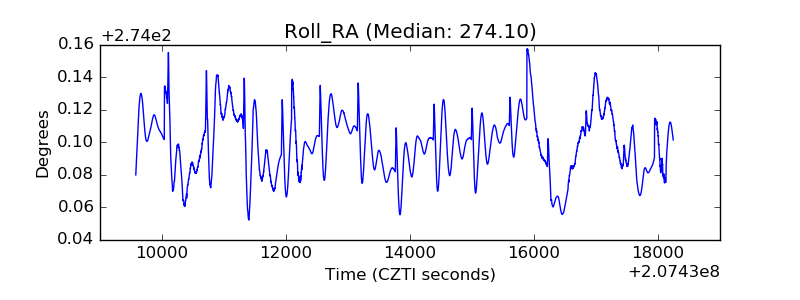 |
| Veto Counter | 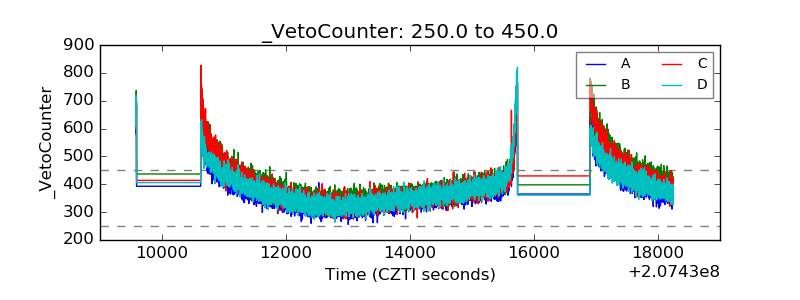 |