| Param | Original file | Final file |
|---|---|---|
| Filename | modeM0/AS1G05_250T01_9000000568_04514cztM0_level2.evt | modeM0/AS1G05_250T01_9000000568_04514cztM0_level2_quad_clean.evt |
| Size (bytes) | 687,113,280 | 113,546,880 |
| Size | 655.3 MB | 108.3 MB |
| Events in quadrant A | 5,418,708 | 705,082 |
| Events in quadrant B | 4,602,404 | 721,029 |
| Events in quadrant C | 4,222,997 | 717,862 |
| Events in quadrant D | 5,938,366 | 653,289 |
| Mode M0 | |||
|---|---|---|---|
| Quadrant | BADHDUFLAG | Total packets | Discarded packets |
| A | 0 | 26604 | 4320 |
| B | 0 | 22716 | 2712 |
| C | 0 | 21781 | 2593 |
| D | 0 | 28898 | 4784 |
| Mode SS | |||
|---|---|---|---|
| Quadrant | BADHDUFLAG | Total packets | Discarded packets |
| A | 0 | 220 | 24 |
| B | 0 | 220 | 22 |
| C | 0 | 220 | 22 |
| D | 0 | 220 | 16 |
| Mode M9 | |||
|---|---|---|---|
| Quadrant | BADHDUFLAG | Total packets | Discarded packets |
| A | 0 | 31 | 2 |
| B | 0 | 31 | 5 |
| C | 0 | 31 | 3 |
| D | 0 | 31 | 1 |
| Quadrant | Total seconds | Saturated seconds | Saturation percentage |
|---|---|---|---|
| A | 9135 | 257 | 2.813355% |
| B | 9321 | 106 | 1.137217% |
| C | 9319 | 48 | 0.515077% |
| D | 9028 | 269 | 2.979619% |
Noise dominated data is calculated using 1-second bins in cleaned event files. If a bin has >2000 counts, and if more than 50% of those come from <1% of pixels, then it is considered to be noise-dominated and hence unusable.
| Quadrant | # 1 sec bins | Bins with >0 counts | Bins with >2000 counts | High rate bins dominated by noise | Noise dominated (total time) | Noise dominated (detector-on time) | Marked lightcurve |
|---|---|---|---|---|---|---|---|
| A | 30332 | 9880 | 110 | 110 | 0.36% | 1.11% |  |
| B | 30332 | 10037 | 15 | 15 | 0.05% | 0.15% |  |
| C | 30332 | 10038 | 4 | 4 | 0.01% | 0.04% |  |
| D | 30332 | 9816 | 213 | 213 | 0.70% | 2.17% | 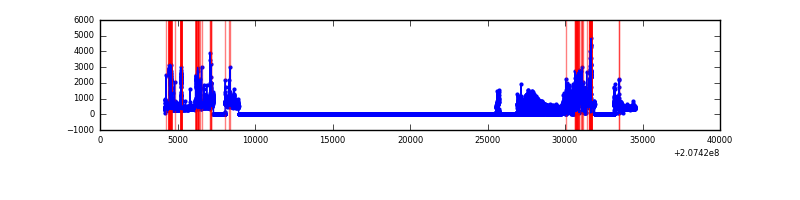 |
Top three noisy pixels from each quadrant. If the there are fewer than three noisy pixels in the level2.evt file, extra rows are filled as -1
| Pixel properties | Quadrant properties | ||||||
|---|---|---|---|---|---|---|---|
| Quadrant | DetID | PixID | Counts | Sigma | Mean | Median | Sigma |
| A | 0 | 13 | 884911 | 4136.3 | 1055 | 1033 | 213.7 |
| A | 0 | 50 | 312815 | 1459.05 | 1055 | 1033 | 213.7 |
| A | 8 | 15 | 66709 | 307.35 | 1055 | 1033 | 213.7 |
| B | 8 | 3 | 128208 | 608.21 | 1096 | 1069 | 209.0 |
| B | 4 | 48 | 78106 | 368.53 | 1096 | 1069 | 209.0 |
| B | 15 | 204 | 60089 | 282.34 | 1096 | 1069 | 209.0 |
| C | 9 | 247 | 73683 | 297.38 | 1051 | 1057 | 244.2 |
| C | 14 | 48 | 16757 | 64.29 | 1051 | 1057 | 244.2 |
| C | 9 | 16 | 11827 | 44.1 | 1051 | 1057 | 244.2 |
| D | 1 | 20 | 1123200 | 4247.97 | 991 | 970 | 264.2 |
| D | 13 | 235 | 521706 | 1971.14 | 991 | 970 | 264.2 |
| D | 10 | 40 | 151813 | 570.99 | 991 | 970 | 264.2 |
Histogram calculated using DETX and DETY for each event in the final _common_clean file
| Quadrant A | 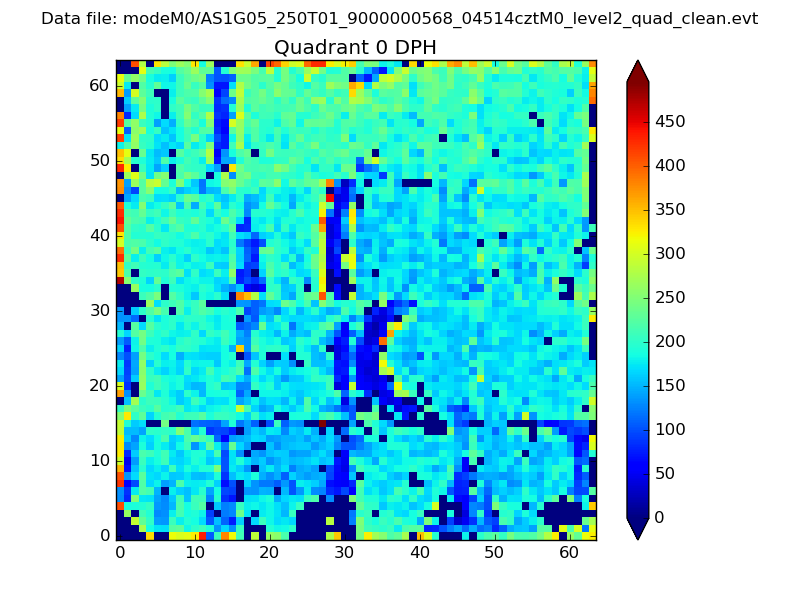 |
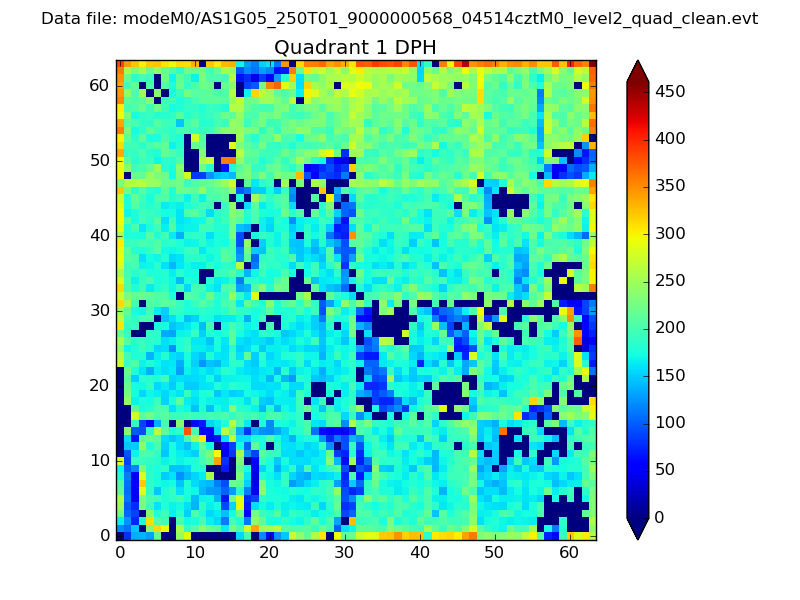 |
Quadrant B |
|---|---|---|---|
| Quadrant D | 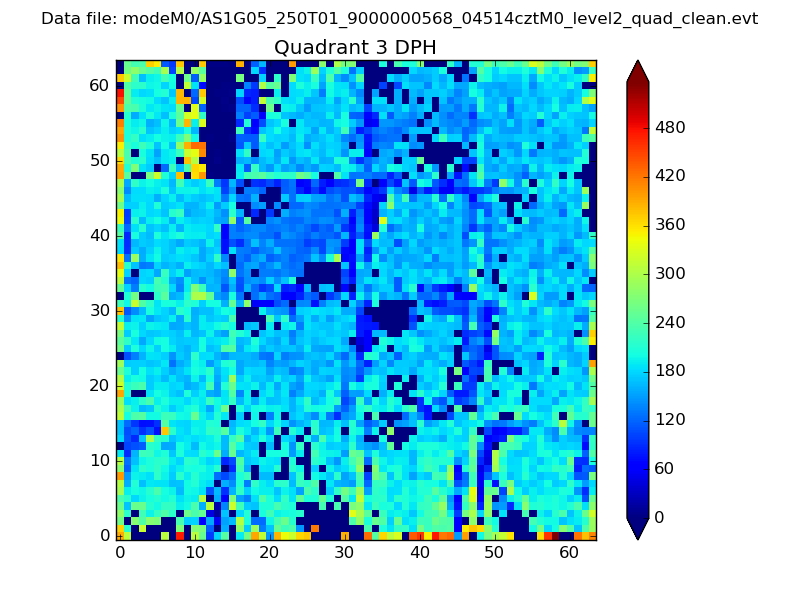 |
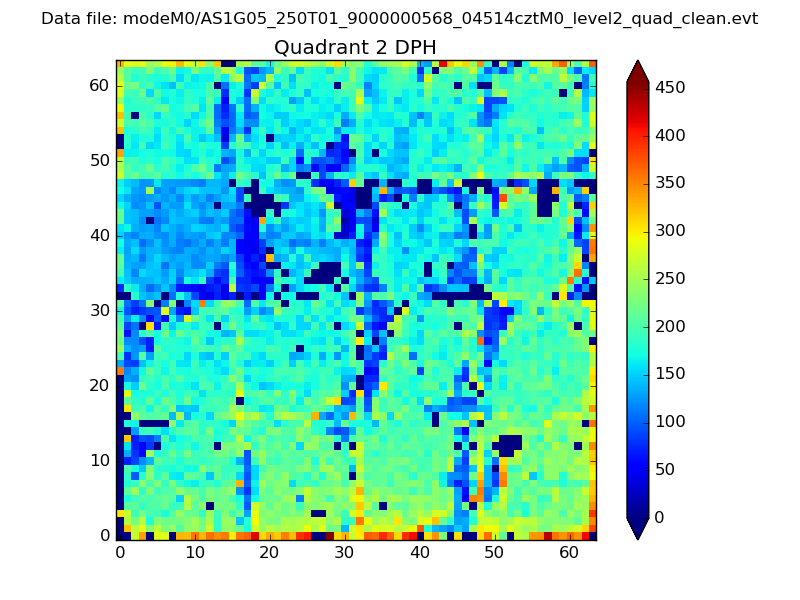 |
Quadrant C |
| Plot type | Count rate plots | Images |
|---|---|---|
| Comparison with Poisson distribution Blue bars denote a histogram of data divided into 1 sec bins. Red curve is a Poisson curve with rate = median count rate of data. |
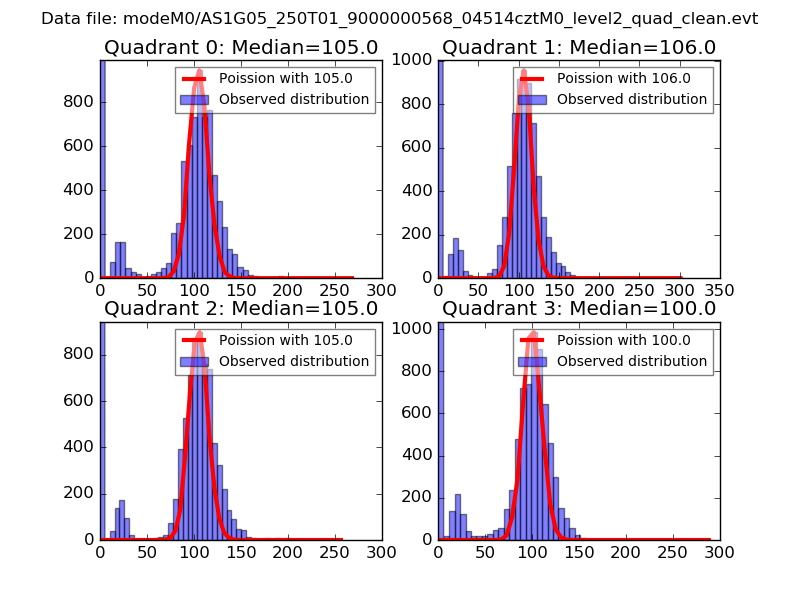 |
 |
| Quadrant-wise count rates Data is divided into 100 sec bins |
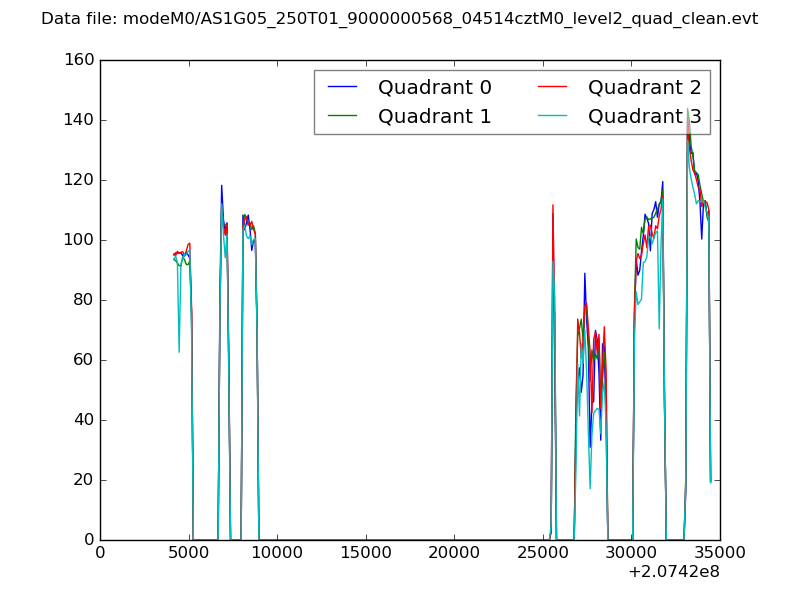 |
|
| Module-wise count rates for Quadrant A Data is divided into 100 sec bins |
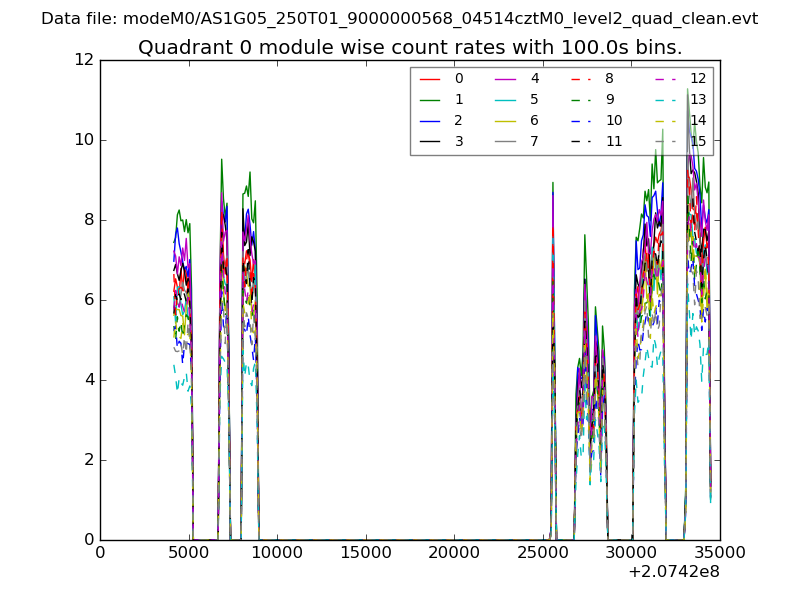 |
 |
| Module-wise count rates for Quadrant B Data is divided into 100 sec bins |
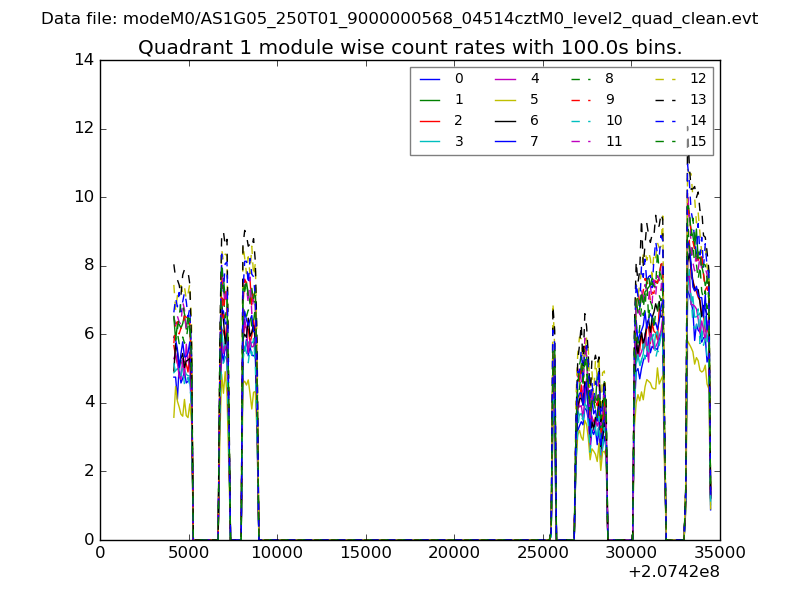 |
 |
| Module-wise count rates for Quadrant C Data is divided into 100 sec bins |
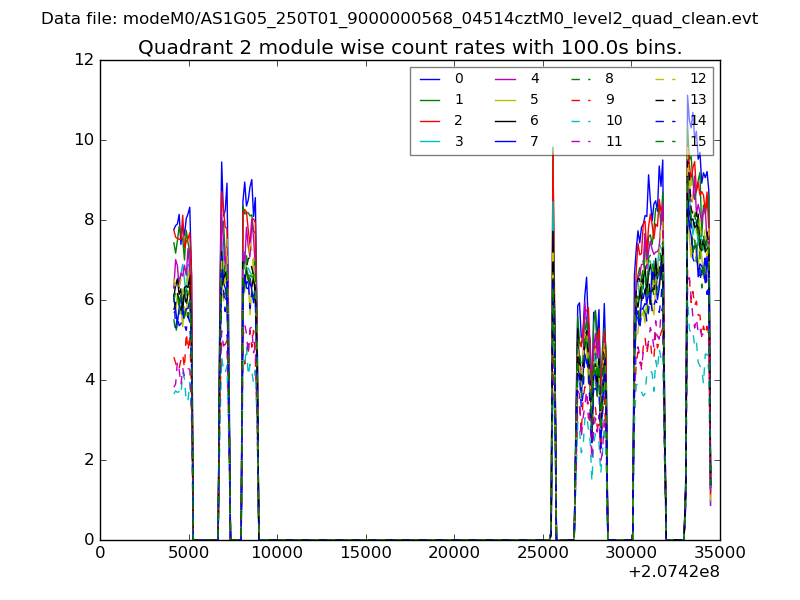 |
 |
| Module-wise count rates for Quadrant D Data is divided into 100 sec bins |
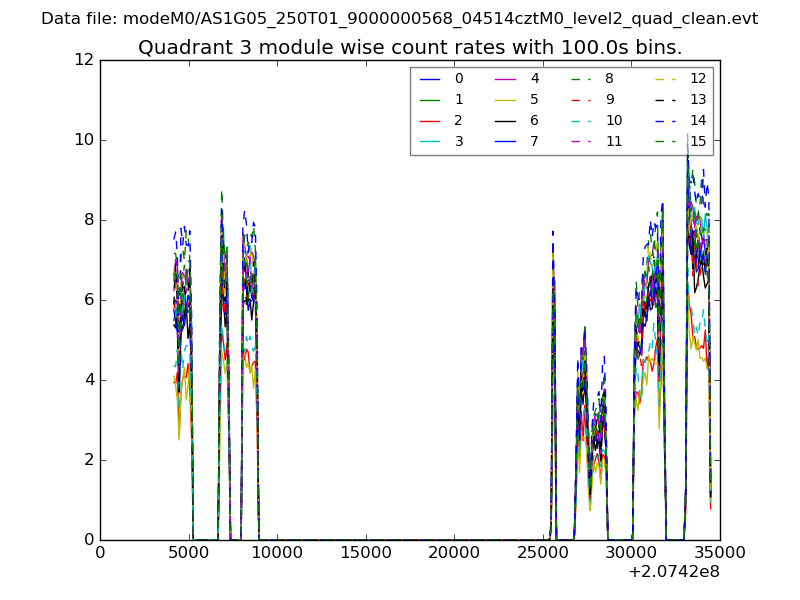 |
 |
| Parameter | Plot |
|---|---|
| CZT HV Monitor | 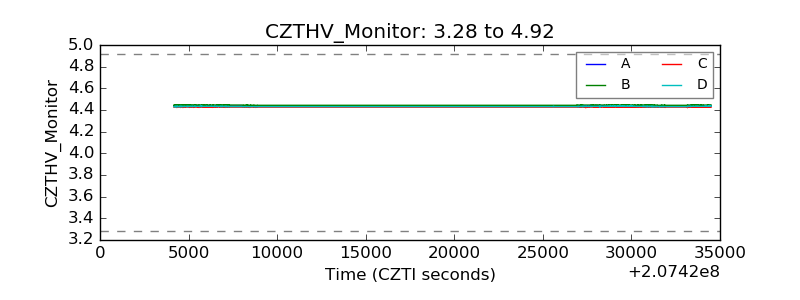 |
| D_VDD | 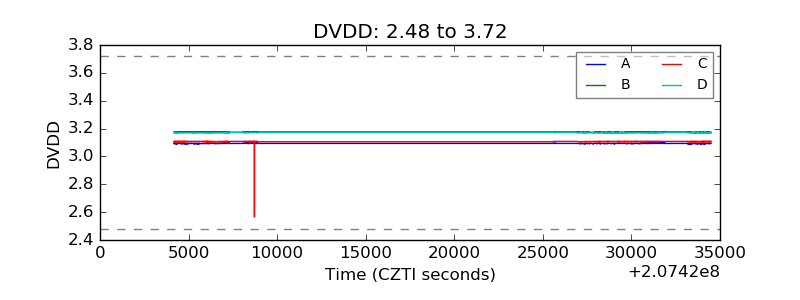 |
| Temperature 1 | 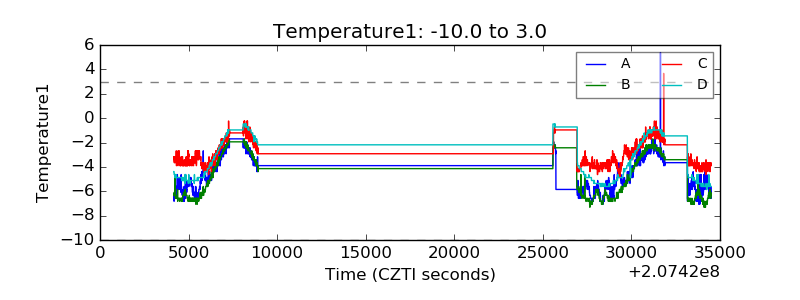 |
| Veto HV Monitor | 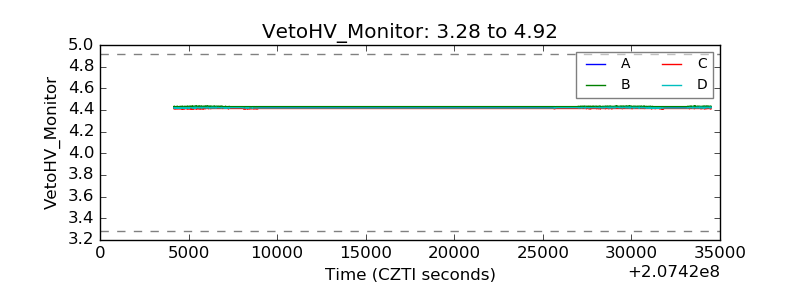 |
| Veto LLD | 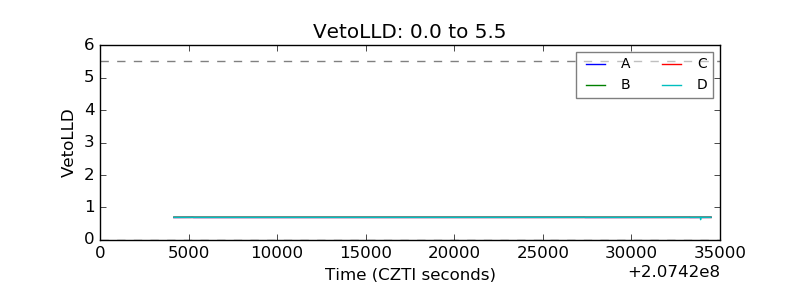 |
| Alpha Counter | 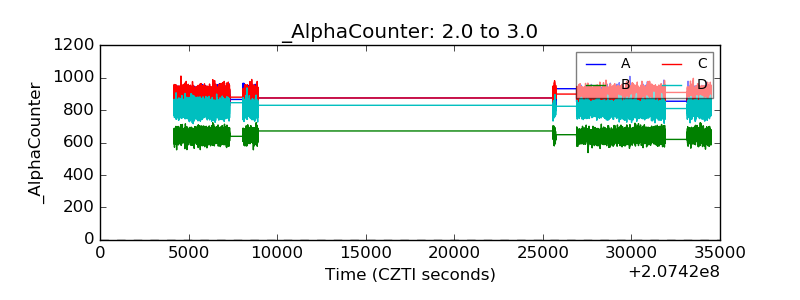 |
| _CPM_Rate | 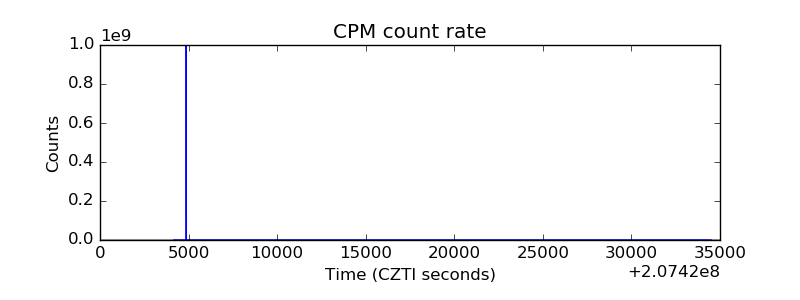 |
| CZT Counter | 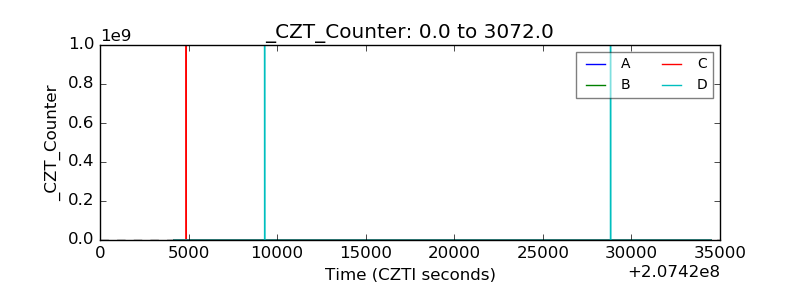 |
| +2.5 Volts monitor |  |
| +5 Volts monitor | 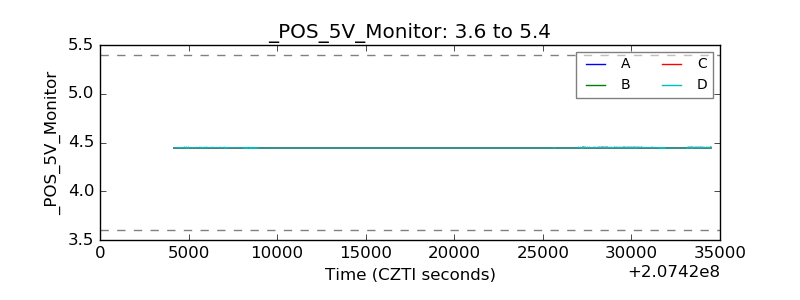 |
| _ROLL_ROT | 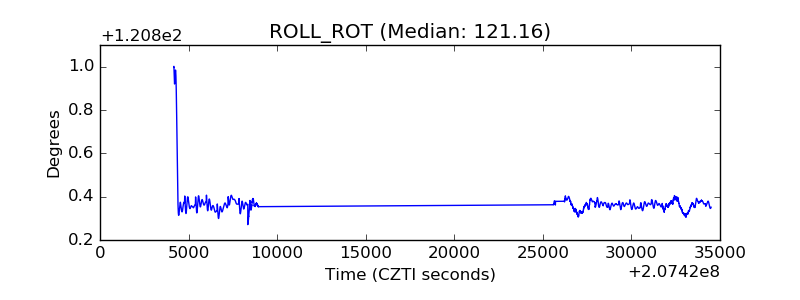 |
| _Roll_DEC | 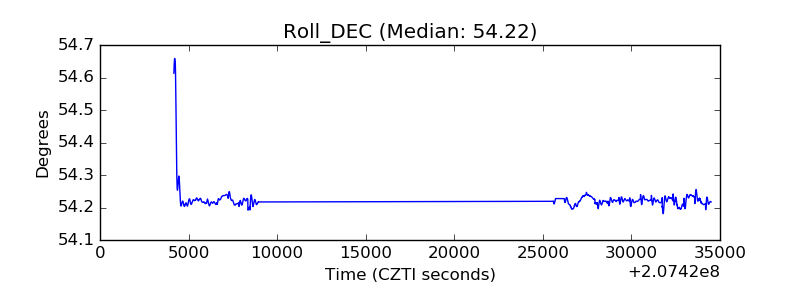 |
| _Roll_RA | 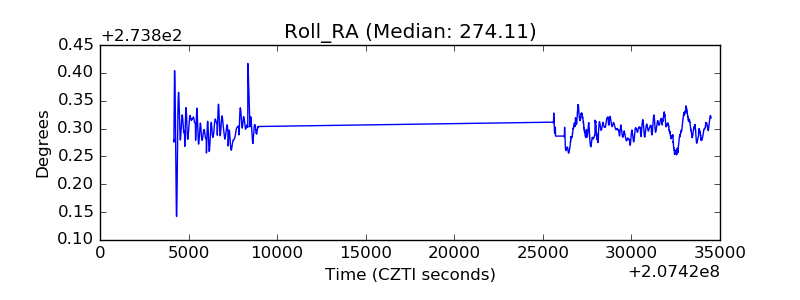 |
| Veto Counter | 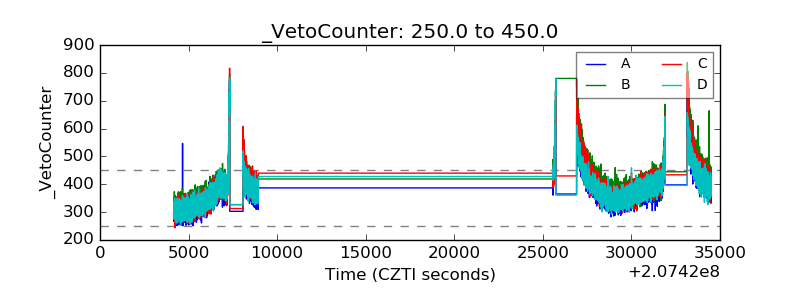 |