| Param | Original file | Final file |
|---|---|---|
| Filename | modeM0/AS1G05_250T01_9000000568_04515cztM0_level2.evt | modeM0/AS1G05_250T01_9000000568_04515cztM0_level2_quad_clean.evt |
| Size (bytes) | 463,654,080 | 80,159,040 |
| Size | 442.2 MB | 76.4 MB |
| Events in quadrant A | 3,601,573 | 502,379 |
| Events in quadrant B | 3,217,781 | 506,572 |
| Events in quadrant C | 2,946,503 | 493,203 |
| Events in quadrant D | 3,832,504 | 470,018 |
| Mode M0 | |||
|---|---|---|---|
| Quadrant | BADHDUFLAG | Total packets | Discarded packets |
| A | 0 | 15016 | 3 |
| B | 0 | 13838 | 2 |
| C | 0 | 13324 | 2 |
| D | 0 | 15974 | 2 |
| Mode SS | |||
|---|---|---|---|
| Quadrant | BADHDUFLAG | Total packets | Discarded packets |
| A | 0 | 132 | 0 |
| B | 0 | 132 | 0 |
| C | 0 | 132 | 0 |
| D | 0 | 132 | 0 |
| Mode M9 | |||
|---|---|---|---|
| Quadrant | BADHDUFLAG | Total packets | Discarded packets |
| A | 0 | 18 | 0 |
| B | 0 | 18 | 0 |
| C | 0 | 18 | 0 |
| D | 0 | 19 | 0 |
| Quadrant | Total seconds | Saturated seconds | Saturation percentage |
|---|---|---|---|
| A | 6527 | 126 | 1.930443% |
| B | 6527 | 40 | 0.612839% |
| C | 6527 | 12 | 0.183852% |
| D | 6527 | 109 | 1.669986% |
Noise dominated data is calculated using 1-second bins in cleaned event files. If a bin has >2000 counts, and if more than 50% of those come from <1% of pixels, then it is considered to be noise-dominated and hence unusable.
| Quadrant | # 1 sec bins | Bins with >0 counts | Bins with >2000 counts | High rate bins dominated by noise | Noise dominated (total time) | Noise dominated (detector-on time) | Marked lightcurve |
|---|---|---|---|---|---|---|---|
| A | 7852 | 6528 | 68 | 68 | 0.87% | 1.04% | 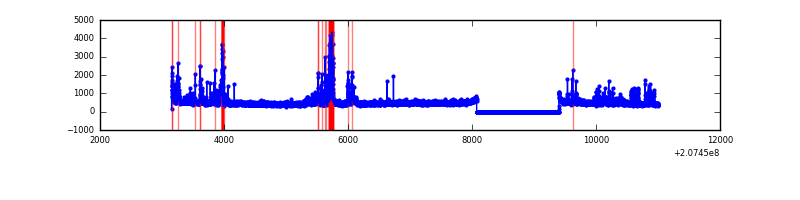 |
| B | 7852 | 6528 | 13 | 13 | 0.17% | 0.20% | 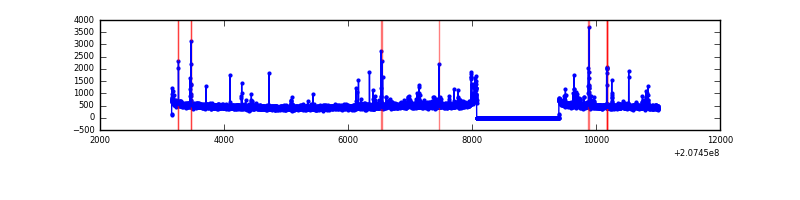 |
| C | 7852 | 6528 | 0 | 0 | 0.00% | 0.00% | 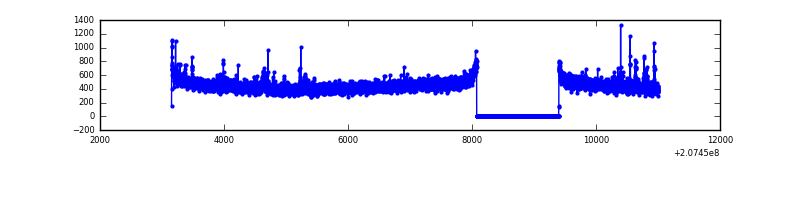 |
| D | 7852 | 6528 | 57 | 57 | 0.73% | 0.87% | 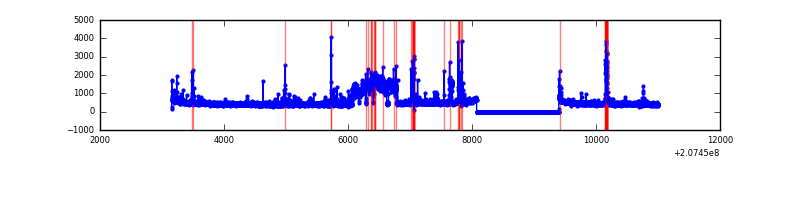 |
Top three noisy pixels from each quadrant. If the there are fewer than three noisy pixels in the level2.evt file, extra rows are filled as -1
| Pixel properties | Quadrant properties | ||||||
|---|---|---|---|---|---|---|---|
| Quadrant | DetID | PixID | Counts | Sigma | Mean | Median | Sigma |
| A | 0 | 13 | 367393 | 2385.65 | 760 | 746 | 153.7 |
| A | 15 | 234 | 282660 | 1834.32 | 760 | 746 | 153.7 |
| A | 8 | 15 | 23540 | 148.31 | 760 | 746 | 153.7 |
| B | 10 | 16 | 85685 | 580.19 | 776 | 759 | 146.4 |
| B | 4 | 80 | 36900 | 246.9 | 776 | 759 | 146.4 |
| B | 8 | 3 | 34063 | 227.52 | 776 | 759 | 146.4 |
| C | 9 | 247 | 41465 | 239.81 | 737 | 743 | 169.8 |
| C | 14 | 48 | 18486 | 104.49 | 737 | 743 | 169.8 |
| C | 13 | 61 | 6158 | 31.89 | 737 | 743 | 169.8 |
| D | 1 | 20 | 711765 | 4088.58 | 725 | 703 | 173.9 |
| D | 13 | 235 | 190147 | 1089.3 | 725 | 703 | 173.9 |
| D | 13 | 53 | 57402 | 326.02 | 725 | 703 | 173.9 |
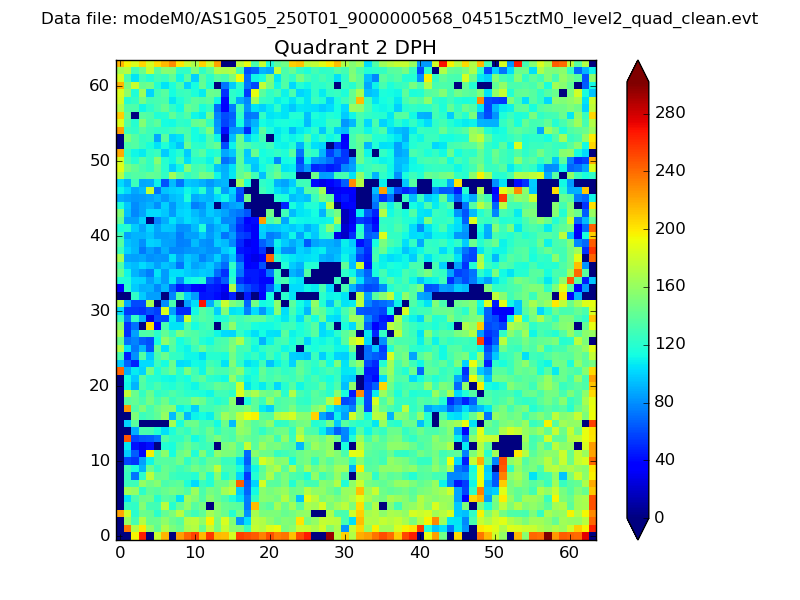
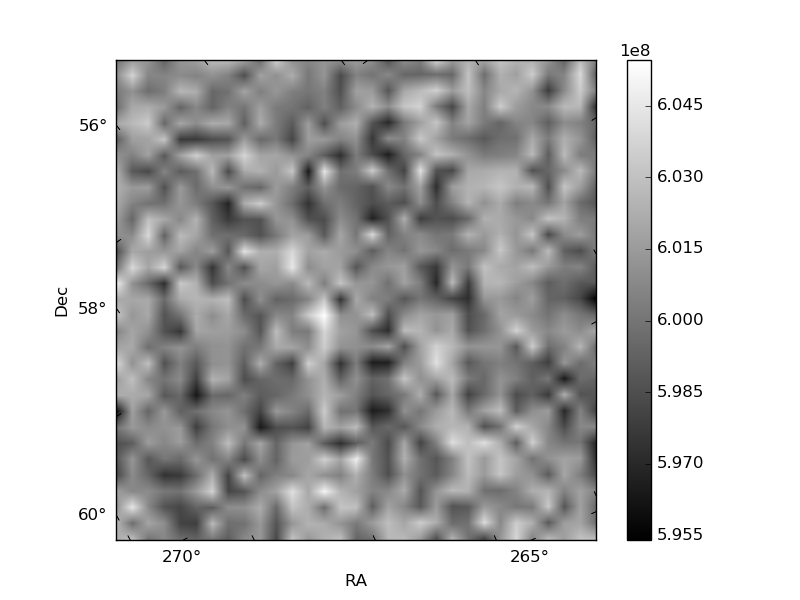
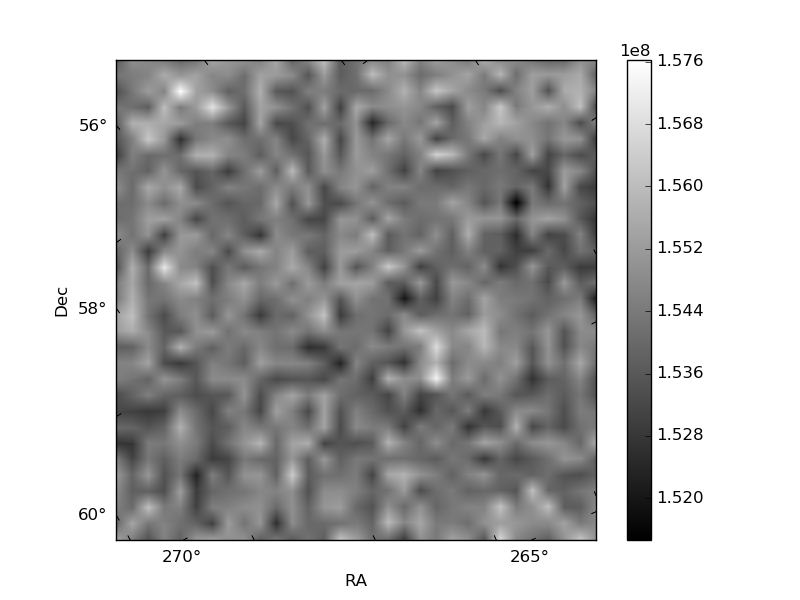
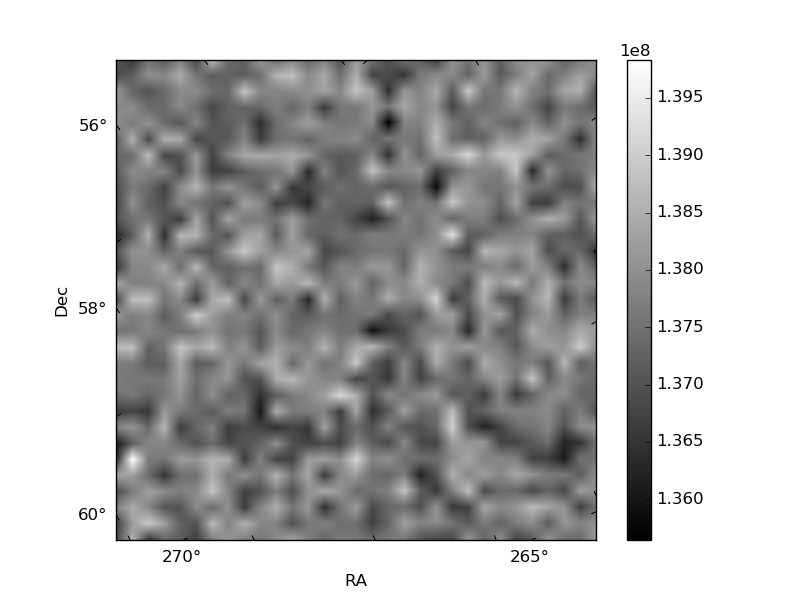
Histogram calculated using DETX and DETY for each event in the final _common_clean file
| Quadrant A | 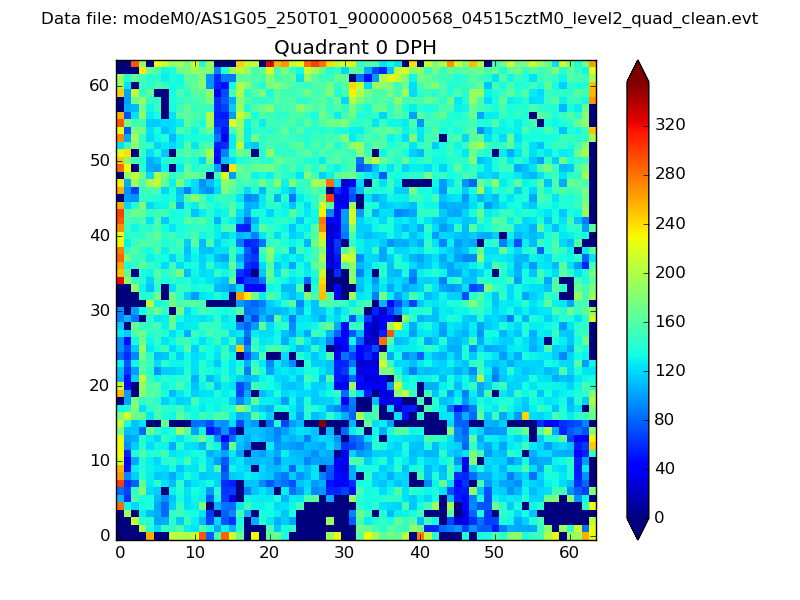 |
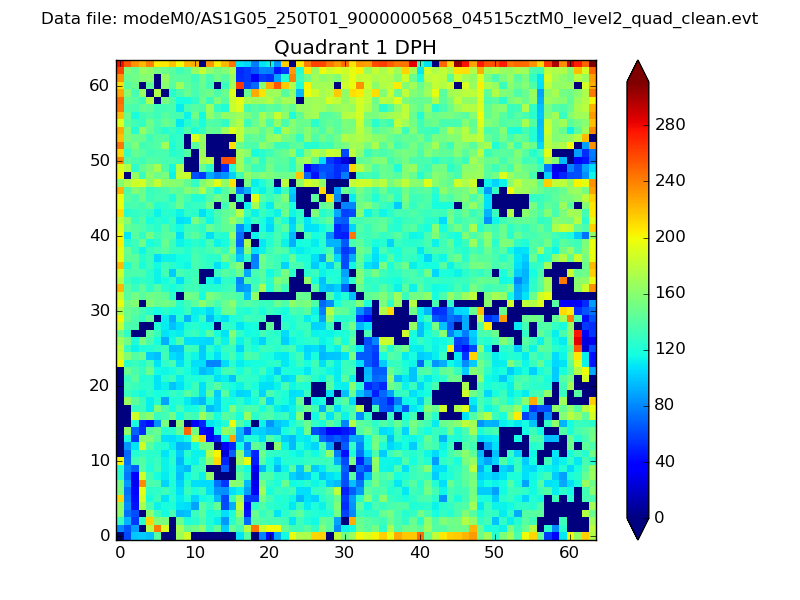 |
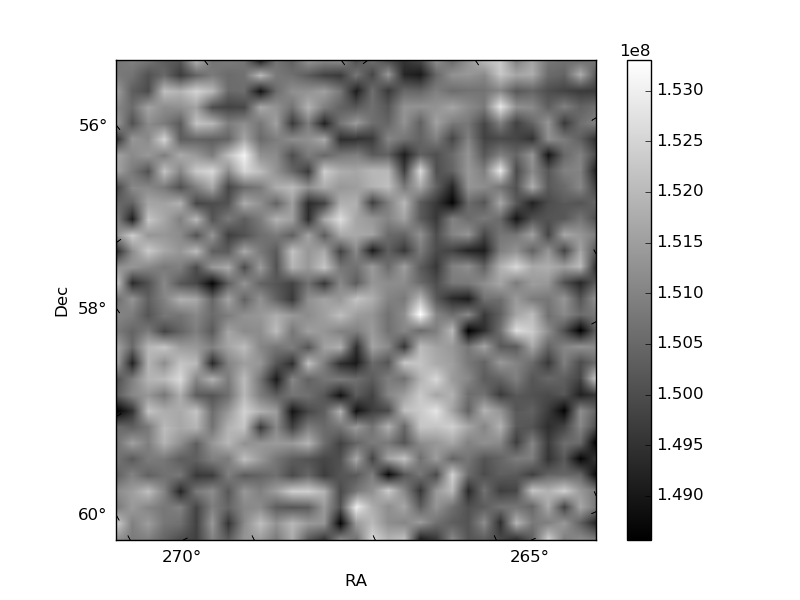
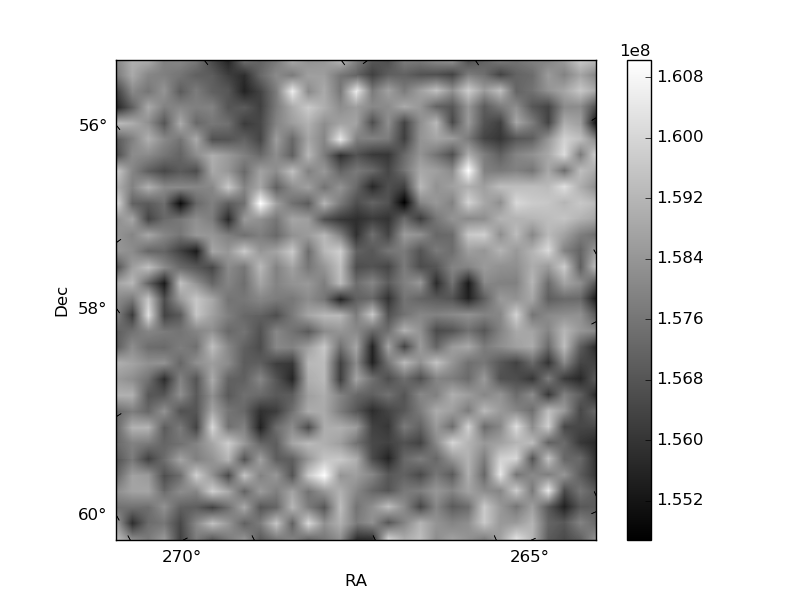
Quadrant B |
|---|---|---|---|
| Quadrant D | 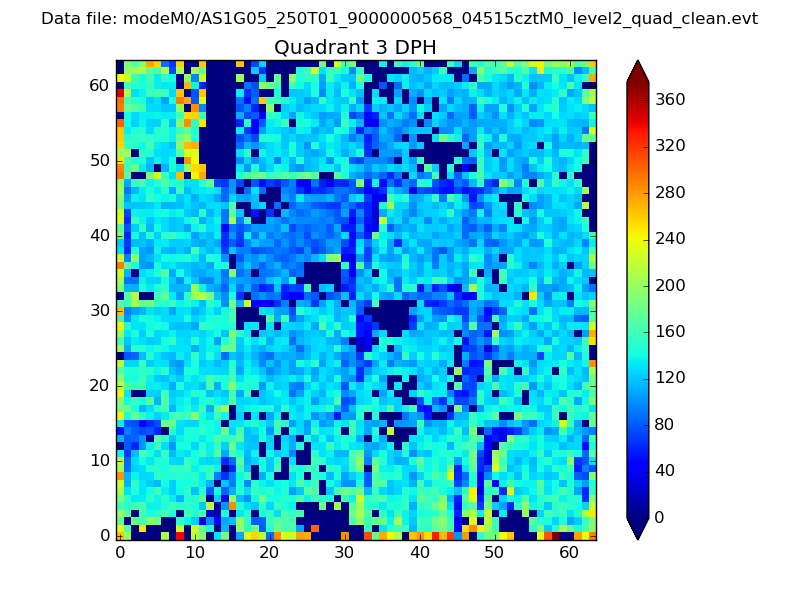 |
 |
Quadrant C |
| Plot type | Count rate plots | Images |
|---|---|---|
| Comparison with Poisson distribution Blue bars denote a histogram of data divided into 1 sec bins. Red curve is a Poisson curve with rate = median count rate of data. |
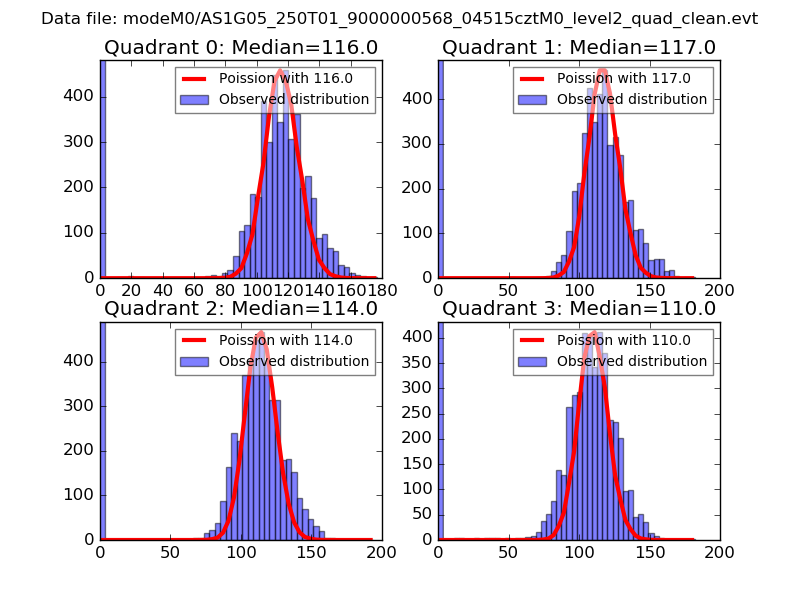 |
 |
| Quadrant-wise count rates Data is divided into 100 sec bins |
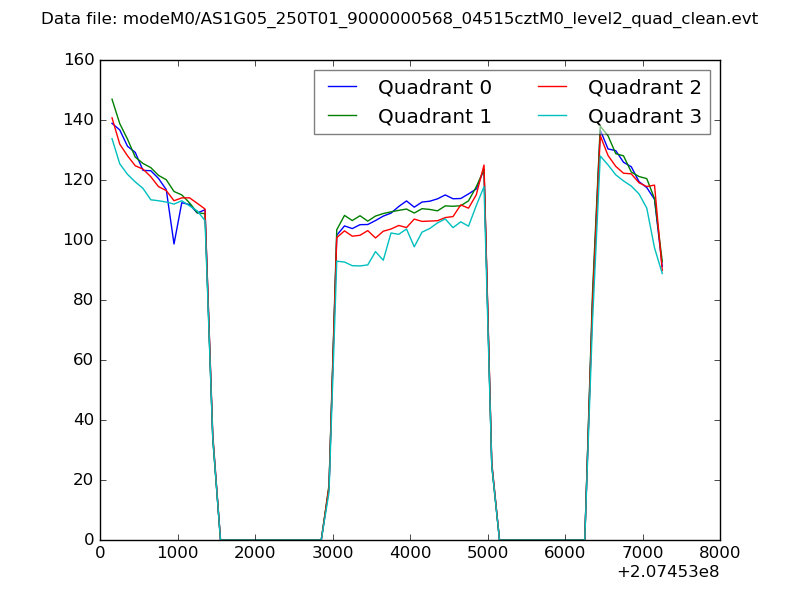 |
|
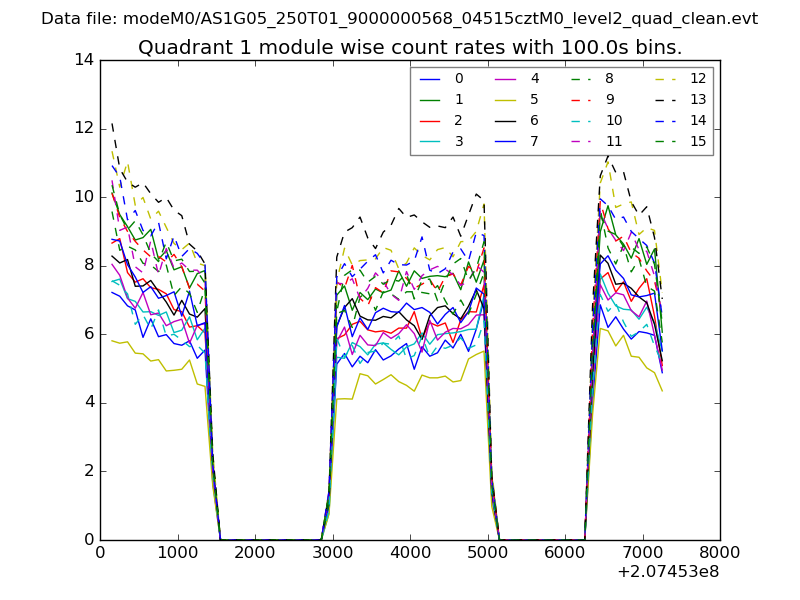
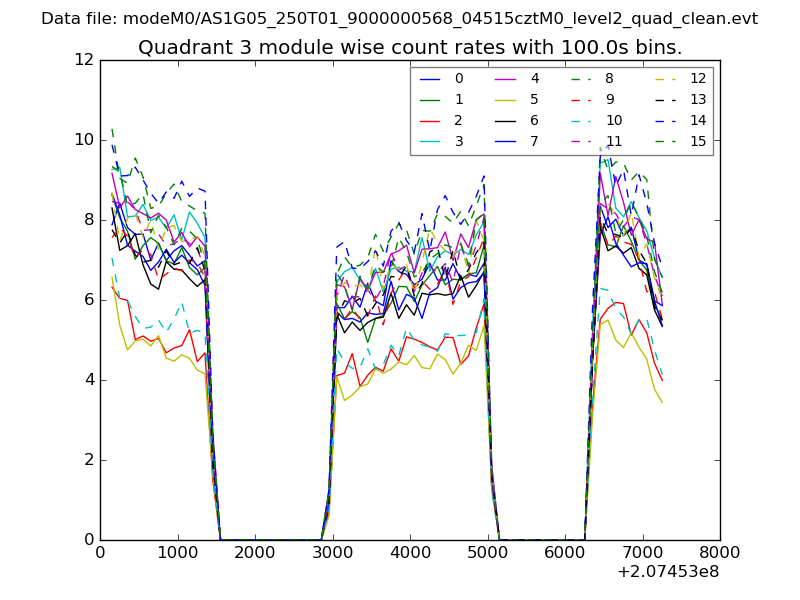
| Module-wise count rates for Quadrant A Data is divided into 100 sec bins |
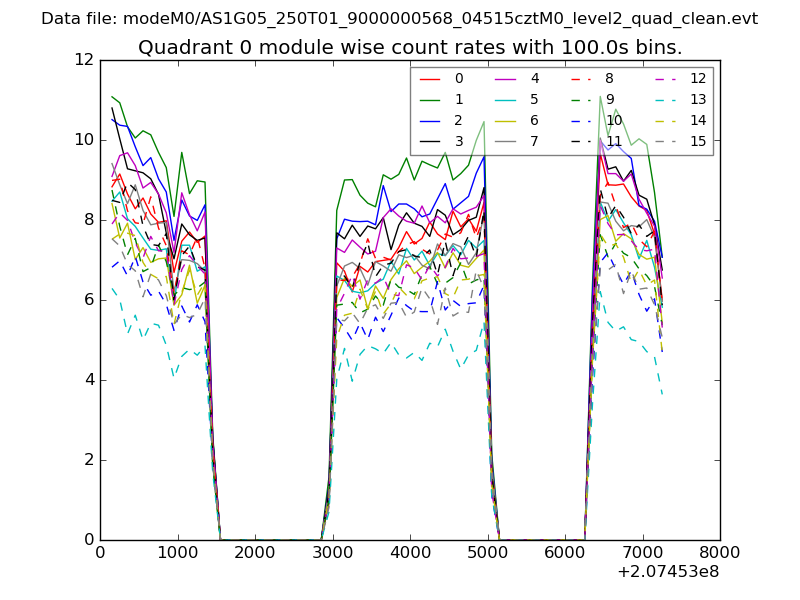 |
 |
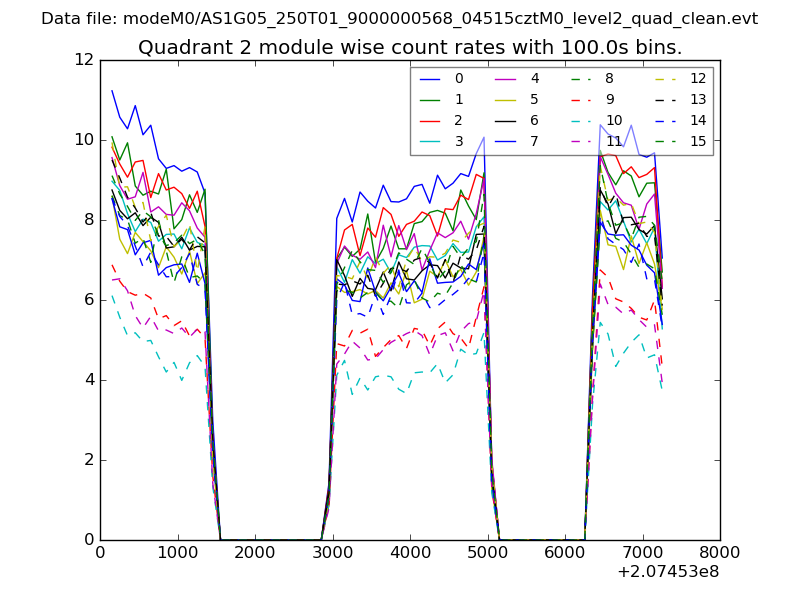
| Module-wise count rates for Quadrant B Data is divided into 100 sec bins |
 |
 |
| Module-wise count rates for Quadrant C Data is divided into 100 sec bins |
 |
 |
| Module-wise count rates for Quadrant D Data is divided into 100 sec bins |
 |
 |
| Parameter | Plot |
|---|---|
| CZT HV Monitor | 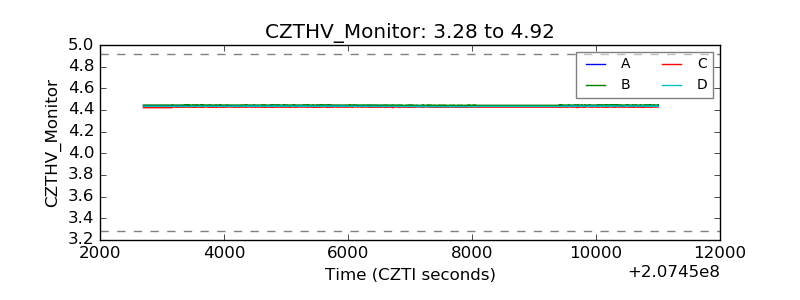 |
| D_VDD | 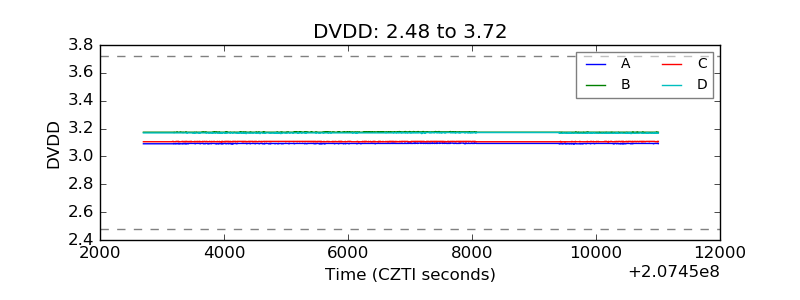 |
| Temperature 1 | 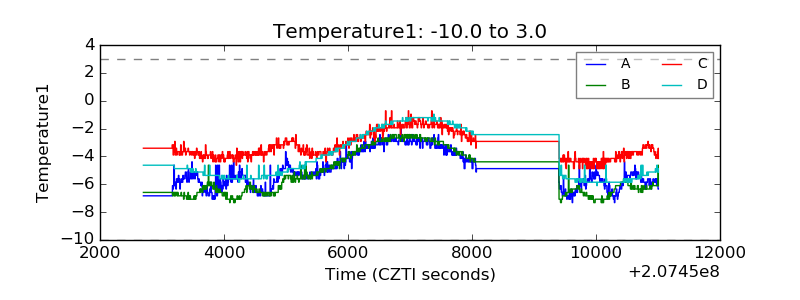 |
| Veto HV Monitor | 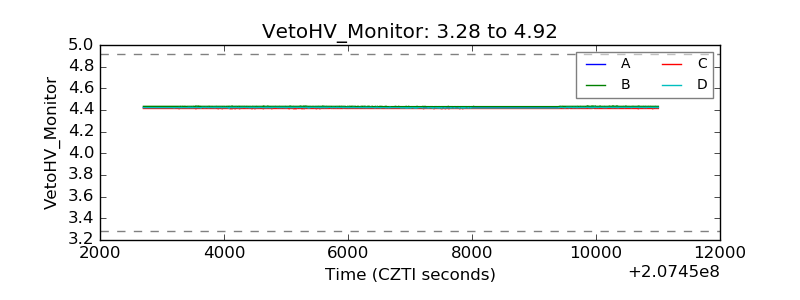 |
| Veto LLD | 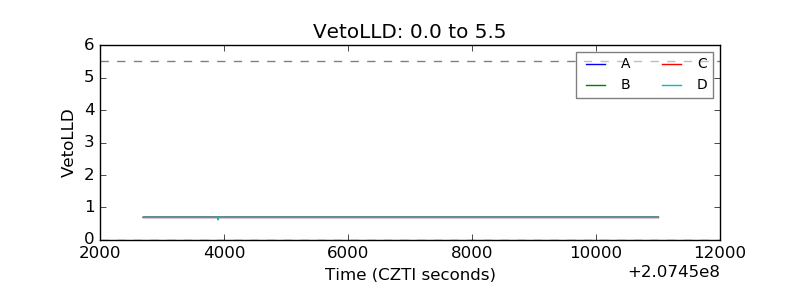 |
| Alpha Counter | 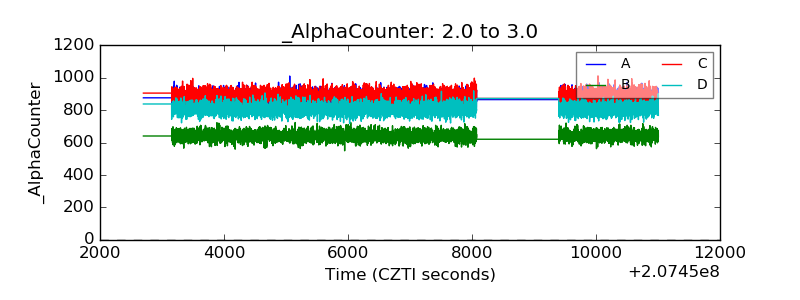 |
| _CPM_Rate | 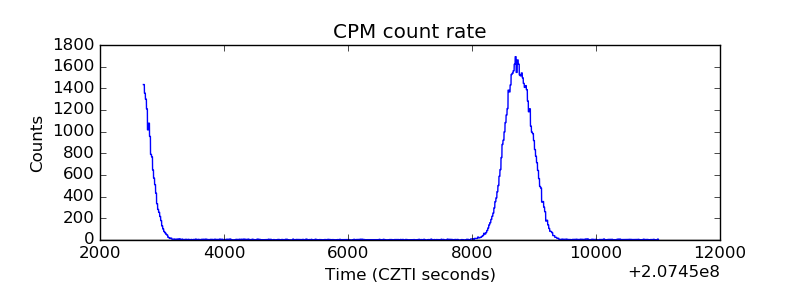 |
| CZT Counter | 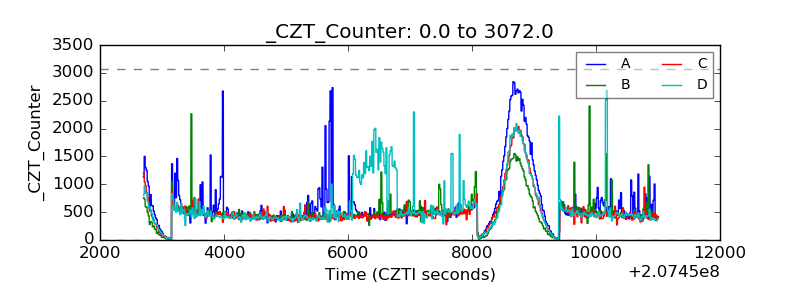 |
| +2.5 Volts monitor |  |
| +5 Volts monitor |  |
| _ROLL_ROT | 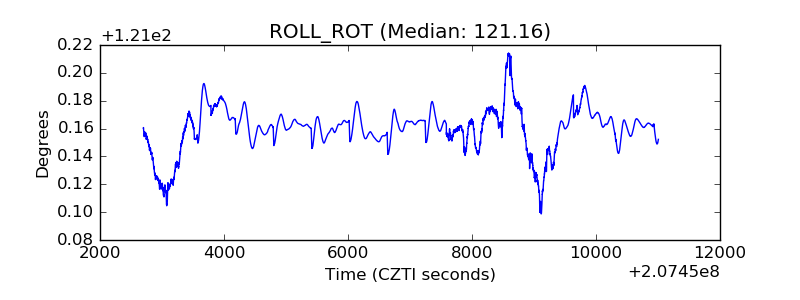 |
| _Roll_DEC | 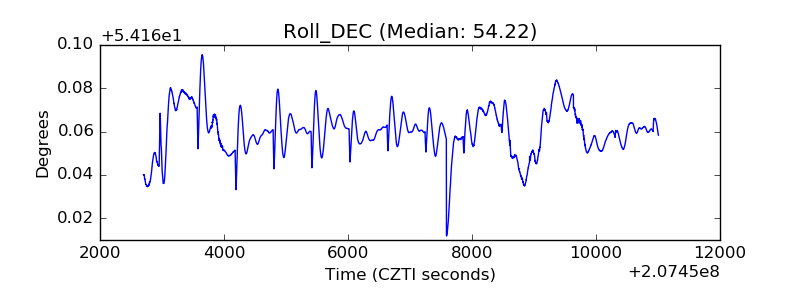 |
| _Roll_RA | 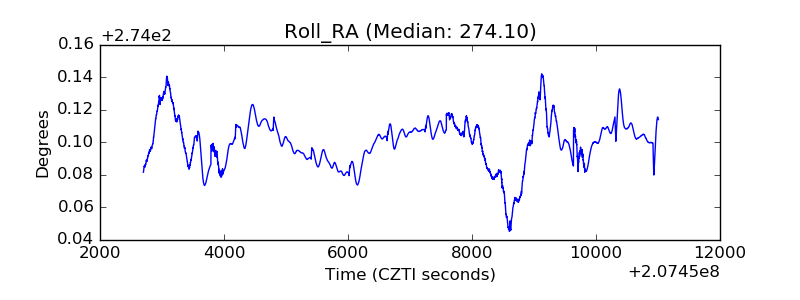 |
| Veto Counter | 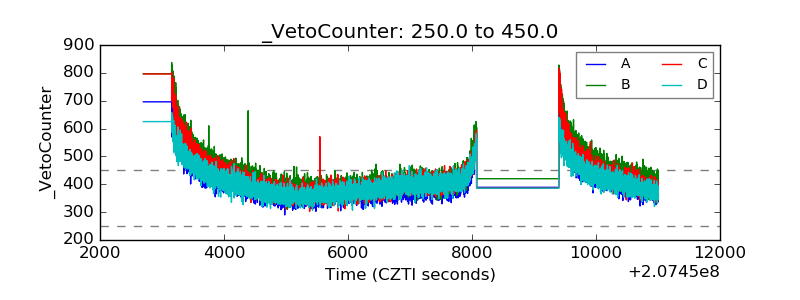 |