| Param | Original file | Final file |
|---|---|---|
| Filename | modeM0/AS1G05_250T01_9000000568_04517cztM0_level2.evt | modeM0/AS1G05_250T01_9000000568_04517cztM0_level2_quad_clean.evt |
| Size (bytes) | 420,304,320 | 57,432,960 |
| Size | 400.8 MB | 54.8 MB |
| Events in quadrant A | 4,100,338 | 332,623 |
| Events in quadrant B | 2,785,534 | 346,367 |
| Events in quadrant C | 2,593,826 | 335,995 |
| Events in quadrant D | 2,861,689 | 325,106 |
| Mode M0 | |||
|---|---|---|---|
| Quadrant | BADHDUFLAG | Total packets | Discarded packets |
| A | 0 | 16067 | 2 |
| B | 0 | 12020 | 1 |
| C | 0 | 11812 | 1 |
| D | 0 | 12646 | 1 |
| Mode SS | |||
|---|---|---|---|
| Quadrant | BADHDUFLAG | Total packets | Discarded packets |
| A | 0 | 116 | 0 |
| B | 0 | 116 | 0 |
| C | 0 | 116 | 0 |
| D | 0 | 116 | 0 |
| Mode M9 | |||
|---|---|---|---|
| Quadrant | BADHDUFLAG | Total packets | Discarded packets |
| A | 0 | 11 | 0 |
| B | 0 | 11 | 0 |
| C | 0 | 11 | 0 |
| D | 0 | 11 | 0 |
| Quadrant | Total seconds | Saturated seconds | Saturation percentage |
|---|---|---|---|
| A | 5698 | 390 | 6.844507% |
| B | 5698 | 89 | 1.561952% |
| C | 5698 | 51 | 0.895051% |
| D | 5698 | 105 | 1.842752% |
Noise dominated data is calculated using 1-second bins in cleaned event files. If a bin has >2000 counts, and if more than 50% of those come from <1% of pixels, then it is considered to be noise-dominated and hence unusable.
| Quadrant | # 1 sec bins | Bins with >0 counts | Bins with >2000 counts | High rate bins dominated by noise | Noise dominated (total time) | Noise dominated (detector-on time) | Marked lightcurve |
|---|---|---|---|---|---|---|---|
| A | 6848 | 5699 | 218 | 218 | 3.18% | 3.83% | 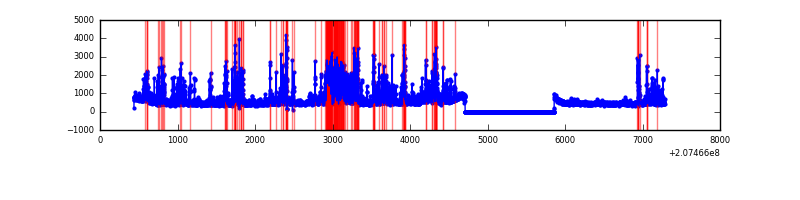 |
| B | 6848 | 5699 | 2 | 2 | 0.03% | 0.04% | 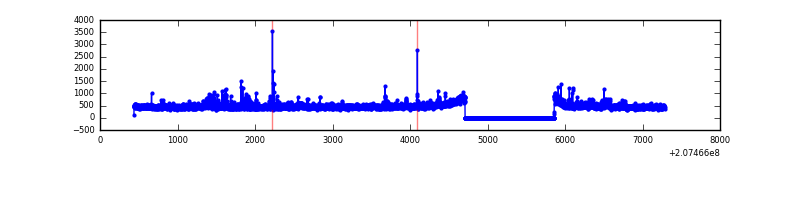 |
| C | 6848 | 5699 | 2 | 2 | 0.03% | 0.04% | 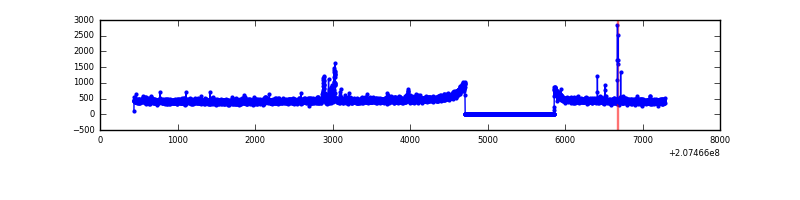 |
| D | 6848 | 5699 | 37 | 37 | 0.54% | 0.65% | 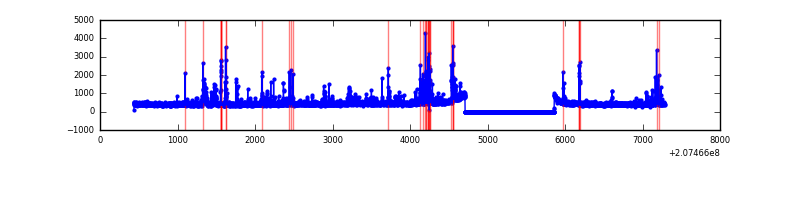 |
Top three noisy pixels from each quadrant. If the there are fewer than three noisy pixels in the level2.evt file, extra rows are filled as -1
| Pixel properties | Quadrant properties | ||||||
|---|---|---|---|---|---|---|---|
| Quadrant | DetID | PixID | Counts | Sigma | Mean | Median | Sigma |
| A | 0 | 13 | 1391536 | 10346.65 | 655 | 638 | 134.4 |
| A | 0 | 50 | 137299 | 1016.6 | 655 | 638 | 134.4 |
| A | 13 | 251 | 24160 | 174.98 | 655 | 638 | 134.4 |
| B | 4 | 80 | 98486 | 770.4 | 671 | 655 | 127.0 |
| B | 15 | 204 | 23341 | 178.65 | 671 | 655 | 127.0 |
| B | 4 | 200 | 22836 | 174.67 | 671 | 655 | 127.0 |
| C | 9 | 247 | 66367 | 443.53 | 642 | 643 | 148.2 |
| C | 14 | 67 | 8842 | 55.33 | 642 | 643 | 148.2 |
| C | 13 | 61 | 5387 | 32.01 | 642 | 643 | 148.2 |
| D | 13 | 235 | 225571 | 1493.98 | 636 | 615 | 150.6 |
| D | 13 | 239 | 54898 | 360.5 | 636 | 615 | 150.6 |
| D | 2 | 136 | 44740 | 293.04 | 636 | 615 | 150.6 |
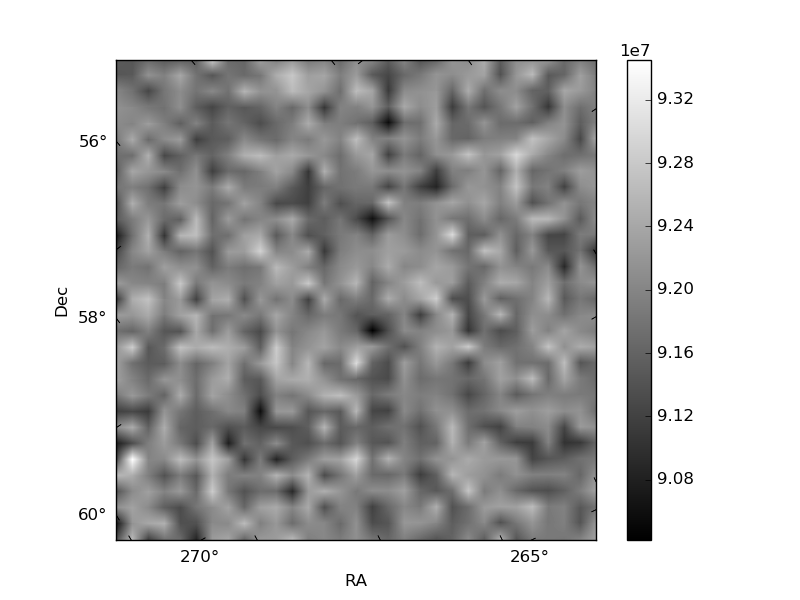
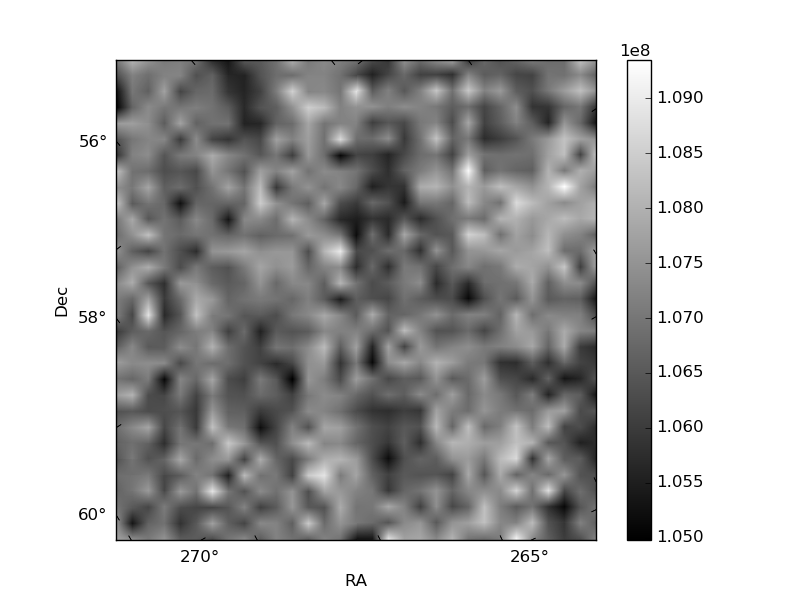
Histogram calculated using DETX and DETY for each event in the final _common_clean file
| Quadrant A | 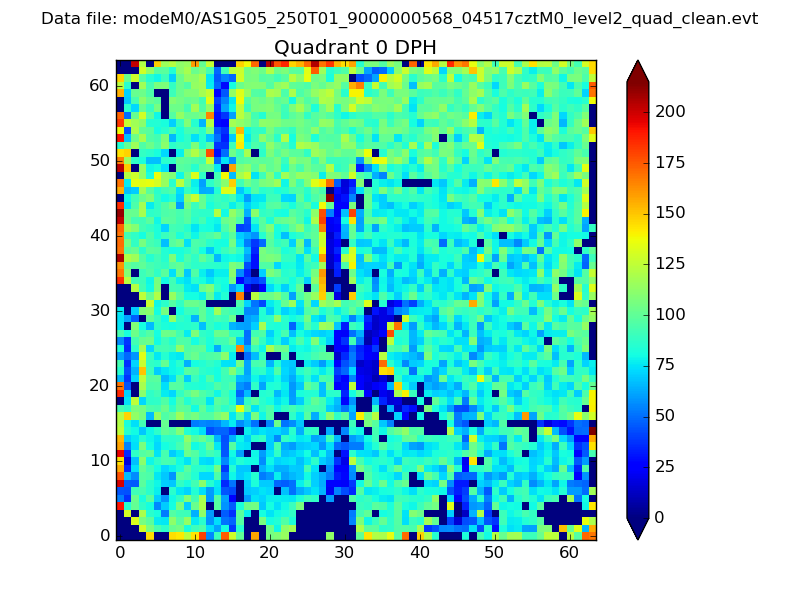 |
 |
Quadrant B |
|---|---|---|---|
| Quadrant D |  |
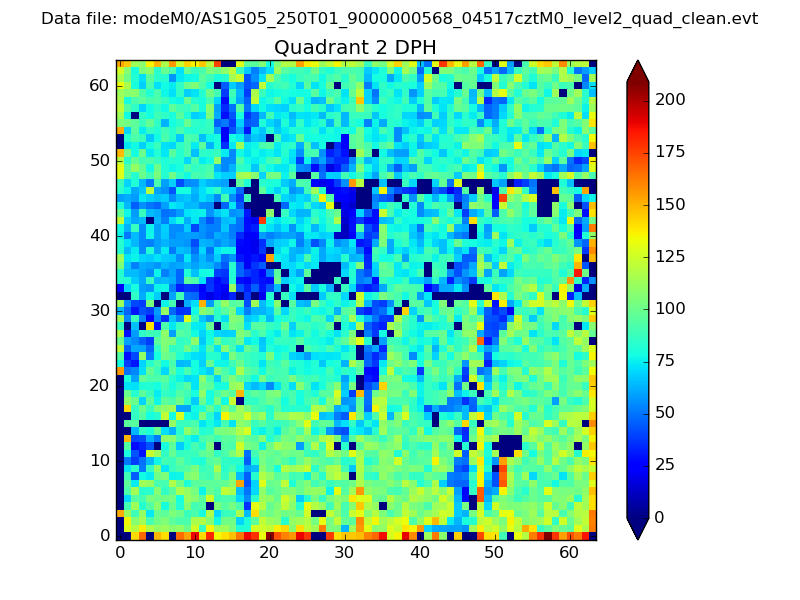 |
Quadrant C |
| Plot type | Count rate plots | Images |
|---|---|---|
| Comparison with Poisson distribution Blue bars denote a histogram of data divided into 1 sec bins. Red curve is a Poisson curve with rate = median count rate of data. |
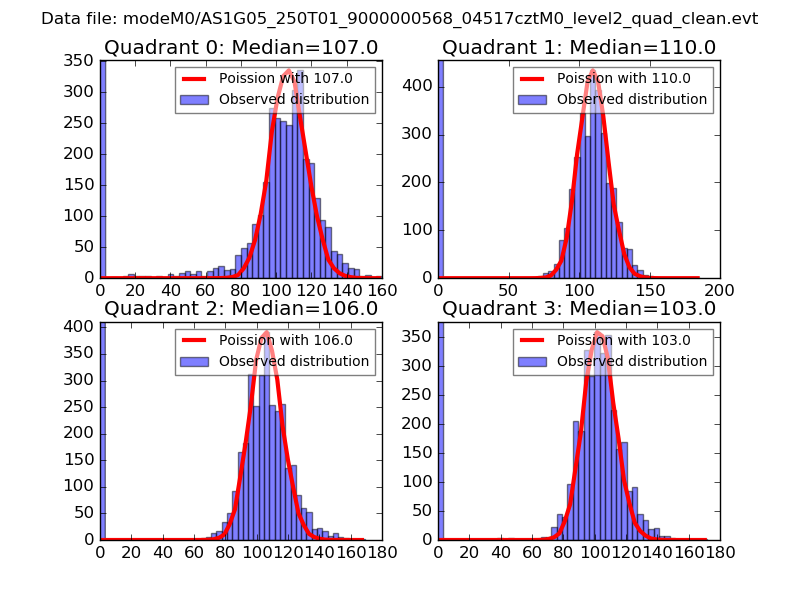 |
 |
| Quadrant-wise count rates Data is divided into 100 sec bins |
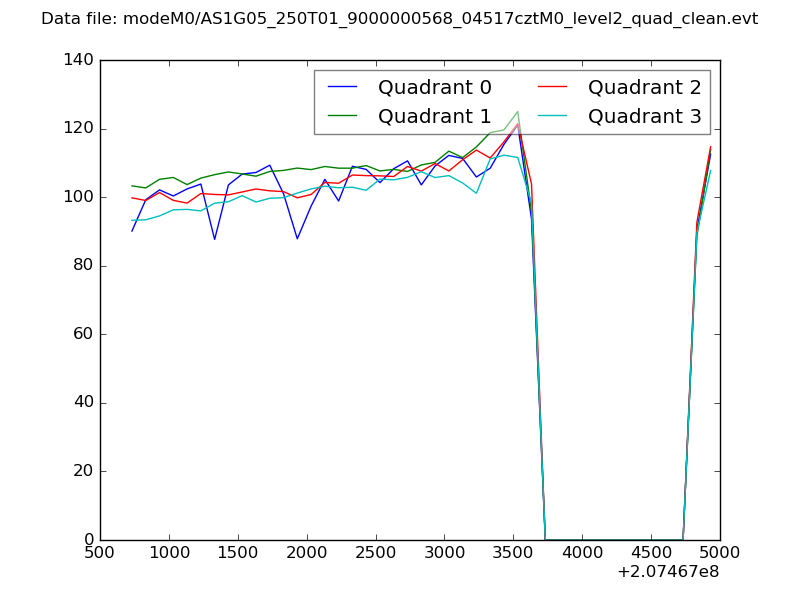 |
|
| Module-wise count rates for Quadrant A Data is divided into 100 sec bins |
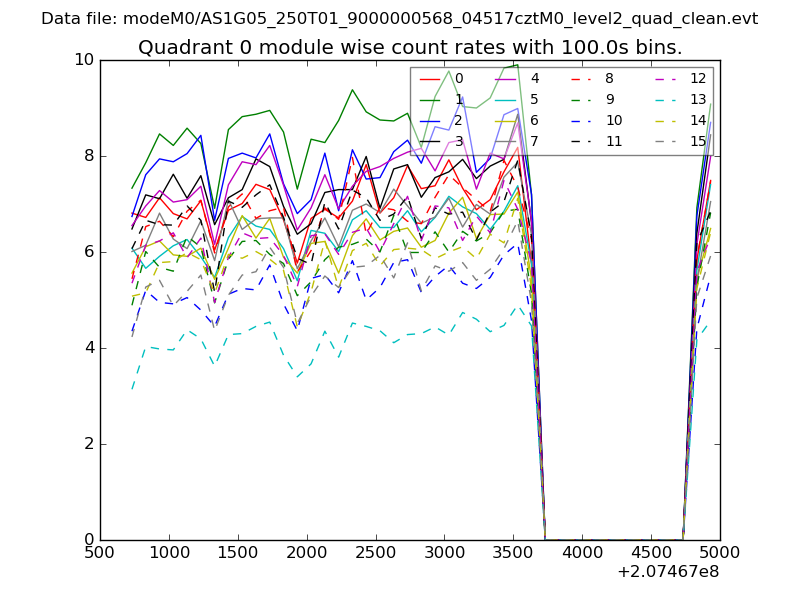 |
 |
| Module-wise count rates for Quadrant B Data is divided into 100 sec bins |
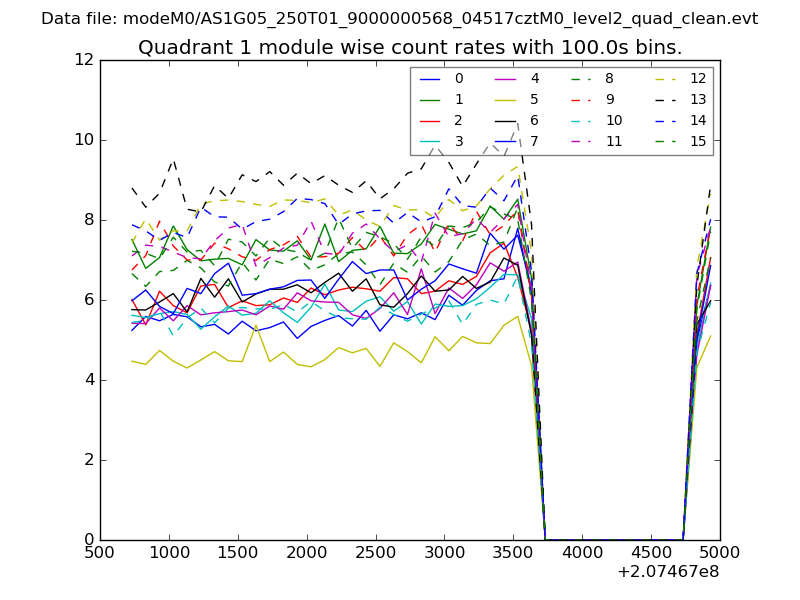 |
 |
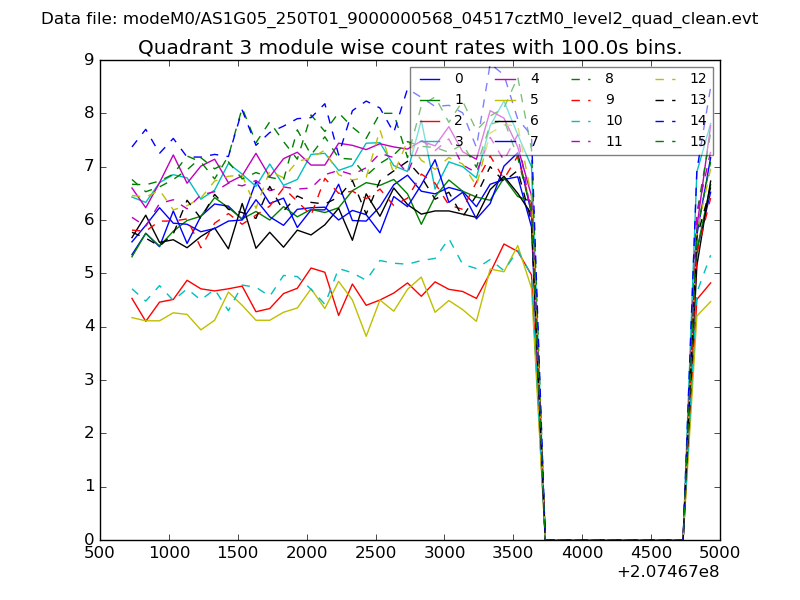
| Module-wise count rates for Quadrant C Data is divided into 100 sec bins |
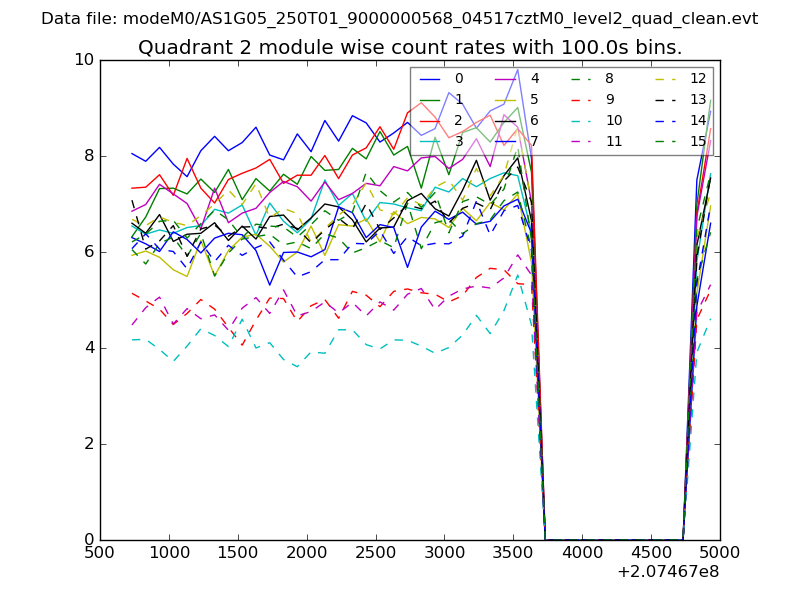 |
 |
| Module-wise count rates for Quadrant D Data is divided into 100 sec bins |
 |
 |
| Parameter | Plot |
|---|---|
| CZT HV Monitor | 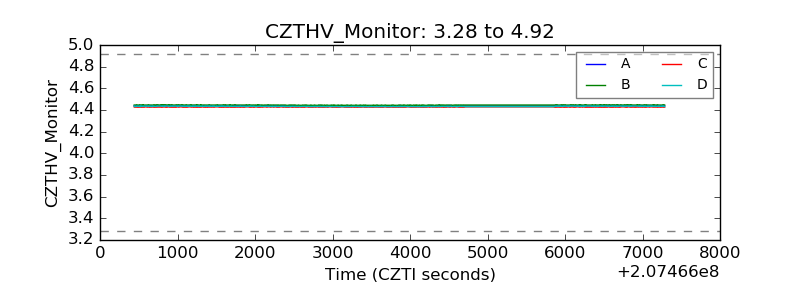 |
| D_VDD | 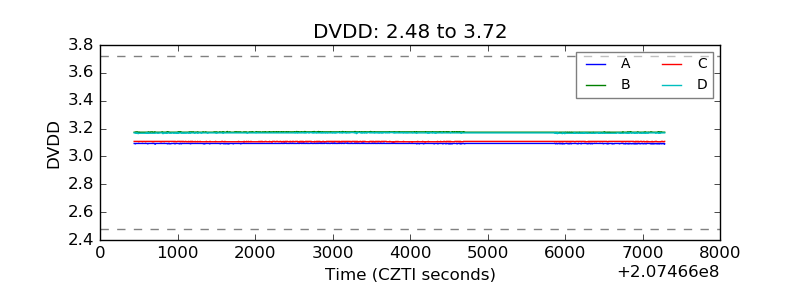 |
| Temperature 1 | 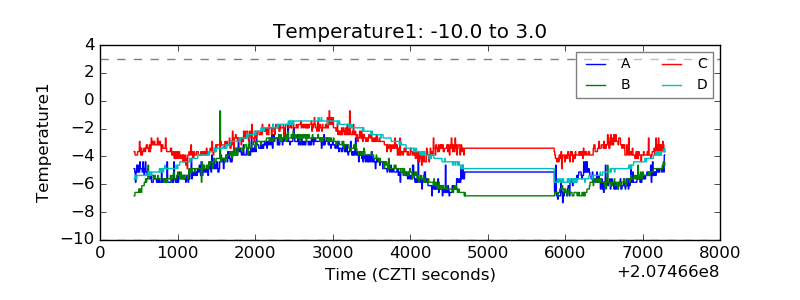 |
| Veto HV Monitor | 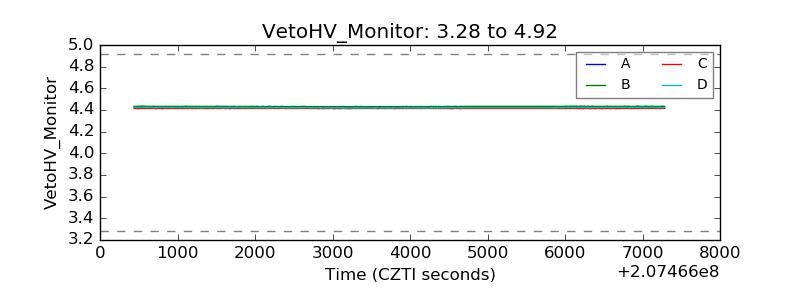 |
| Veto LLD | 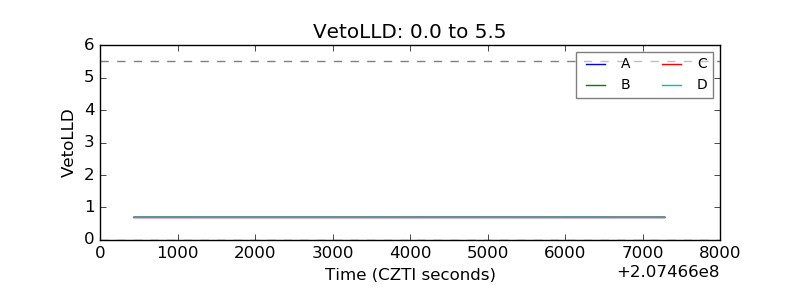 |
| Alpha Counter | 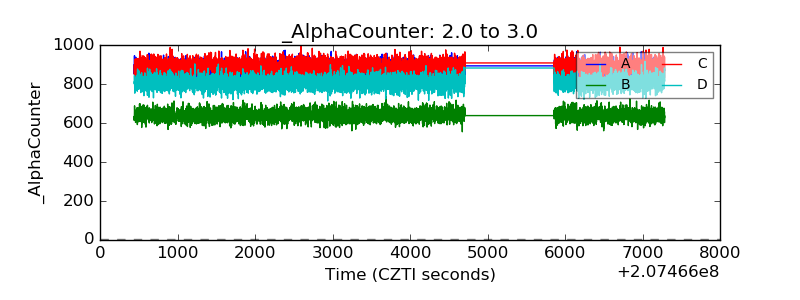 |
| _CPM_Rate | 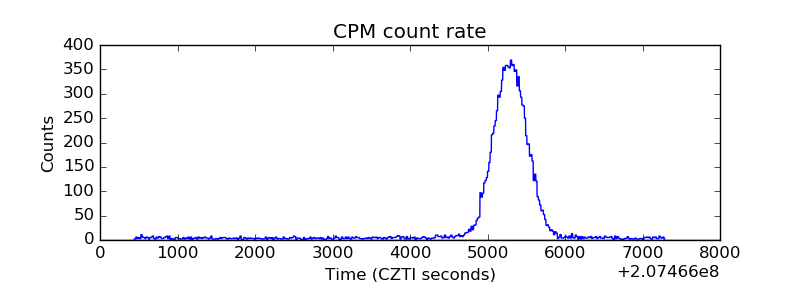 |
| CZT Counter | 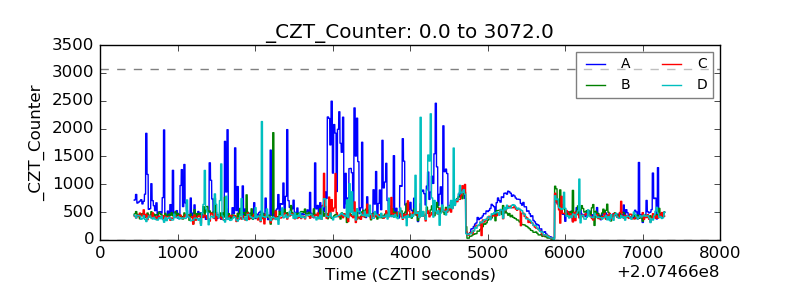 |
| +2.5 Volts monitor |  |
| +5 Volts monitor |  |
| _ROLL_ROT | 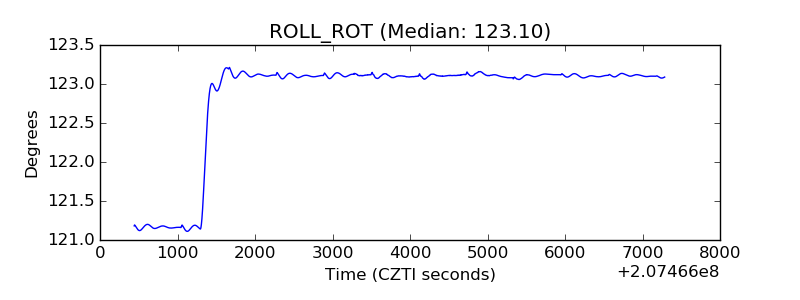 |
| _Roll_DEC | 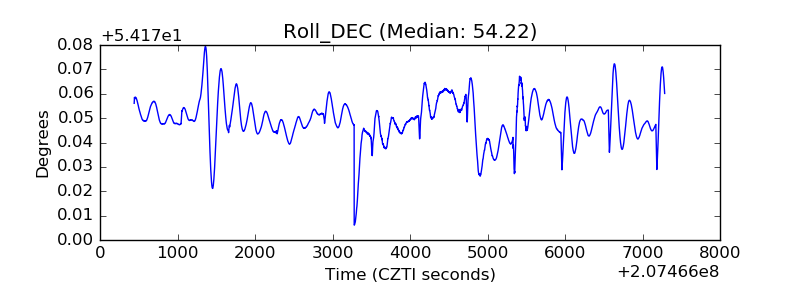 |
| _Roll_RA | 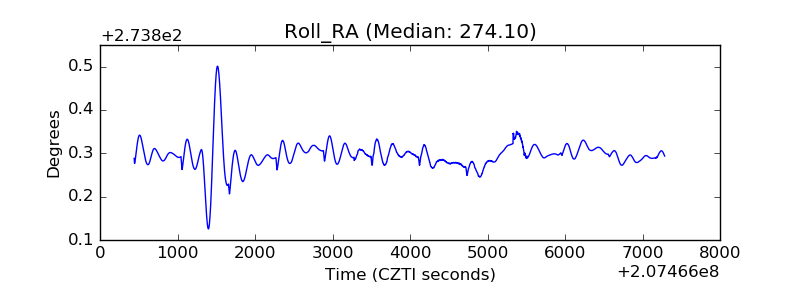 |
| Veto Counter | 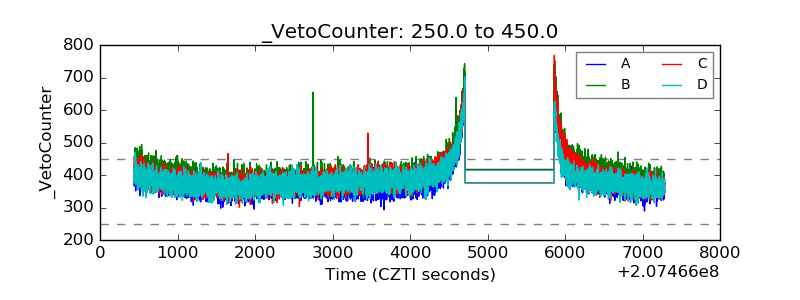 |