| Param | Original file | Final file |
|---|---|---|
| Filename | modeM0/AS1G05_250T01_9000000568_04519cztM0_level2.evt | modeM0/AS1G05_250T01_9000000568_04519cztM0_level2_quad_clean.evt |
| Size (bytes) | 554,901,120 | 84,934,080 |
| Size | 529.2 MB | 81.0 MB |
| Events in quadrant A | 4,852,402 | 515,447 |
| Events in quadrant B | 3,592,607 | 519,982 |
| Events in quadrant C | 3,614,982 | 508,269 |
| Events in quadrant D | 4,229,075 | 499,489 |
| Mode M0 | |||
|---|---|---|---|
| Quadrant | BADHDUFLAG | Total packets | Discarded packets |
| A | 0 | 19692 | 3 |
| B | 0 | 15890 | 2 |
| C | 0 | 16378 | 2 |
| D | 0 | 17951 | 2 |
| Mode SS | |||
|---|---|---|---|
| Quadrant | BADHDUFLAG | Total packets | Discarded packets |
| A | 0 | 154 | 0 |
| B | 0 | 154 | 0 |
| C | 0 | 154 | 0 |
| D | 0 | 154 | 0 |
| Mode M9 | |||
|---|---|---|---|
| Quadrant | BADHDUFLAG | Total packets | Discarded packets |
| A | 0 | 4 | 0 |
| B | 0 | 4 | 0 |
| C | 0 | 4 | 0 |
| D | 0 | 4 | 0 |
| Quadrant | Total seconds | Saturated seconds | Saturation percentage |
|---|---|---|---|
| A | 7605 | 517 | 6.798159% |
| B | 7605 | 240 | 3.155819% |
| C | 7605 | 224 | 2.945431% |
| D | 7606 | 427 | 5.613989% |
Noise dominated data is calculated using 1-second bins in cleaned event files. If a bin has >2000 counts, and if more than 50% of those come from <1% of pixels, then it is considered to be noise-dominated and hence unusable.
| Quadrant | # 1 sec bins | Bins with >0 counts | Bins with >2000 counts | High rate bins dominated by noise | Noise dominated (total time) | Noise dominated (detector-on time) | Marked lightcurve |
|---|---|---|---|---|---|---|---|
| A | 7940 | 7608 | 212 | 212 | 2.67% | 2.79% | 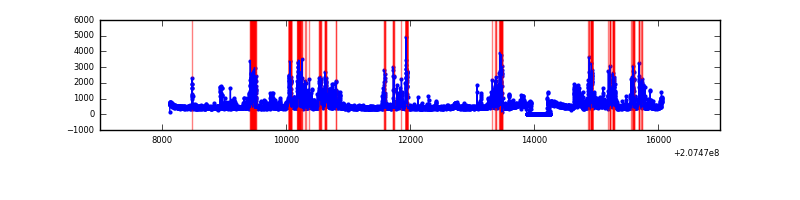 |
| B | 7940 | 7608 | 9 | 9 | 0.11% | 0.12% | 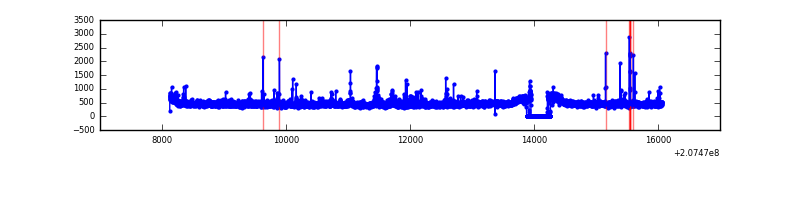 |
| C | 7940 | 7608 | 40 | 40 | 0.50% | 0.53% |  |
| D | 7941 | 7609 | 205 | 205 | 2.58% | 2.69% | 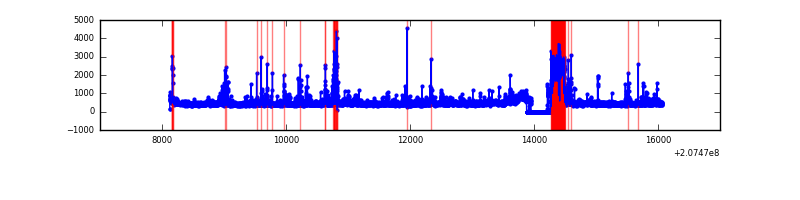 |
Top three noisy pixels from each quadrant. If the there are fewer than three noisy pixels in the level2.evt file, extra rows are filled as -1
| Pixel properties | Quadrant properties | ||||||
|---|---|---|---|---|---|---|---|
| Quadrant | DetID | PixID | Counts | Sigma | Mean | Median | Sigma |
| A | 0 | 13 | 1252194 | 7081.91 | 856 | 838 | 176.7 |
| A | 0 | 50 | 258841 | 1460.14 | 856 | 838 | 176.7 |
| A | 8 | 15 | 23591 | 128.77 | 856 | 838 | 176.7 |
| B | 8 | 3 | 65097 | 380.71 | 875 | 852 | 168.8 |
| B | 4 | 48 | 60156 | 351.43 | 875 | 852 | 168.8 |
| B | 4 | 80 | 58465 | 341.41 | 875 | 852 | 168.8 |
| C | 9 | 247 | 316213 | 1625.51 | 839 | 842 | 194.0 |
| C | 9 | 54 | 9012 | 42.11 | 839 | 842 | 194.0 |
| C | 13 | 61 | 6697 | 30.18 | 839 | 842 | 194.0 |
| D | 9 | 35 | 561462 | 2854.3 | 813 | 787 | 196.4 |
| D | 13 | 235 | 311840 | 1583.52 | 813 | 787 | 196.4 |
| D | 2 | 136 | 72710 | 366.15 | 813 | 787 | 196.4 |
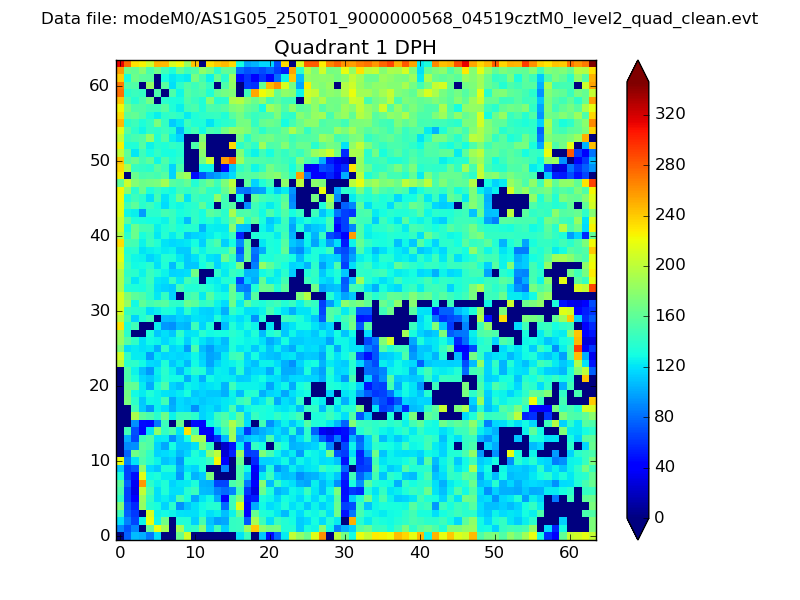
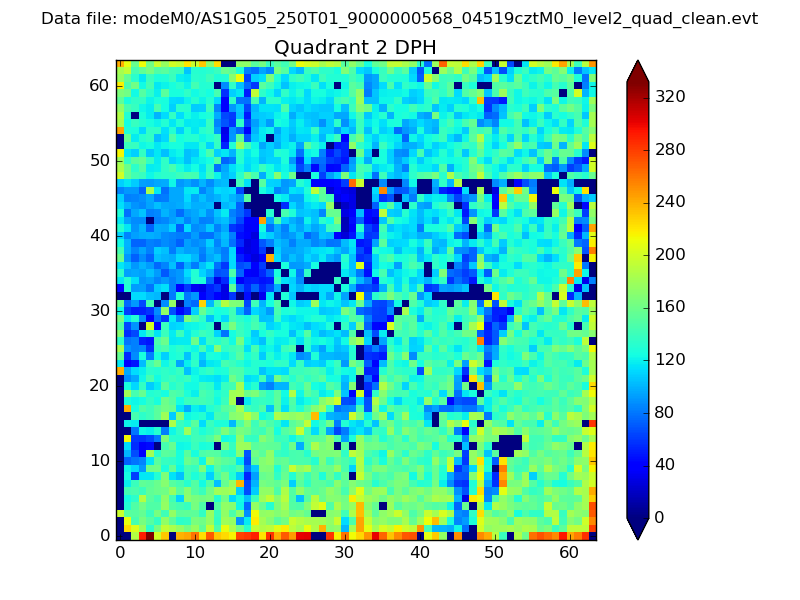
Histogram calculated using DETX and DETY for each event in the final _common_clean file
| Quadrant A | 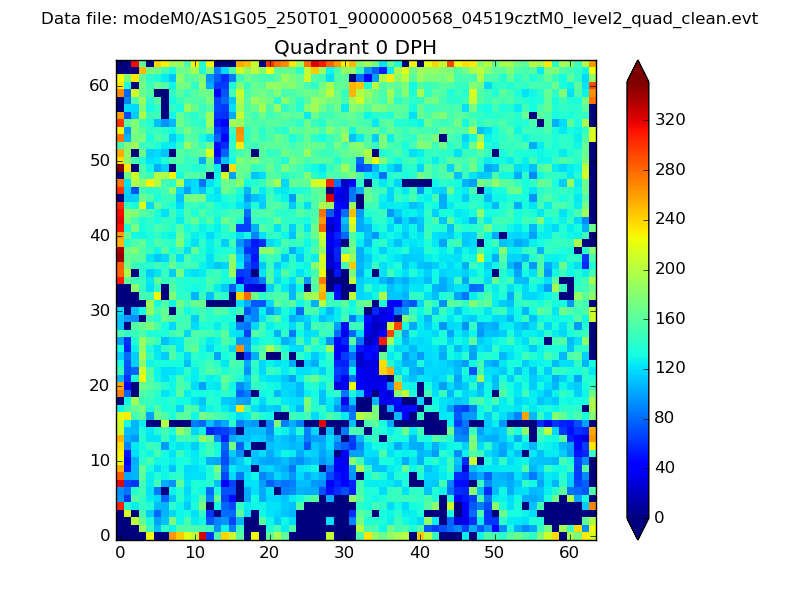 |
 |
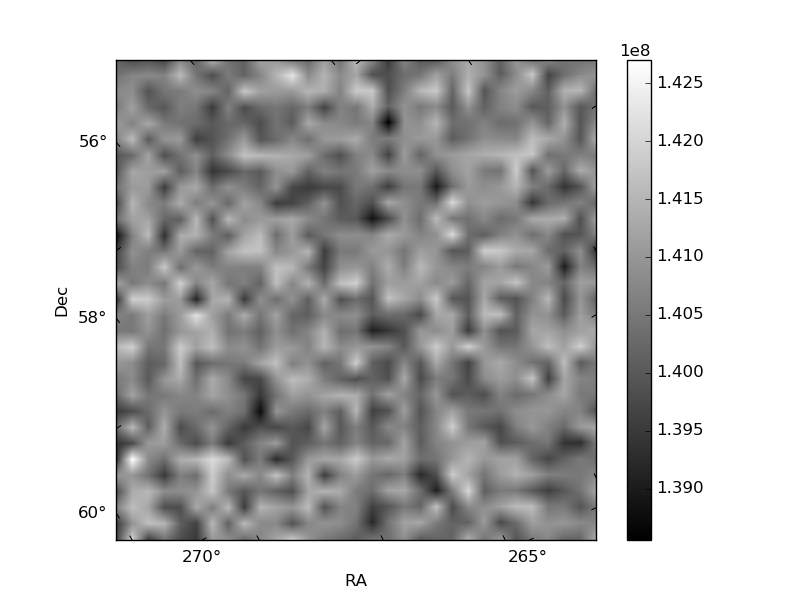
Quadrant B |
|---|---|---|---|
| Quadrant D |  |
 |
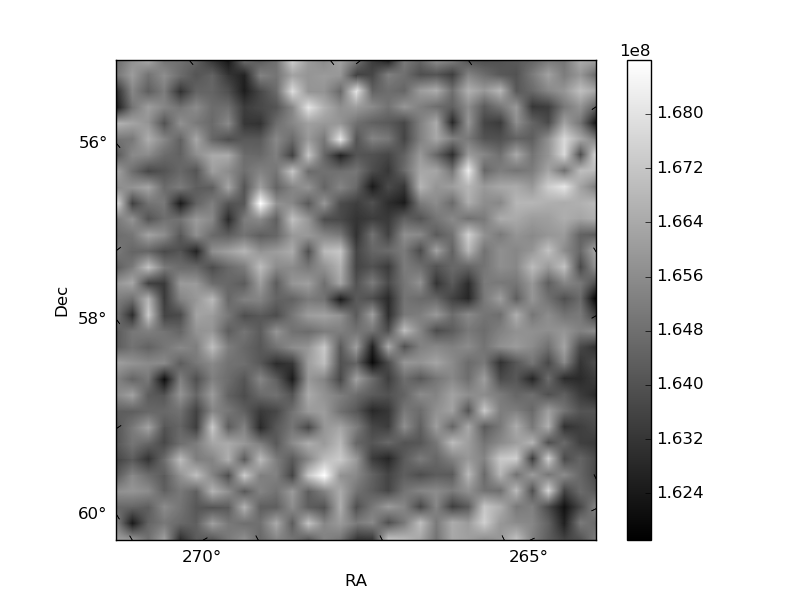
Quadrant C |
| Plot type | Count rate plots | Images |
|---|---|---|
| Comparison with Poisson distribution Blue bars denote a histogram of data divided into 1 sec bins. Red curve is a Poisson curve with rate = median count rate of data. |
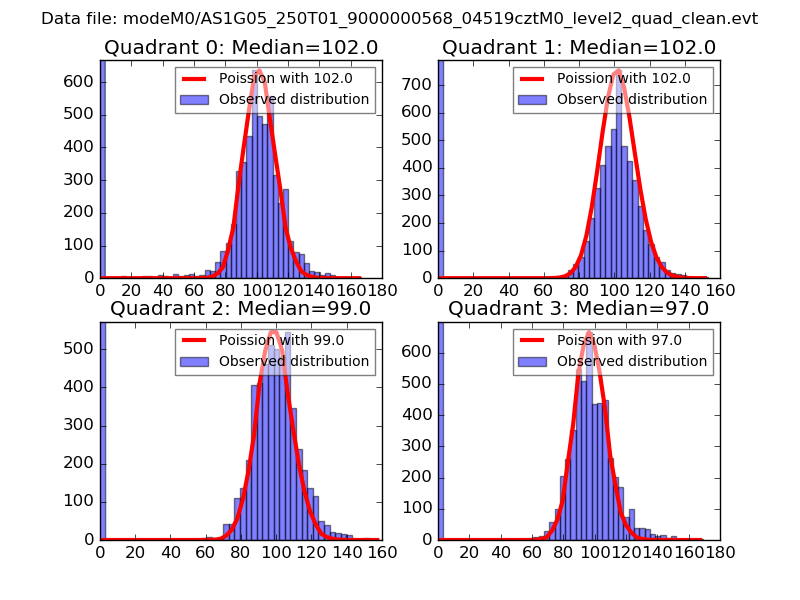 |
 |
| Quadrant-wise count rates Data is divided into 100 sec bins |
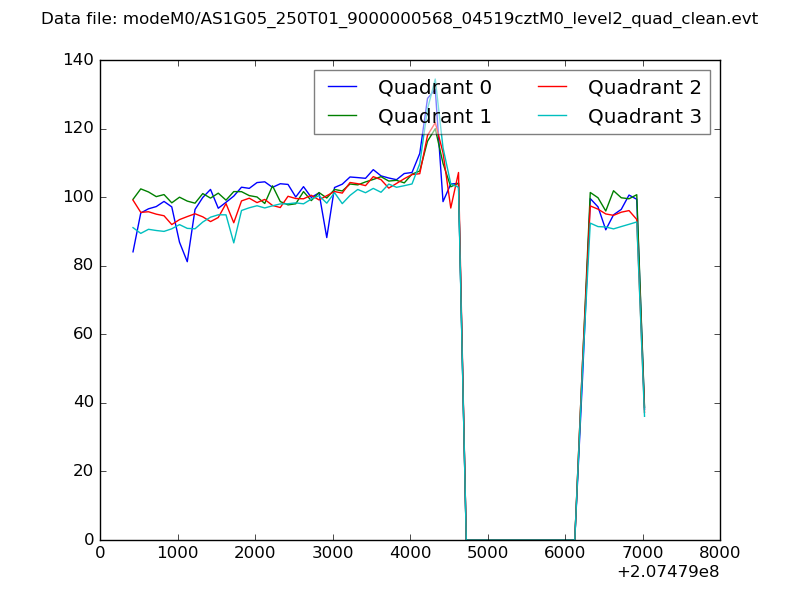 |
|
| Module-wise count rates for Quadrant A Data is divided into 100 sec bins |
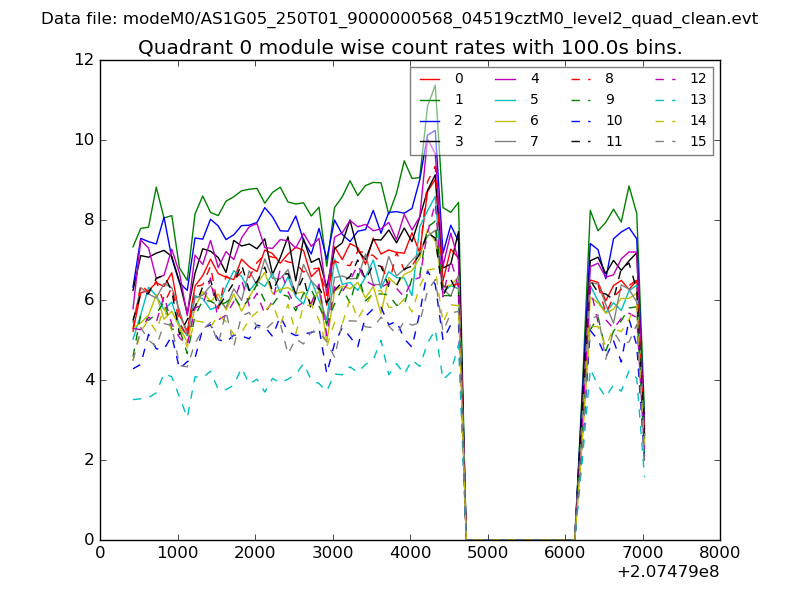 |
 |
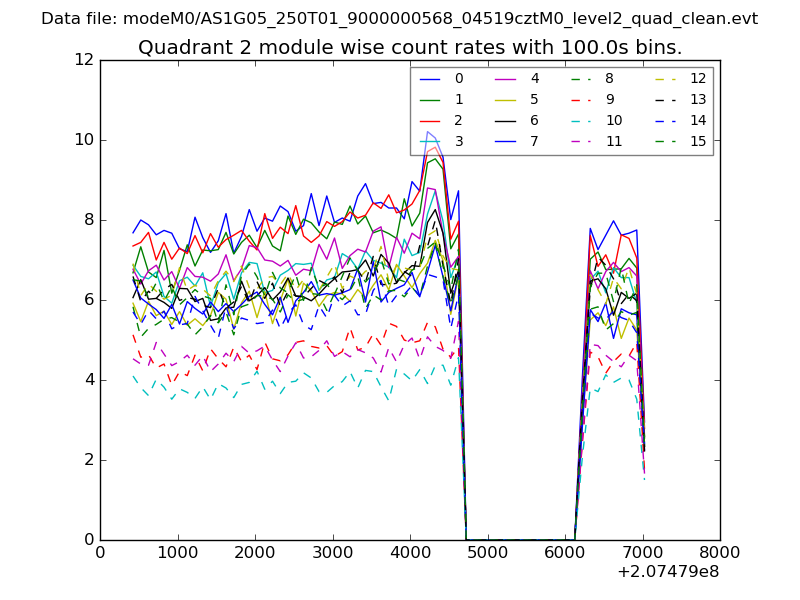
| Module-wise count rates for Quadrant B Data is divided into 100 sec bins |
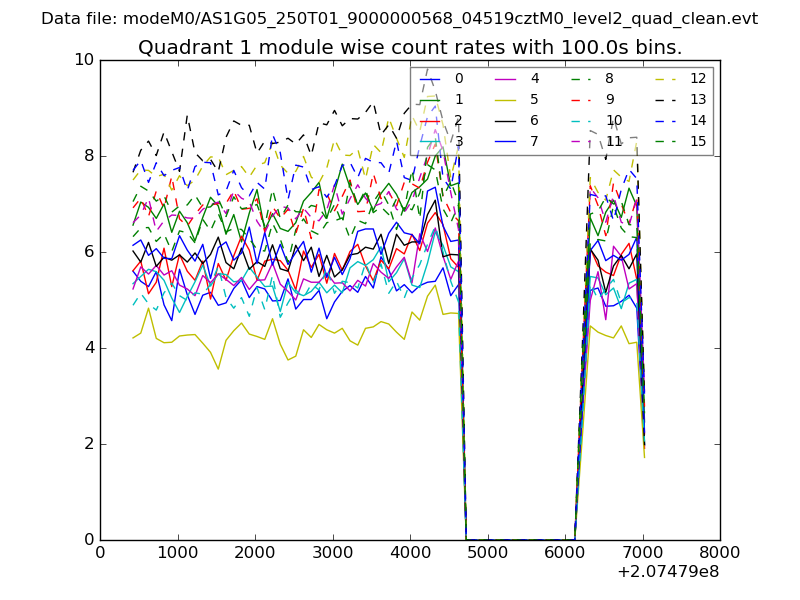 |
 |
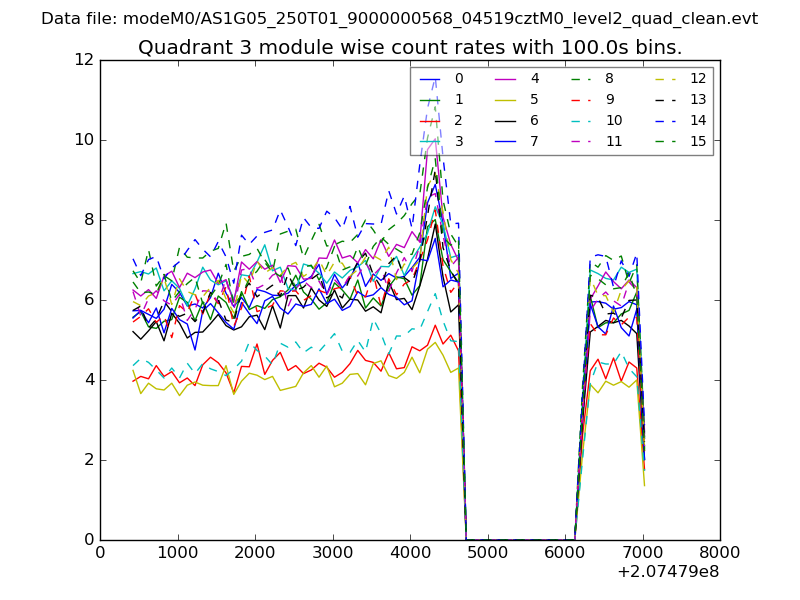
| Module-wise count rates for Quadrant C Data is divided into 100 sec bins |
 |
 |
| Module-wise count rates for Quadrant D Data is divided into 100 sec bins |
 |
 |
| Parameter | Plot |
|---|---|
| CZT HV Monitor | 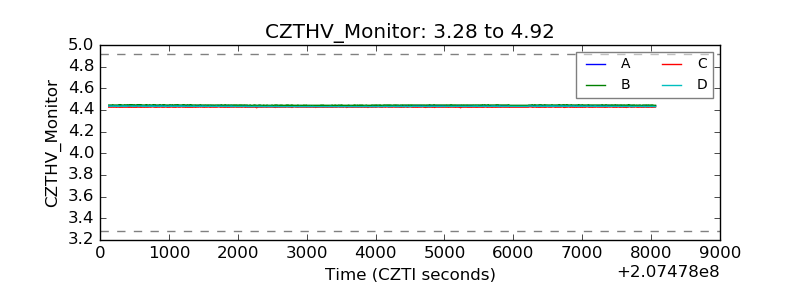 |
| D_VDD | 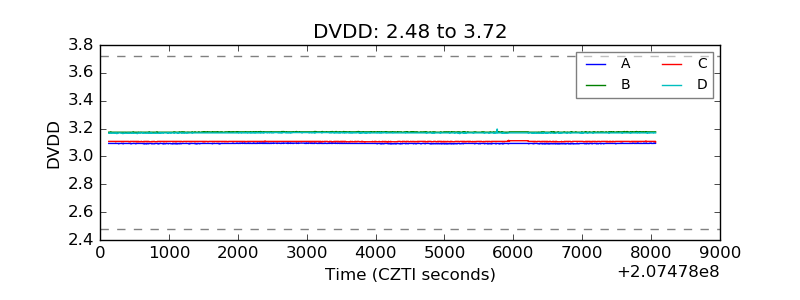 |
| Temperature 1 | 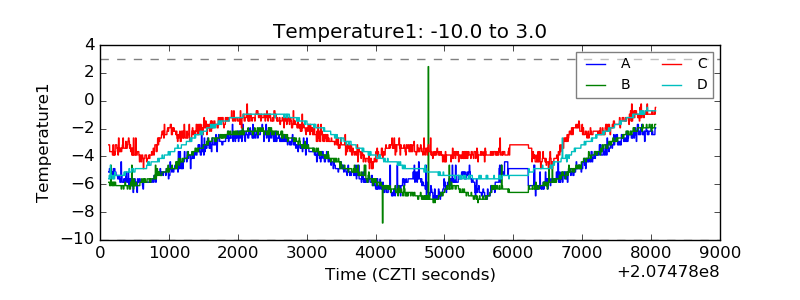 |
| Veto HV Monitor | 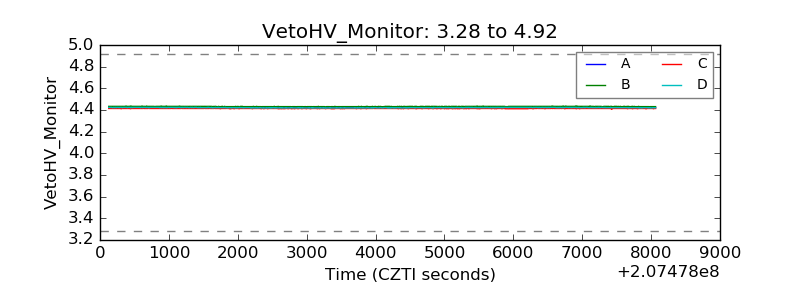 |
| Veto LLD | 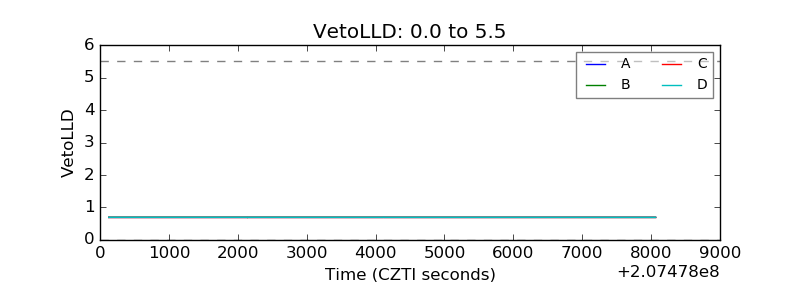 |
| Alpha Counter | 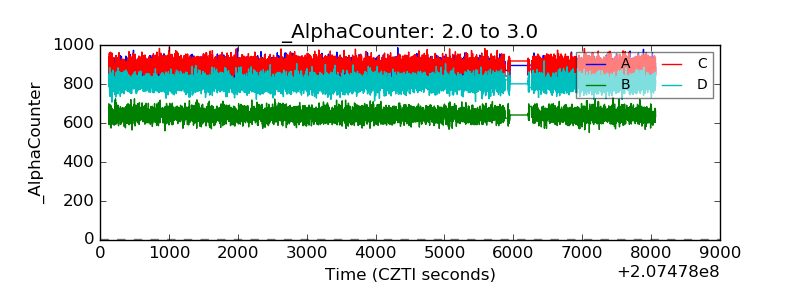 |
| _CPM_Rate | 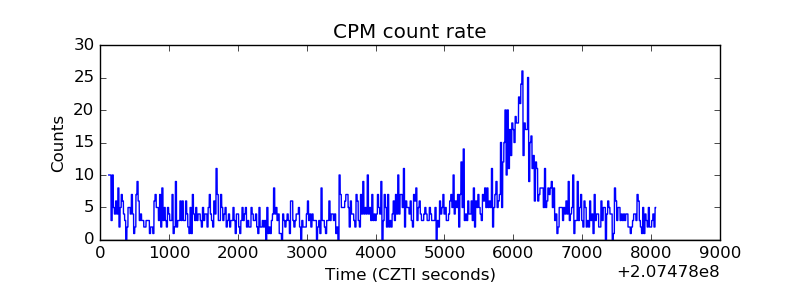 |
| CZT Counter | 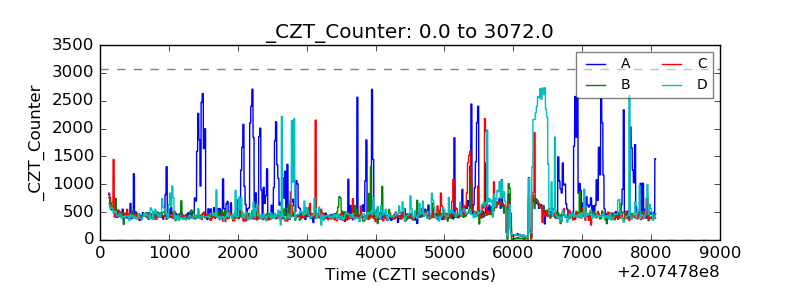 |
| +2.5 Volts monitor |  |
| +5 Volts monitor |  |
| _ROLL_ROT | 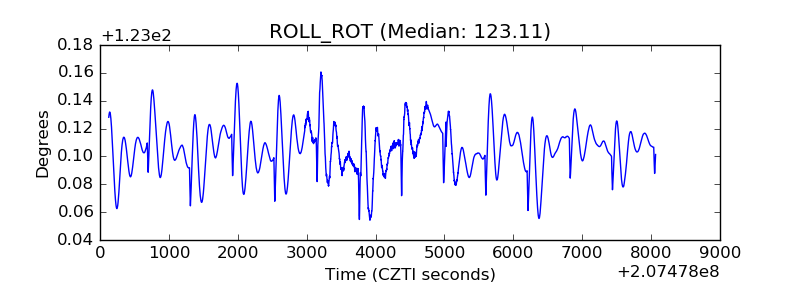 |
| _Roll_DEC | 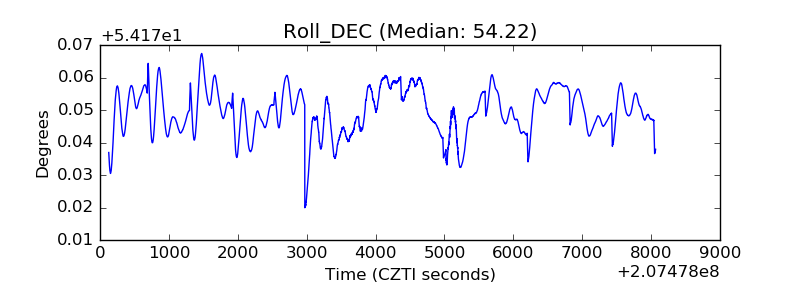 |
| _Roll_RA | 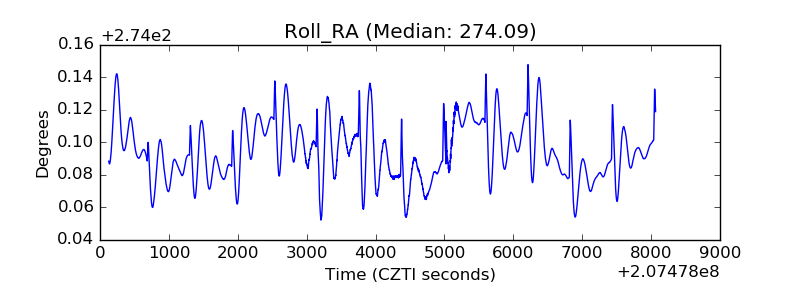 |
| Veto Counter | 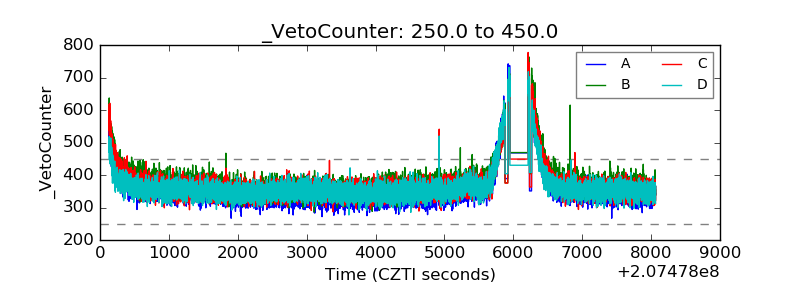 |