| Param | Original file | Final file |
|---|---|---|
| Filename | modeM0/AS1G05_250T01_9000000568_04520cztM0_level2.evt | modeM0/AS1G05_250T01_9000000568_04520cztM0_level2_quad_clean.evt |
| Size (bytes) | 535,527,360 | 87,344,640 |
| Size | 510.7 MB | 83.3 MB |
| Events in quadrant A | 4,934,825 | 537,476 |
| Events in quadrant B | 3,514,199 | 546,577 |
| Events in quadrant C | 3,316,597 | 535,700 |
| Events in quadrant D | 3,958,524 | 518,462 |
| Mode M0 | |||
|---|---|---|---|
| Quadrant | BADHDUFLAG | Total packets | Discarded packets |
| A | 0 | 19802 | 1 |
| B | 0 | 15500 | 0 |
| C | 0 | 15140 | 0 |
| D | 0 | 16838 | 0 |
| Mode SS | |||
|---|---|---|---|
| Quadrant | BADHDUFLAG | Total packets | Discarded packets |
| A | 0 | 144 | 0 |
| B | 0 | 144 | 0 |
| C | 0 | 144 | 0 |
| D | 0 | 144 | 0 |
| Quadrant | Total seconds | Saturated seconds | Saturation percentage |
|---|---|---|---|
| A | 7284 | 625 | 8.580450% |
| B | 7284 | 154 | 2.114223% |
| C | 7284 | 136 | 1.867106% |
| D | 7284 | 223 | 3.061505% |
Noise dominated data is calculated using 1-second bins in cleaned event files. If a bin has >2000 counts, and if more than 50% of those come from <1% of pixels, then it is considered to be noise-dominated and hence unusable.
| Quadrant | # 1 sec bins | Bins with >0 counts | Bins with >2000 counts | High rate bins dominated by noise | Noise dominated (total time) | Noise dominated (detector-on time) | Marked lightcurve |
|---|---|---|---|---|---|---|---|
| A | 7284 | 7284 | 217 | 217 | 2.98% | 2.98% | 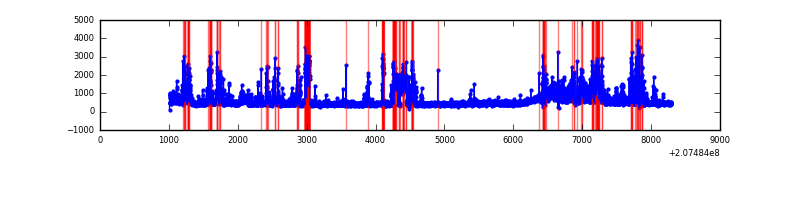 |
| B | 7284 | 7284 | 15 | 15 | 0.21% | 0.21% | 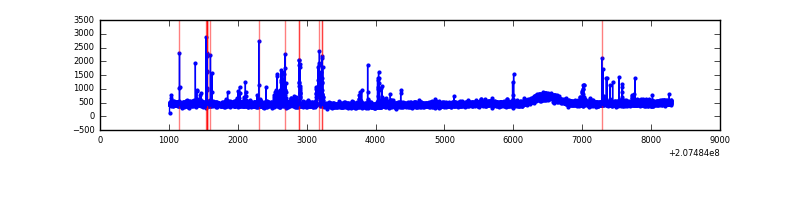 |
| C | 7284 | 7284 | 2 | 2 | 0.03% | 0.03% | 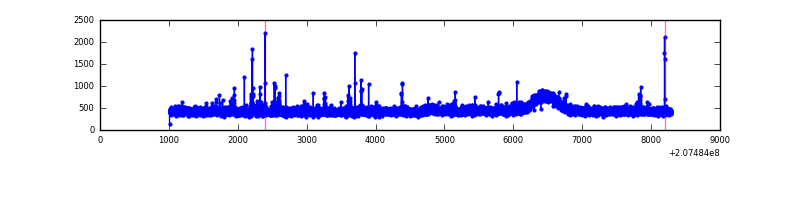 |
| D | 7284 | 7284 | 96 | 96 | 1.32% | 1.32% | 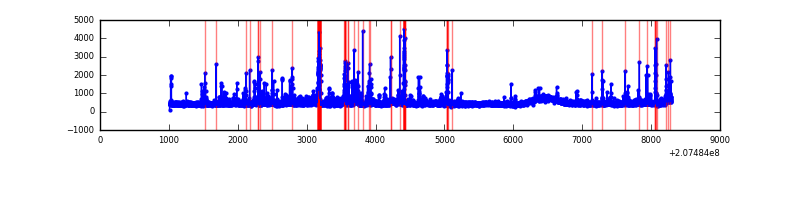 |
Top three noisy pixels from each quadrant. If the there are fewer than three noisy pixels in the level2.evt file, extra rows are filled as -1
| Pixel properties | Quadrant properties | ||||||
|---|---|---|---|---|---|---|---|
| Quadrant | DetID | PixID | Counts | Sigma | Mean | Median | Sigma |
| A | 0 | 13 | 1722101 | 10201.76 | 817 | 798 | 168.7 |
| A | 8 | 15 | 35683 | 206.76 | 817 | 798 | 168.7 |
| A | 15 | 234 | 22196 | 126.82 | 817 | 798 | 168.7 |
| B | 8 | 3 | 126805 | 777.41 | 841 | 820 | 162.1 |
| B | 4 | 48 | 60423 | 367.79 | 841 | 820 | 162.1 |
| B | 15 | 204 | 21995 | 130.66 | 841 | 820 | 162.1 |
| C | 9 | 247 | 126603 | 662.2 | 813 | 814 | 190.0 |
| C | 9 | 54 | 7732 | 36.42 | 813 | 814 | 190.0 |
| C | 13 | 61 | 6667 | 30.81 | 813 | 814 | 190.0 |
| D | 13 | 235 | 252966 | 1293.44 | 807 | 782 | 195.0 |
| D | 13 | 106 | 109182 | 555.98 | 807 | 782 | 195.0 |
| D | 2 | 136 | 74963 | 380.47 | 807 | 782 | 195.0 |
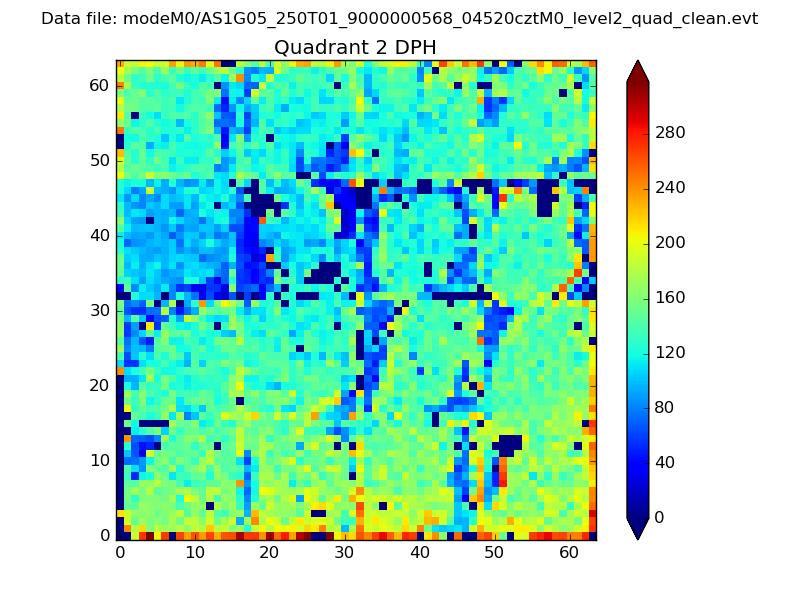
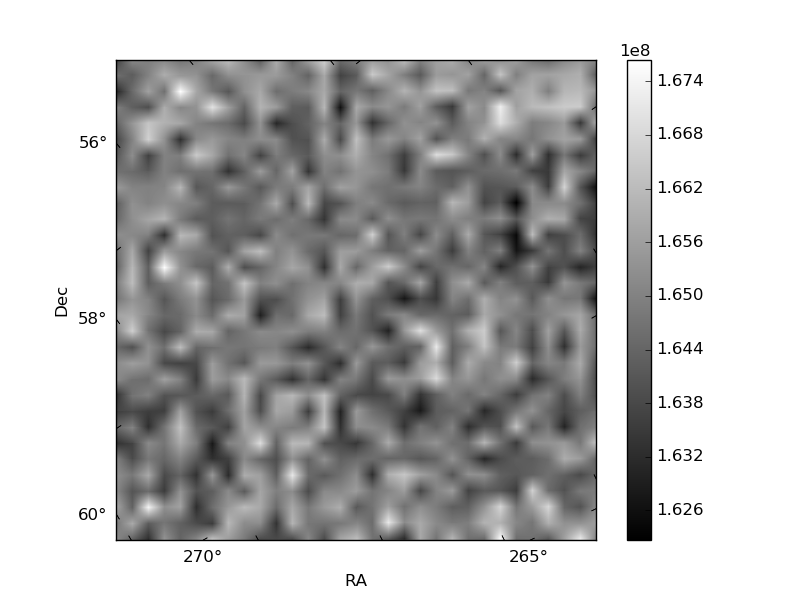
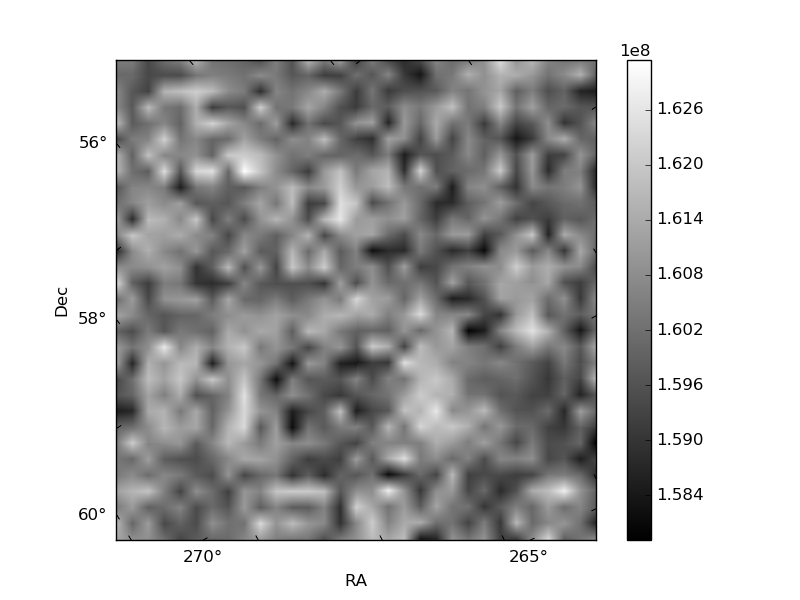
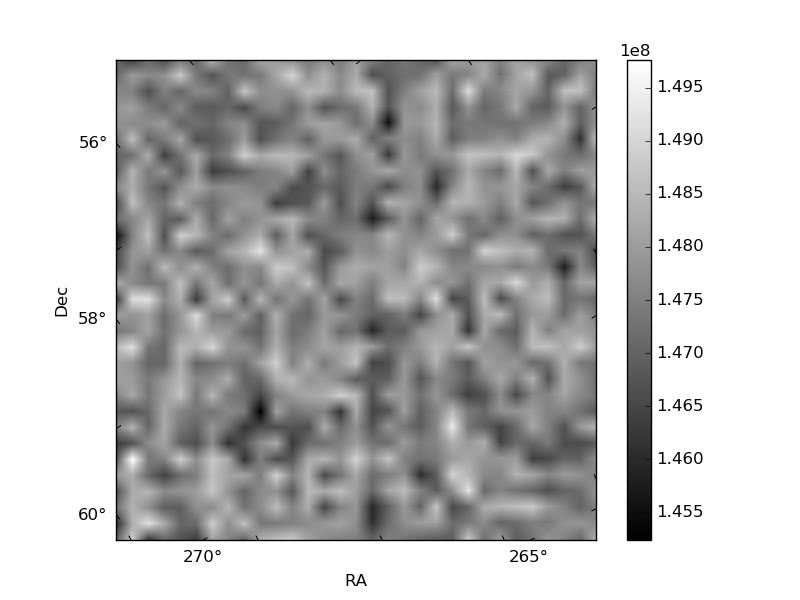
Histogram calculated using DETX and DETY for each event in the final _common_clean file
| Quadrant A |  |
 |
Quadrant B |
|---|---|---|---|
| Quadrant D | 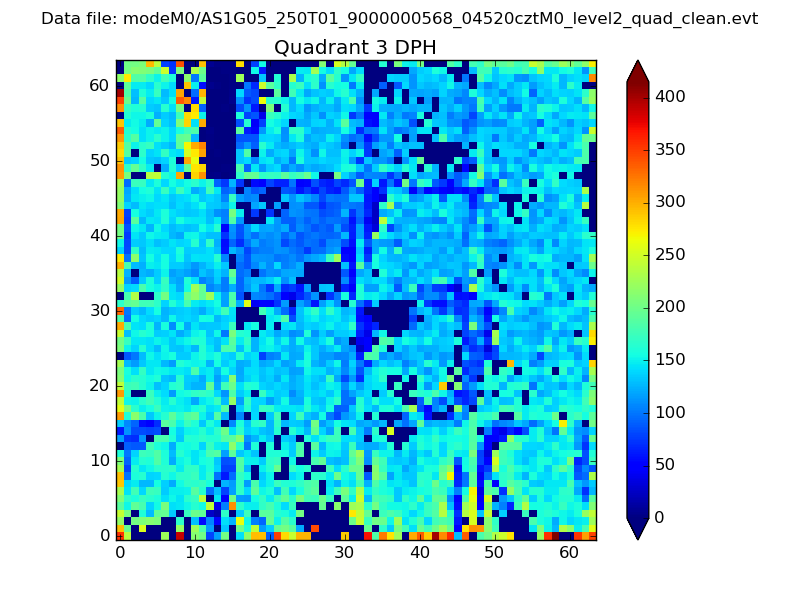 |
 |
Quadrant C |
| Plot type | Count rate plots | Images |
|---|---|---|
| Comparison with Poisson distribution Blue bars denote a histogram of data divided into 1 sec bins. Red curve is a Poisson curve with rate = median count rate of data. |
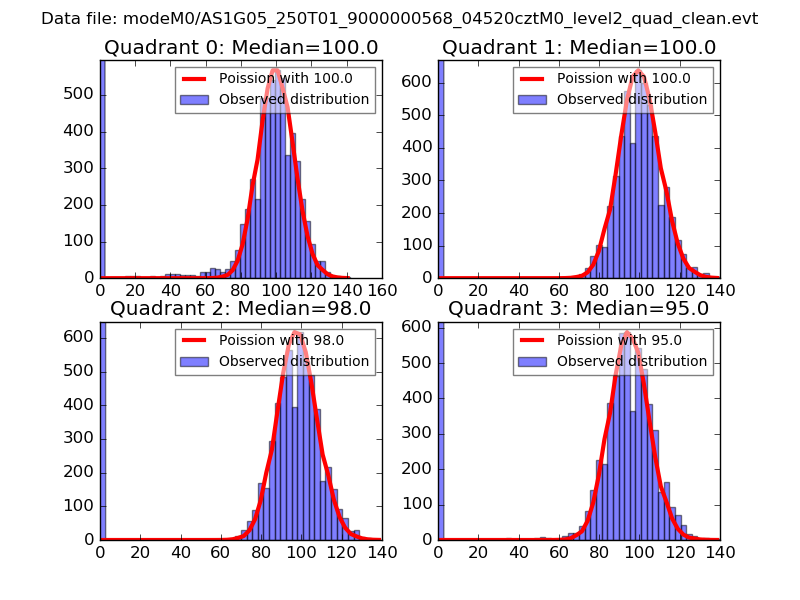 |
 |
| Quadrant-wise count rates Data is divided into 100 sec bins |
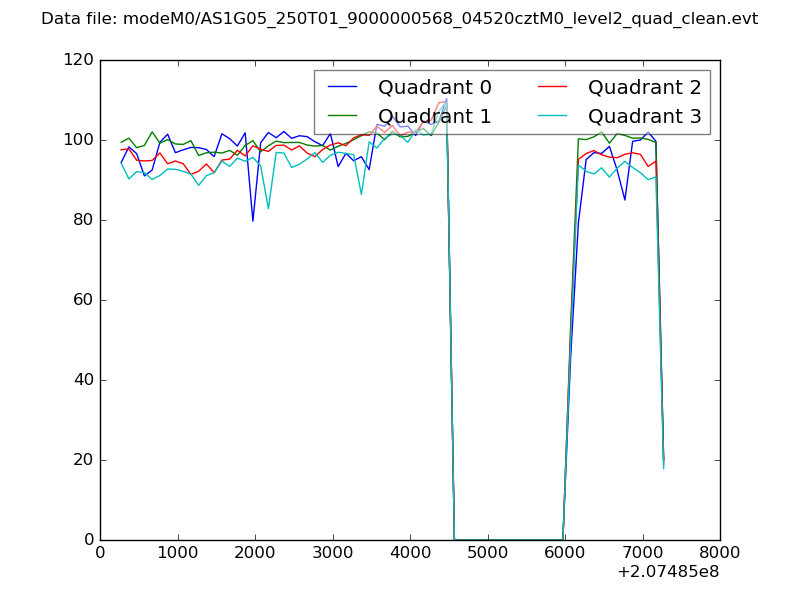 |
|
| Module-wise count rates for Quadrant A Data is divided into 100 sec bins |
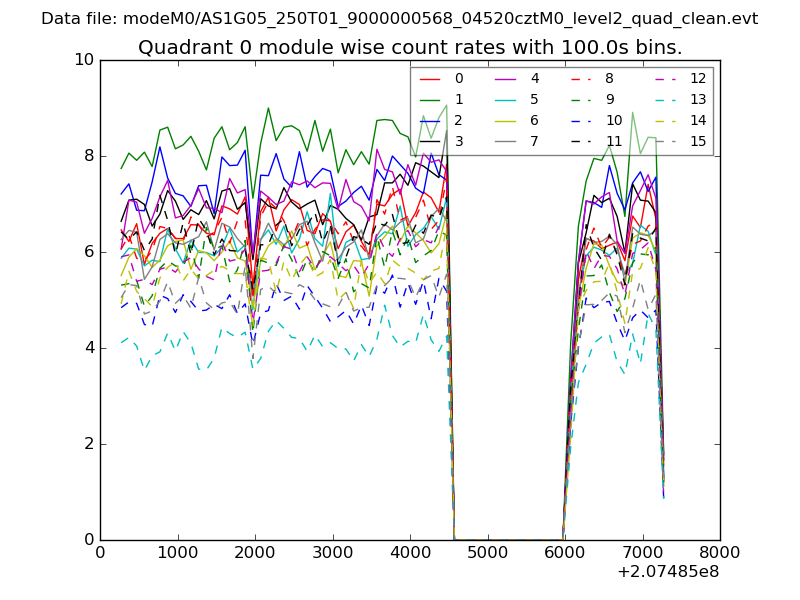 |
 |
| Module-wise count rates for Quadrant B Data is divided into 100 sec bins |
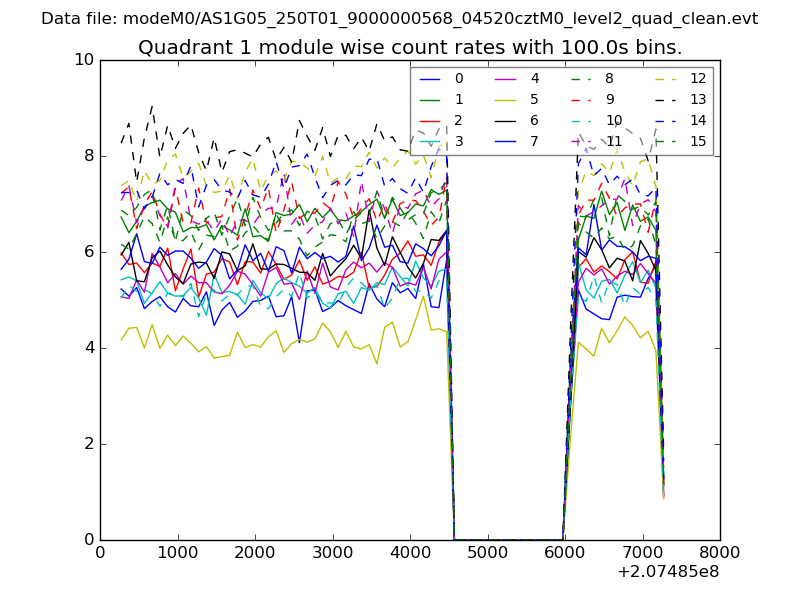 |
 |
| Module-wise count rates for Quadrant C Data is divided into 100 sec bins |
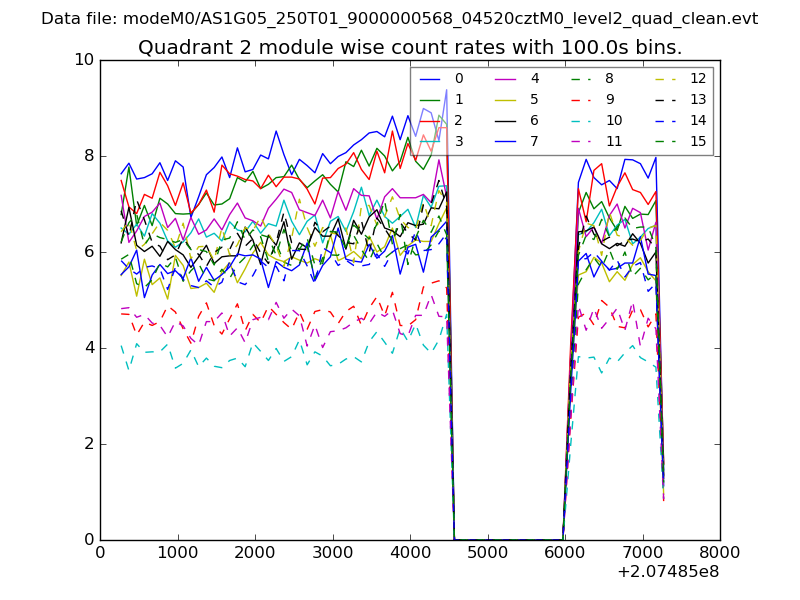 |
 |
| Module-wise count rates for Quadrant D Data is divided into 100 sec bins |
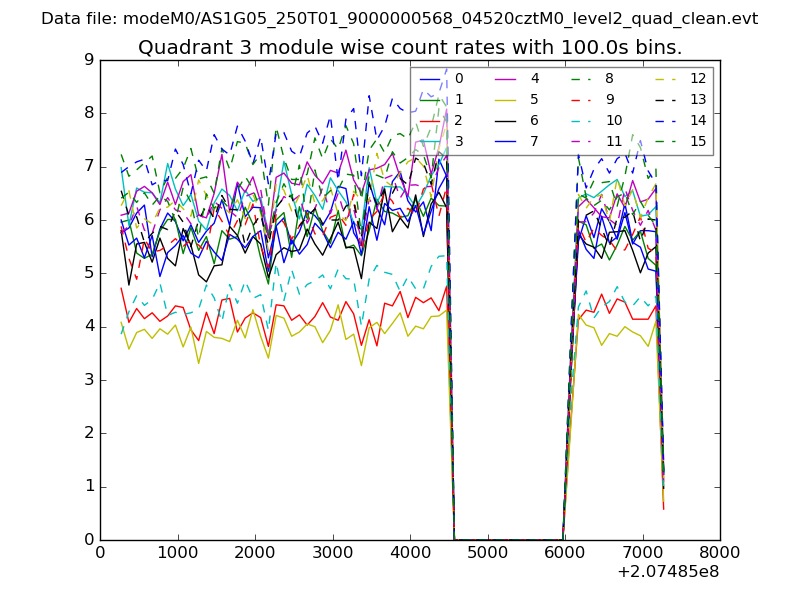 |
 |
| Parameter | Plot |
|---|---|
| CZT HV Monitor | 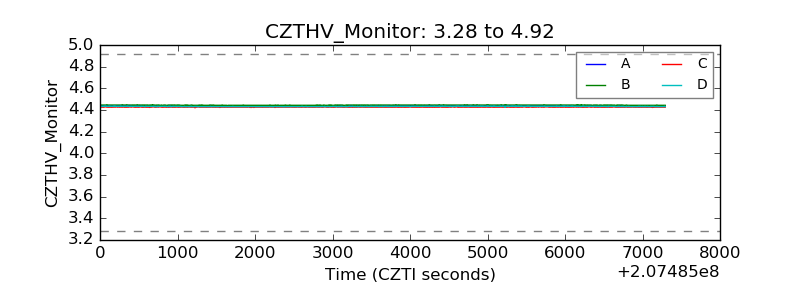 |
| D_VDD | 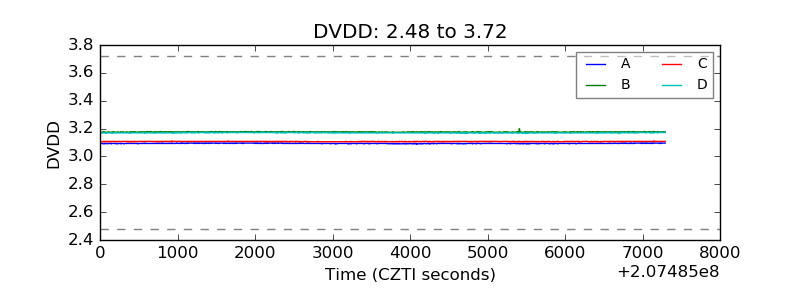 |
| Temperature 1 | 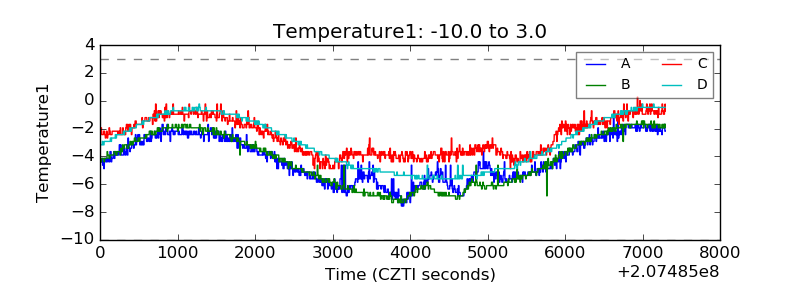 |
| Veto HV Monitor | 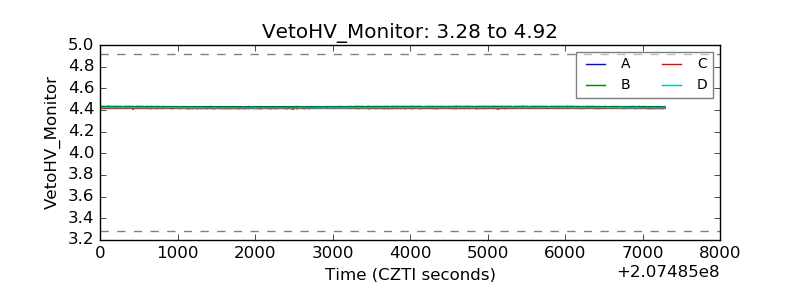 |
| Veto LLD | 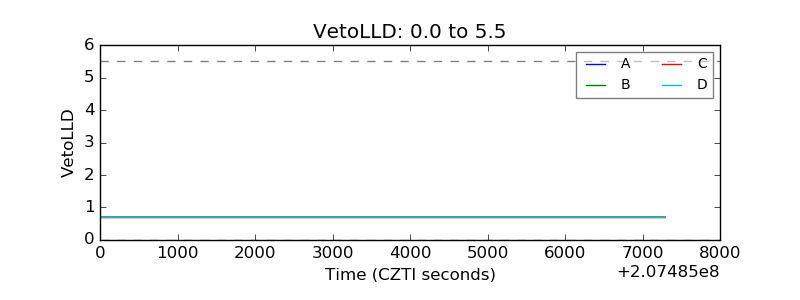 |
| Alpha Counter | 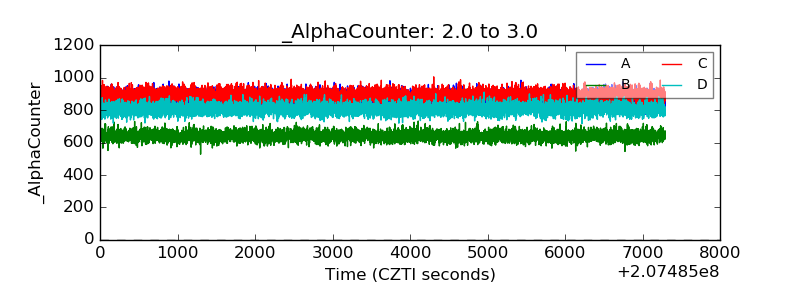 |
| _CPM_Rate | 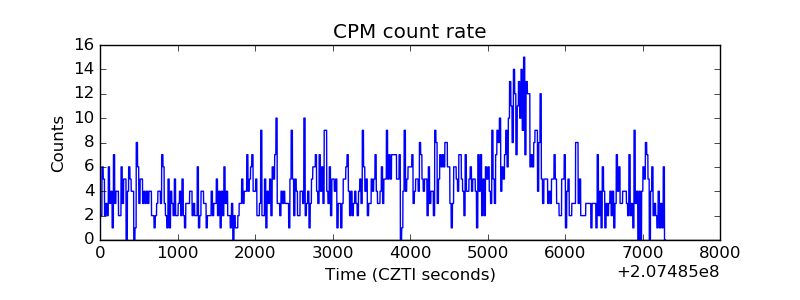 |
| CZT Counter | 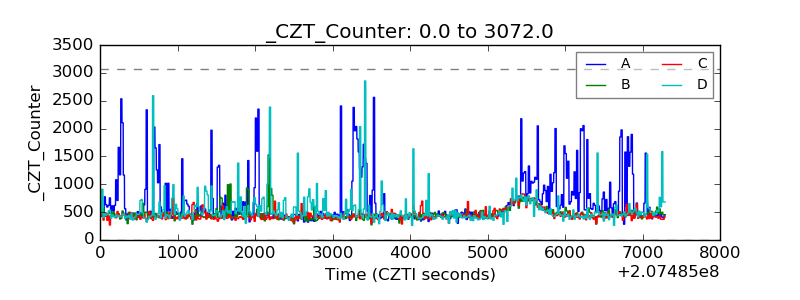 |
| +2.5 Volts monitor |  |
| +5 Volts monitor |  |
| _ROLL_ROT | 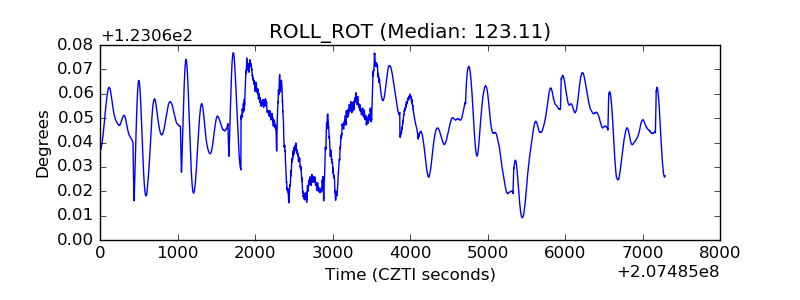 |
| _Roll_DEC | 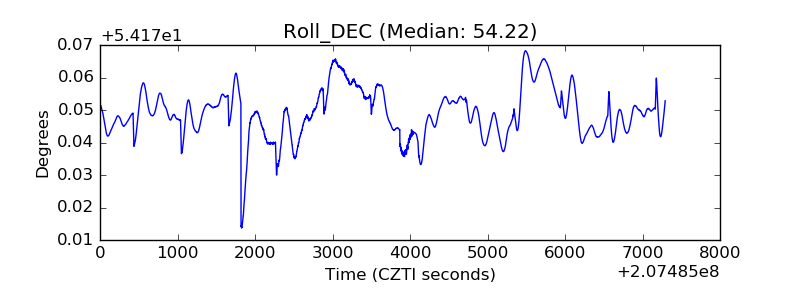 |
| _Roll_RA | 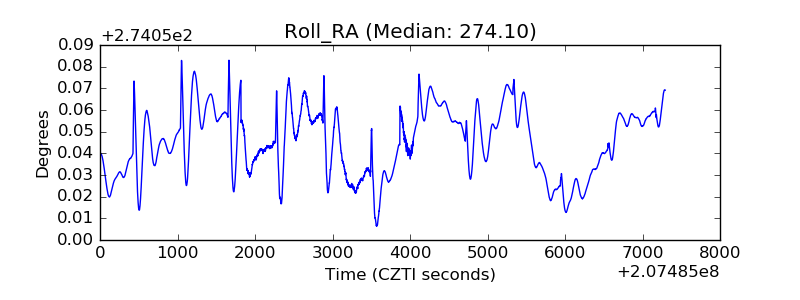 |
| Veto Counter | 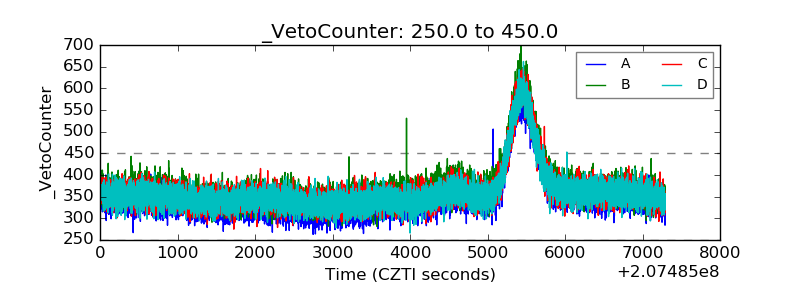 |