| Param | Original file | Final file |
|---|---|---|
| Filename | modeM0/AS1G05_250T01_9000000568_04525cztM0_level2.evt | modeM0/AS1G05_250T01_9000000568_04525cztM0_level2_quad_clean.evt |
| Size (bytes) | 1,167,707,520 | 181,117,440 |
| Size | 1.1 GB | 172.7 MB |
| Events in quadrant A | 11,426,657 | 1,077,532 |
| Events in quadrant B | 7,265,127 | 1,119,659 |
| Events in quadrant C | 6,876,873 | 1,118,109 |
| Events in quadrant D | 8,736,436 | 1,088,797 |
| Mode M0 | |||
|---|---|---|---|
| Quadrant | BADHDUFLAG | Total packets | Discarded packets |
| A | 0 | 45189 | 4 |
| B | 0 | 32688 | 3 |
| C | 0 | 32204 | 3 |
| D | 0 | 36861 | 3 |
| Mode SS | |||
|---|---|---|---|
| Quadrant | BADHDUFLAG | Total packets | Discarded packets |
| A | 0 | 320 | 0 |
| B | 0 | 320 | 0 |
| C | 0 | 320 | 0 |
| D | 0 | 320 | 0 |
| Mode M9 | |||
|---|---|---|---|
| Quadrant | BADHDUFLAG | Total packets | Discarded packets |
| A | 0 | 24 | 0 |
| B | 0 | 24 | 0 |
| C | 0 | 24 | 0 |
| D | 0 | 24 | 0 |
| Quadrant | Total seconds | Saturated seconds | Saturation percentage |
|---|---|---|---|
| A | 15658 | 1394 | 8.902797% |
| B | 15658 | 125 | 0.798314% |
| C | 15658 | 90 | 0.574786% |
| D | 15658 | 395 | 2.522672% |
Noise dominated data is calculated using 1-second bins in cleaned event files. If a bin has >2000 counts, and if more than 50% of those come from <1% of pixels, then it is considered to be noise-dominated and hence unusable.
| Quadrant | # 1 sec bins | Bins with >0 counts | Bins with >2000 counts | High rate bins dominated by noise | Noise dominated (total time) | Noise dominated (detector-on time) | Marked lightcurve |
|---|---|---|---|---|---|---|---|
| A | 18113 | 15660 | 807 | 807 | 4.46% | 5.15% |  |
| B | 18113 | 15661 | 16 | 16 | 0.09% | 0.10% | 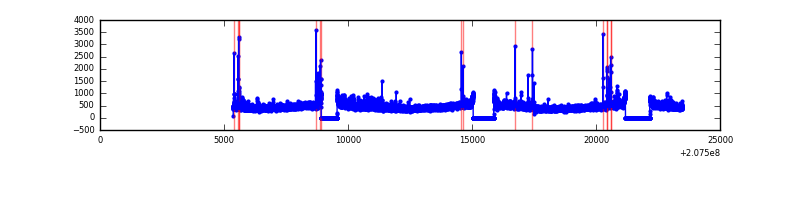 |
| C | 18113 | 15661 | 12 | 12 | 0.07% | 0.08% | 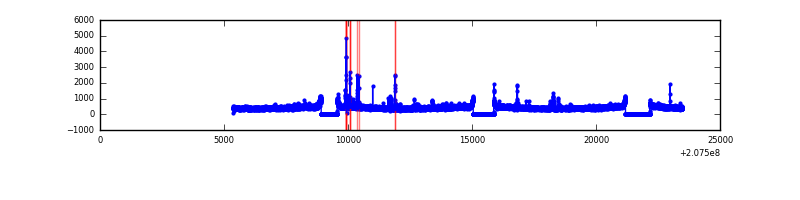 |
| D | 18113 | 15661 | 224 | 224 | 1.24% | 1.43% |  |
Top three noisy pixels from each quadrant. If the there are fewer than three noisy pixels in the level2.evt file, extra rows are filled as -1
| Pixel properties | Quadrant properties | ||||||
|---|---|---|---|---|---|---|---|
| Quadrant | DetID | PixID | Counts | Sigma | Mean | Median | Sigma |
| A | 0 | 13 | 4389651 | 12842.9 | 1677 | 1638 | 341.7 |
| A | 0 | 50 | 261182 | 759.64 | 1677 | 1638 | 341.7 |
| A | 8 | 15 | 179098 | 519.39 | 1677 | 1638 | 341.7 |
| B | 15 | 204 | 149856 | 442.03 | 1765 | 1721 | 335.1 |
| B | 4 | 48 | 98870 | 289.89 | 1765 | 1721 | 335.1 |
| B | 4 | 80 | 57711 | 167.07 | 1765 | 1721 | 335.1 |
| C | 9 | 247 | 195591 | 490.52 | 1705 | 1710 | 395.3 |
| C | 13 | 61 | 14022 | 31.15 | 1705 | 1710 | 395.3 |
| C | 13 | 112 | 10692 | 22.72 | 1705 | 1710 | 395.3 |
| D | 13 | 235 | 752051 | 1821.23 | 1680 | 1636 | 412.0 |
| D | 13 | 53 | 501928 | 1214.19 | 1680 | 1636 | 412.0 |
| D | 13 | 239 | 347042 | 838.29 | 1680 | 1636 | 412.0 |
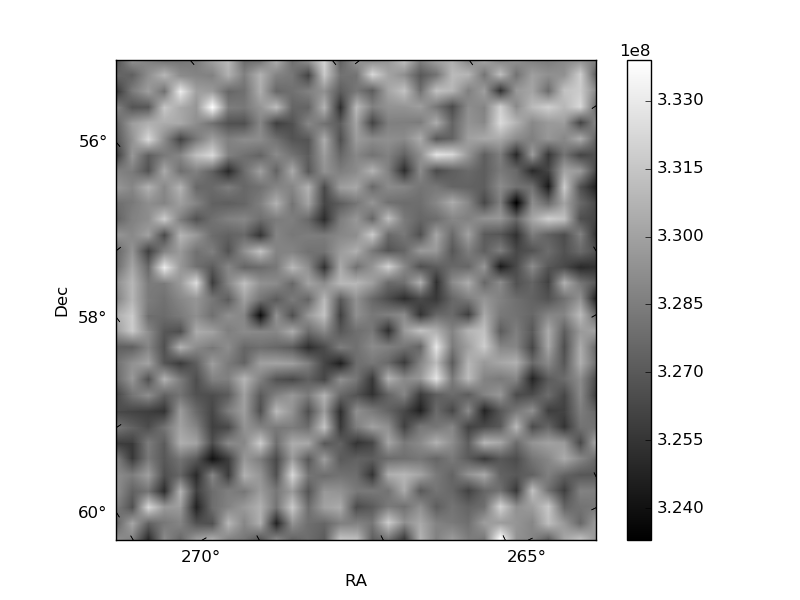
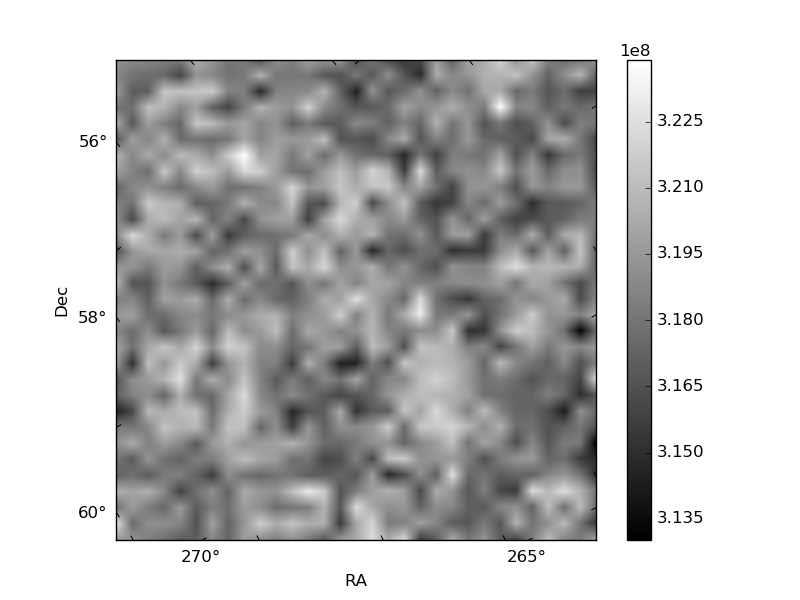
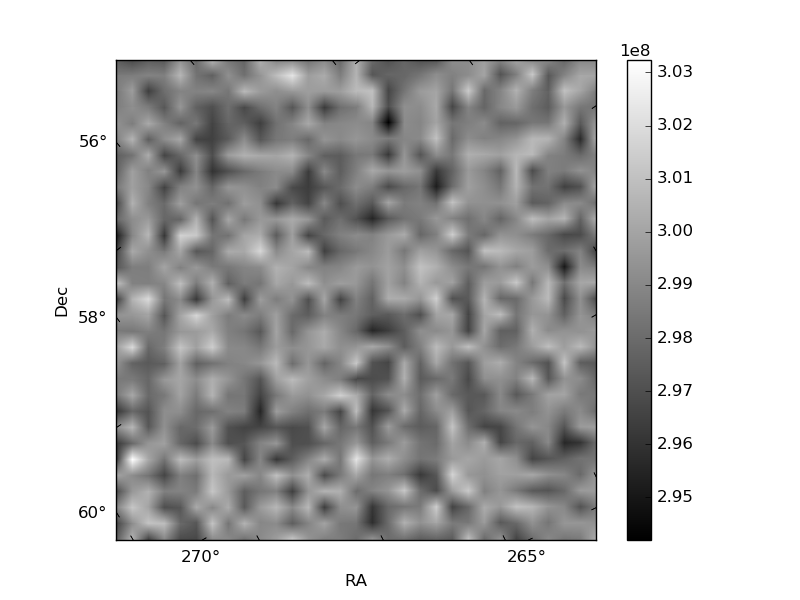
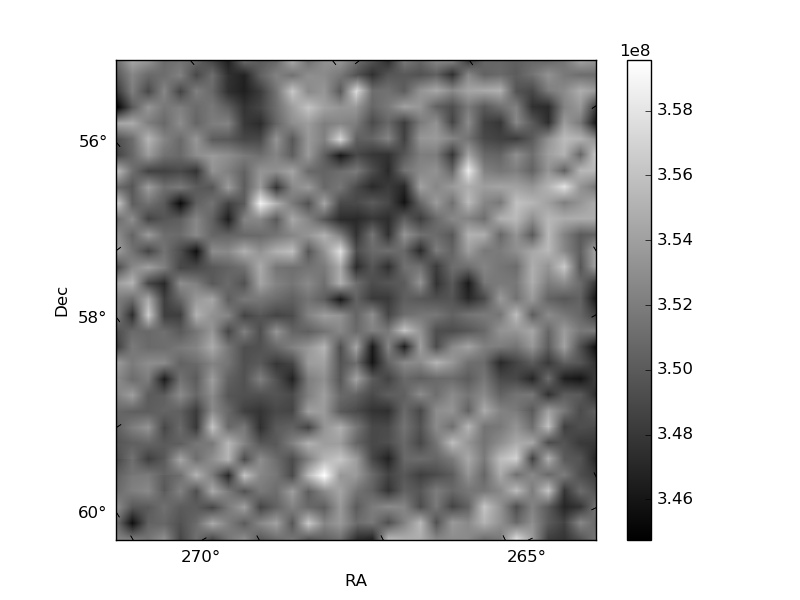
Histogram calculated using DETX and DETY for each event in the final _common_clean file
| Quadrant A | 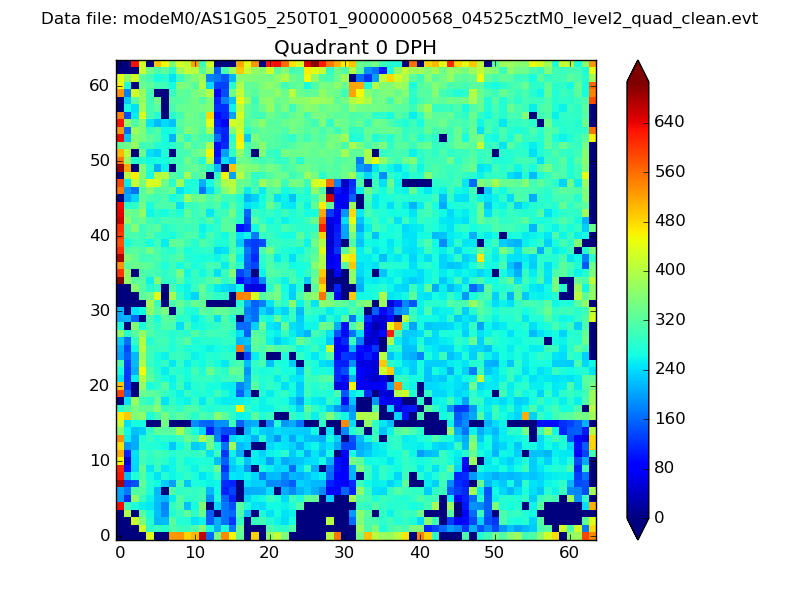 |
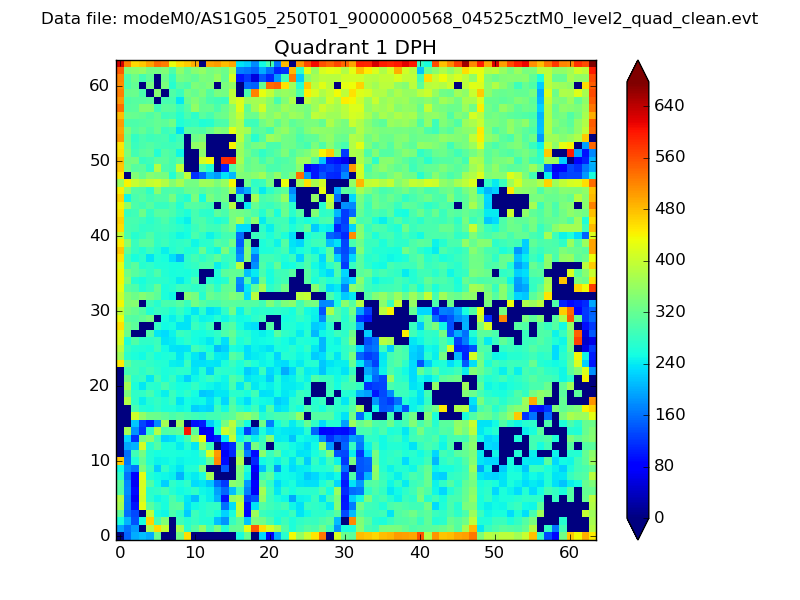 |
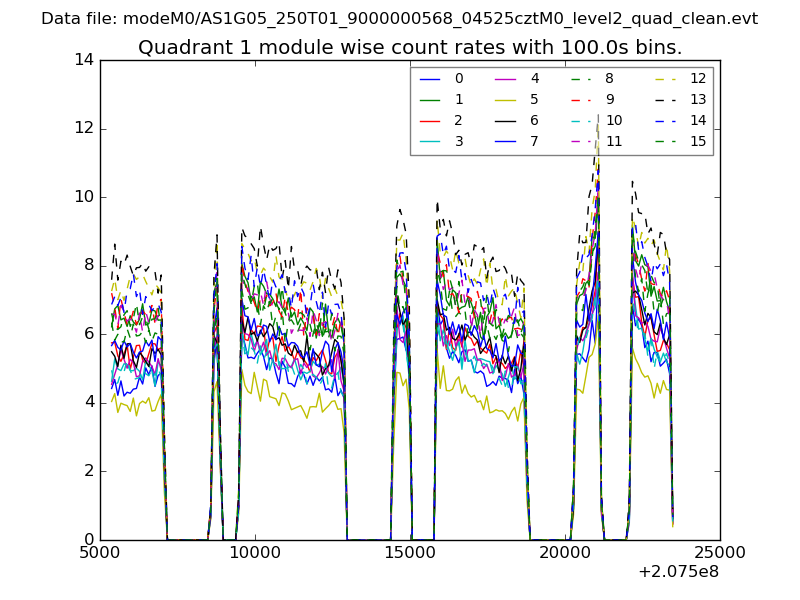
Quadrant B |
|---|---|---|---|
| Quadrant D |  |
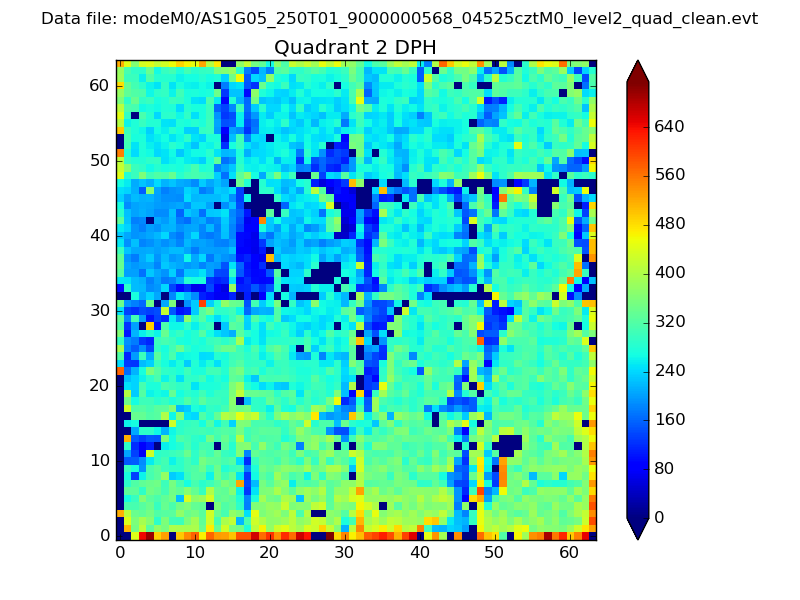 |
Quadrant C |
| Plot type | Count rate plots | Images |
|---|---|---|
| Comparison with Poisson distribution Blue bars denote a histogram of data divided into 1 sec bins. Red curve is a Poisson curve with rate = median count rate of data. |
 |
 |
| Quadrant-wise count rates Data is divided into 100 sec bins |
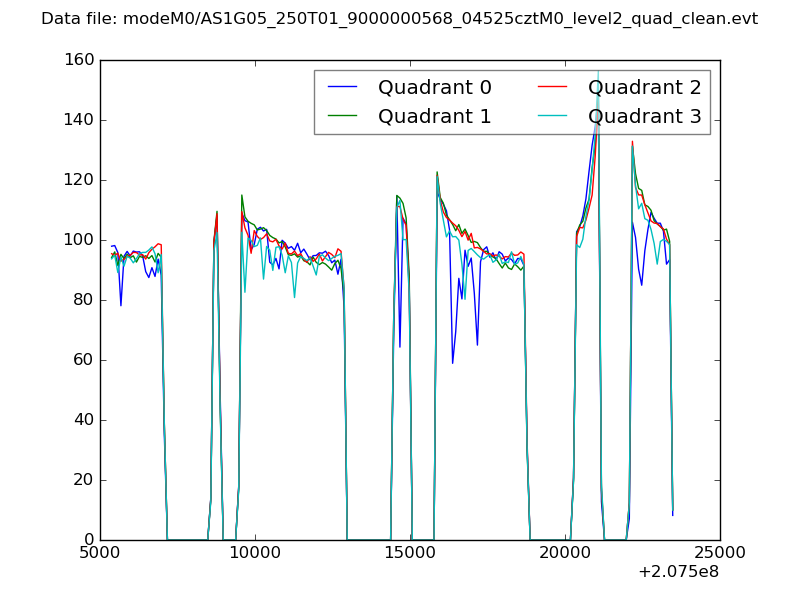 |
|
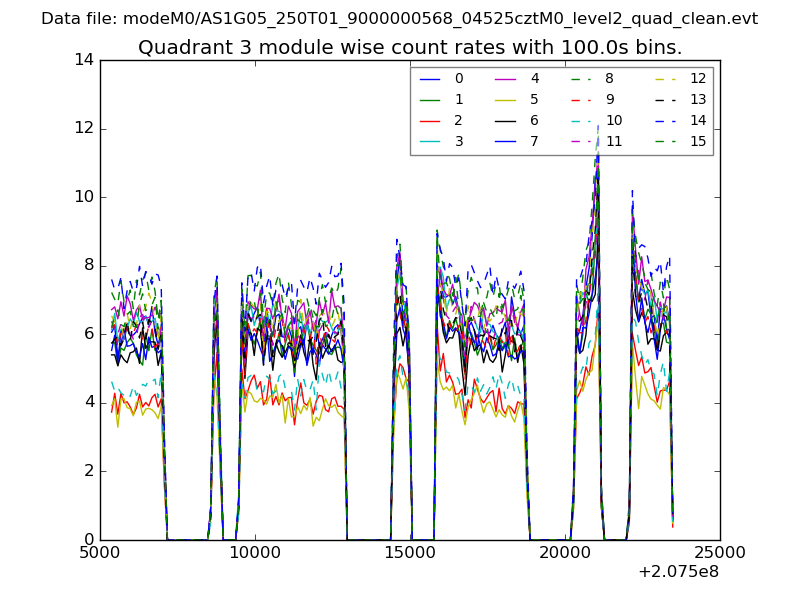
| Module-wise count rates for Quadrant A Data is divided into 100 sec bins |
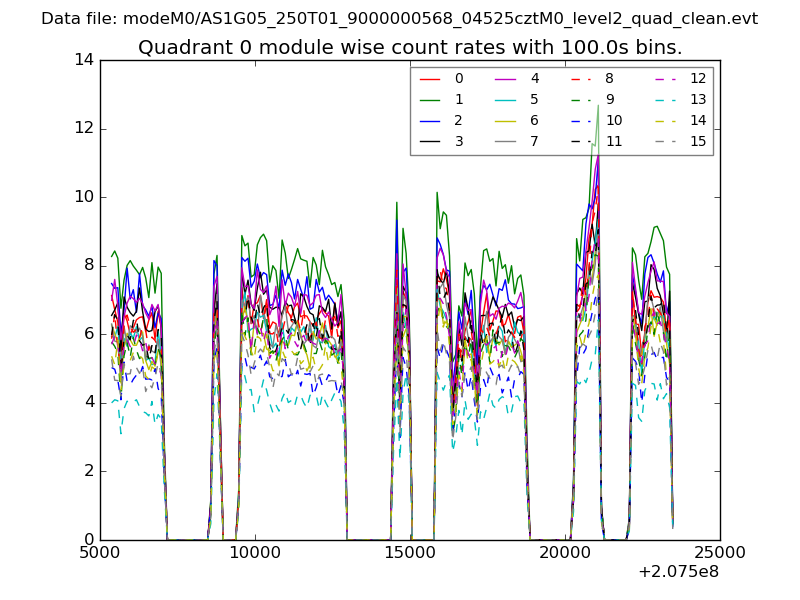 |
 |
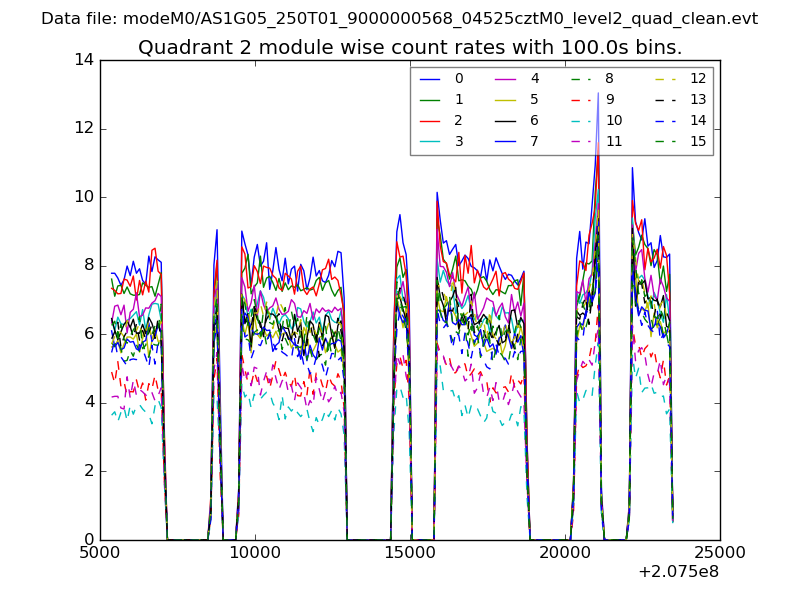
| Module-wise count rates for Quadrant B Data is divided into 100 sec bins |
 |
 |
| Module-wise count rates for Quadrant C Data is divided into 100 sec bins |
 |
 |
| Module-wise count rates for Quadrant D Data is divided into 100 sec bins |
 |
 |
| Parameter | Plot |
|---|---|
| CZT HV Monitor | 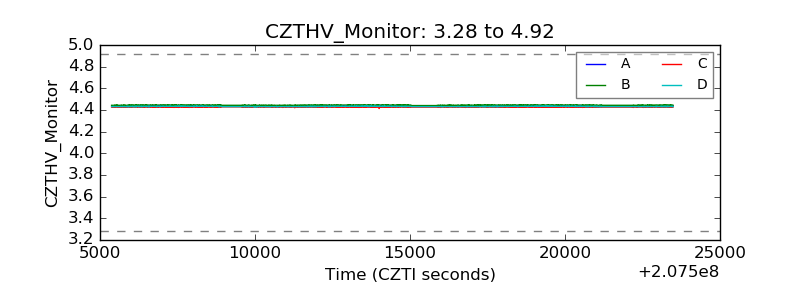 |
| D_VDD | 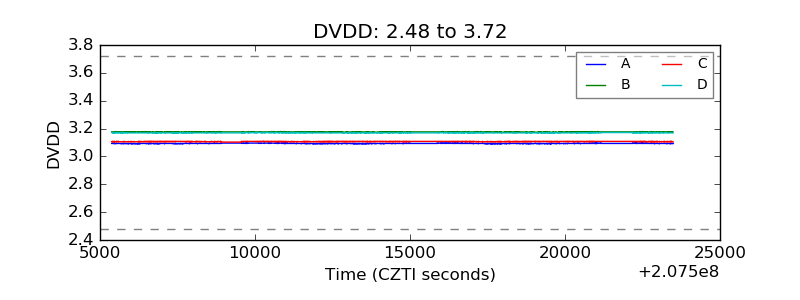 |
| Temperature 1 | 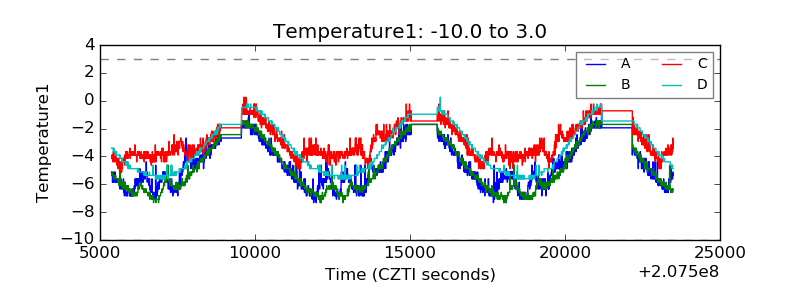 |
| Veto HV Monitor | 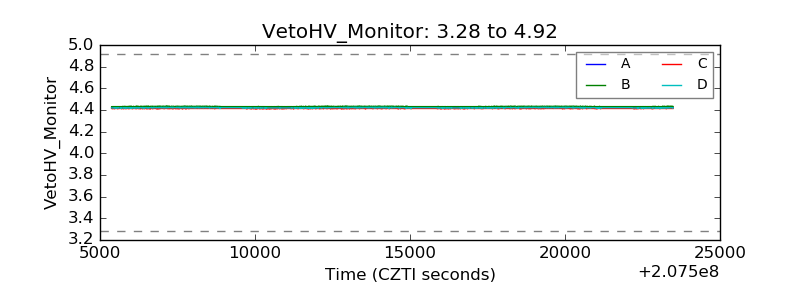 |
| Veto LLD | 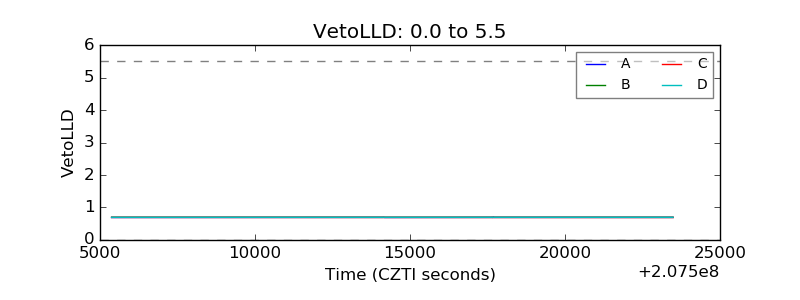 |
| Alpha Counter | 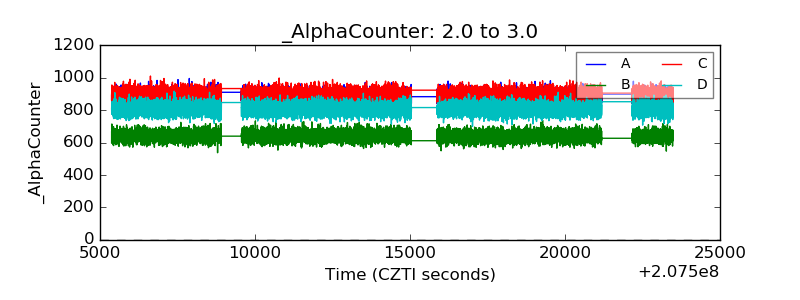 |
| _CPM_Rate | 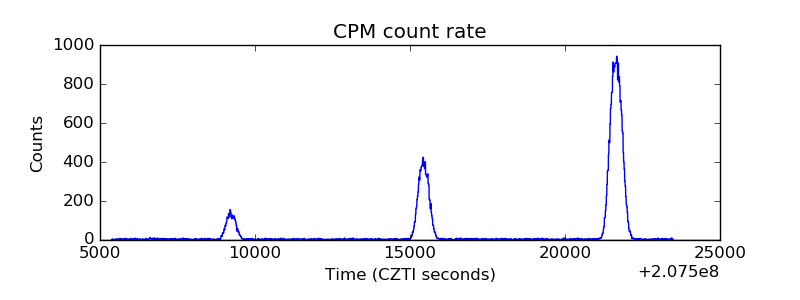 |
| CZT Counter | 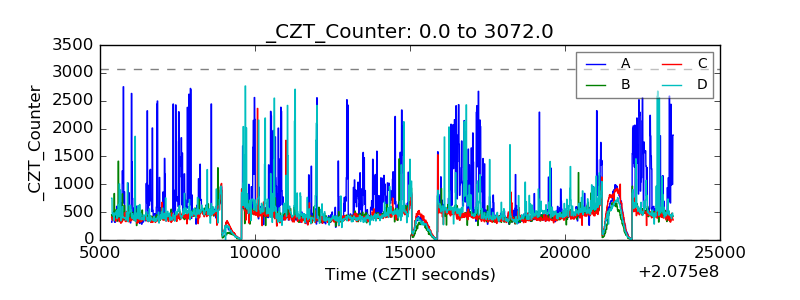 |
| +2.5 Volts monitor | 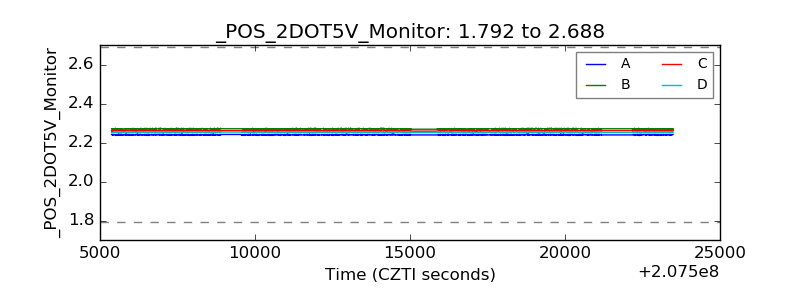 |
| +5 Volts monitor |  |
| _ROLL_ROT | 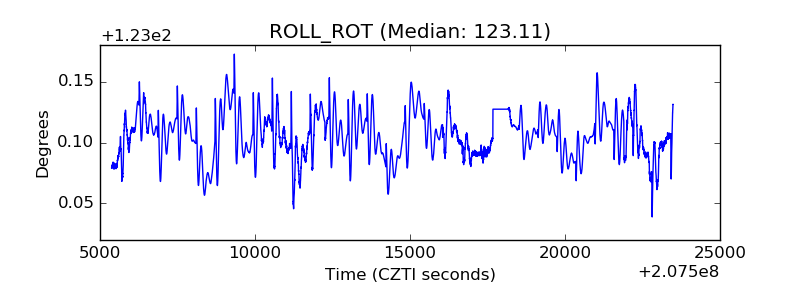 |
| _Roll_DEC | 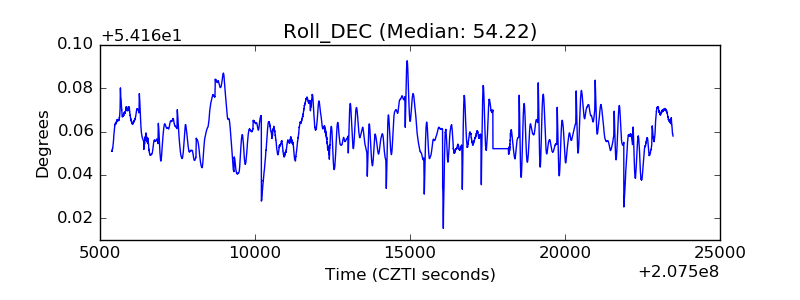 |
| _Roll_RA | 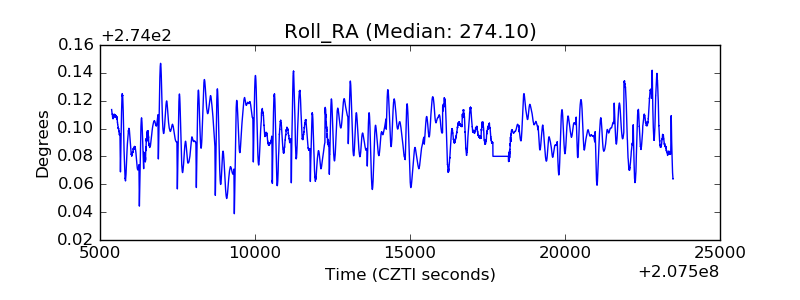 |
| Veto Counter | 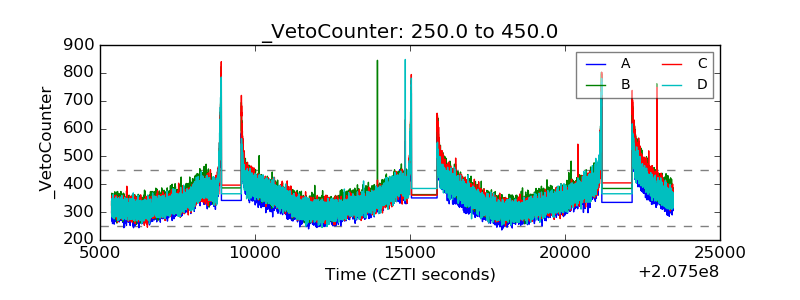 |