| Param | Original file | Final file |
|---|---|---|
| Filename | modeM0/AS1G05_250T01_9000000568_04528cztM0_level2.evt | modeM0/AS1G05_250T01_9000000568_04528cztM0_level2_quad_clean.evt |
| Size (bytes) | 470,223,360 | 85,222,080 |
| Size | 448.4 MB | 81.3 MB |
| Events in quadrant A | 4,697,575 | 527,080 |
| Events in quadrant B | 3,008,642 | 549,096 |
| Events in quadrant C | 2,872,730 | 540,559 |
| Events in quadrant D | 3,226,809 | 517,316 |
| Mode M0 | |||
|---|---|---|---|
| Quadrant | BADHDUFLAG | Total packets | Discarded packets |
| A | 0 | 18346 | 3 |
| B | 0 | 13373 | 2 |
| C | 0 | 13116 | 2 |
| D | 0 | 14476 | 2 |
| Mode SS | |||
|---|---|---|---|
| Quadrant | BADHDUFLAG | Total packets | Discarded packets |
| A | 0 | 130 | 0 |
| B | 0 | 130 | 0 |
| C | 0 | 130 | 0 |
| D | 0 | 130 | 0 |
| Mode M9 | |||
|---|---|---|---|
| Quadrant | BADHDUFLAG | Total packets | Discarded packets |
| A | 0 | 16 | 0 |
| B | 0 | 16 | 0 |
| C | 0 | 16 | 0 |
| D | 0 | 17 | 0 |
| Quadrant | Total seconds | Saturated seconds | Saturation percentage |
|---|---|---|---|
| A | 6401 | 521 | 8.139353% |
| B | 6401 | 25 | 0.390564% |
| C | 6401 | 17 | 0.265584% |
| D | 6401 | 57 | 0.890486% |
Noise dominated data is calculated using 1-second bins in cleaned event files. If a bin has >2000 counts, and if more than 50% of those come from <1% of pixels, then it is considered to be noise-dominated and hence unusable.
| Quadrant | # 1 sec bins | Bins with >0 counts | Bins with >2000 counts | High rate bins dominated by noise | Noise dominated (total time) | Noise dominated (detector-on time) | Marked lightcurve |
|---|---|---|---|---|---|---|---|
| A | 7616 | 6402 | 344 | 344 | 4.52% | 5.37% | 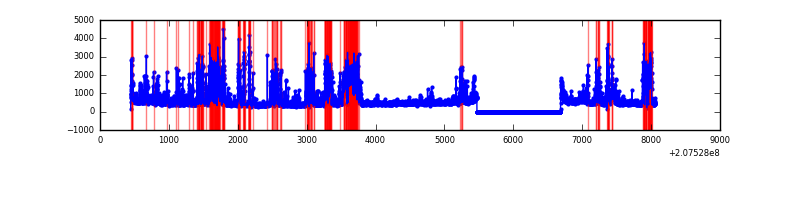 |
| B | 7616 | 6402 | 3 | 3 | 0.04% | 0.05% | 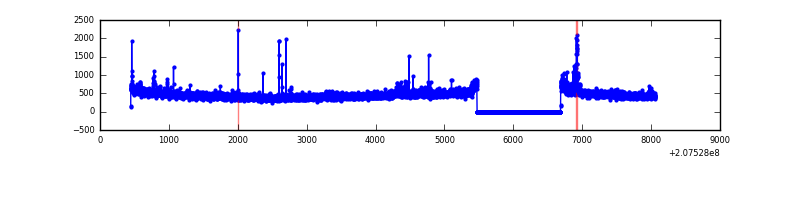 |
| C | 7616 | 6402 | 1 | 1 | 0.01% | 0.02% | 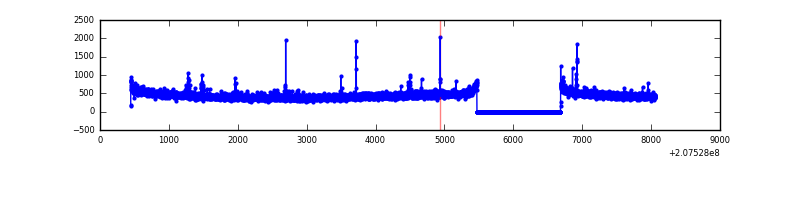 |
| D | 7616 | 6402 | 45 | 45 | 0.59% | 0.70% | 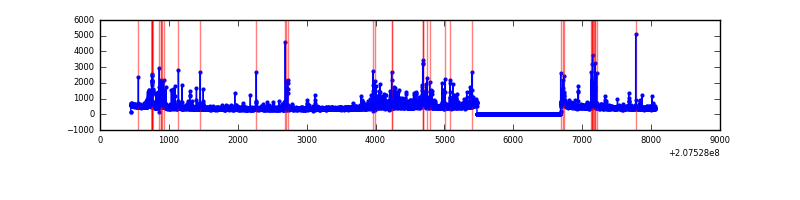 |
Top three noisy pixels from each quadrant. If the there are fewer than three noisy pixels in the level2.evt file, extra rows are filled as -1
| Pixel properties | Quadrant properties | ||||||
|---|---|---|---|---|---|---|---|
| Quadrant | DetID | PixID | Counts | Sigma | Mean | Median | Sigma |
| A | 0 | 13 | 1862282 | 12893.43 | 708 | 692 | 144.4 |
| A | 8 | 15 | 56705 | 387.95 | 708 | 692 | 144.4 |
| A | 14 | 111 | 32492 | 220.25 | 708 | 692 | 144.4 |
| B | 4 | 48 | 75845 | 532.39 | 743 | 725 | 141.1 |
| B | 4 | 80 | 16266 | 110.14 | 743 | 725 | 141.1 |
| B | 15 | 204 | 14825 | 99.93 | 743 | 725 | 141.1 |
| C | 9 | 247 | 29985 | 177.08 | 714 | 718 | 165.3 |
| C | 14 | 48 | 26910 | 158.47 | 714 | 718 | 165.3 |
| C | 12 | 4 | 13964 | 80.14 | 714 | 718 | 165.3 |
| D | 7 | 67 | 159504 | 957.7 | 699 | 682 | 165.8 |
| D | 13 | 235 | 121215 | 726.81 | 699 | 682 | 165.8 |
| D | 13 | 239 | 113651 | 681.2 | 699 | 682 | 165.8 |
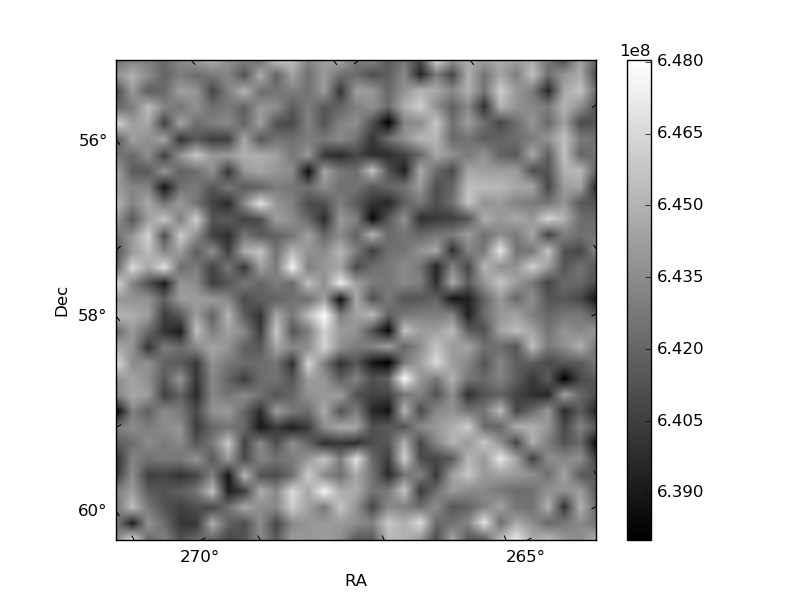
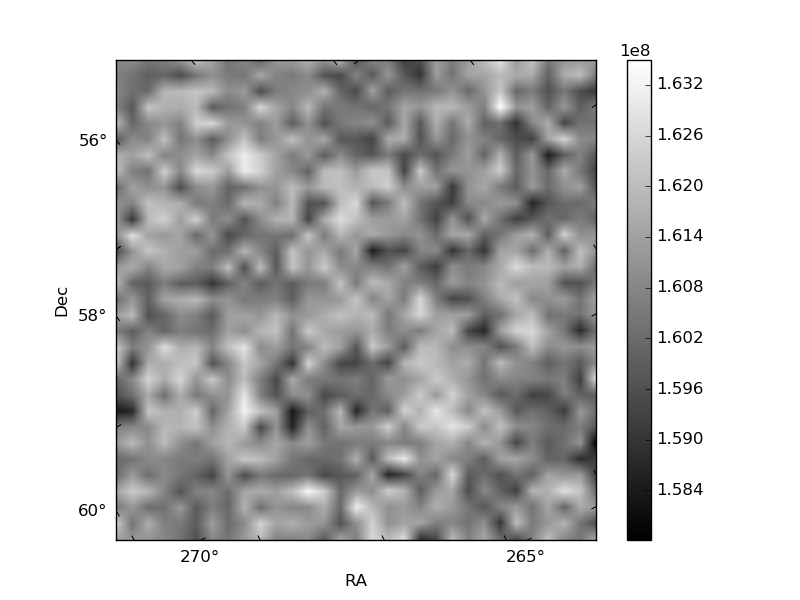
Histogram calculated using DETX and DETY for each event in the final _common_clean file
| Quadrant A | 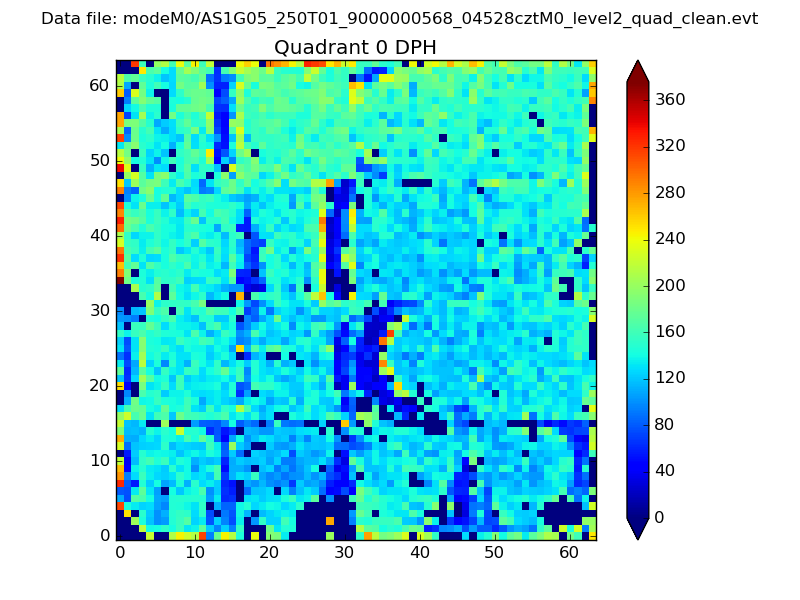 |
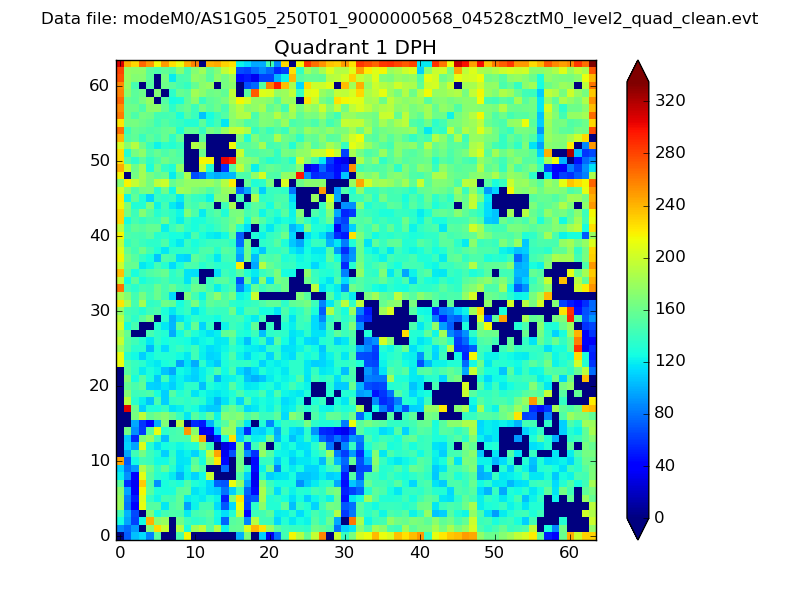 |
Quadrant B |
|---|---|---|---|
| Quadrant D | 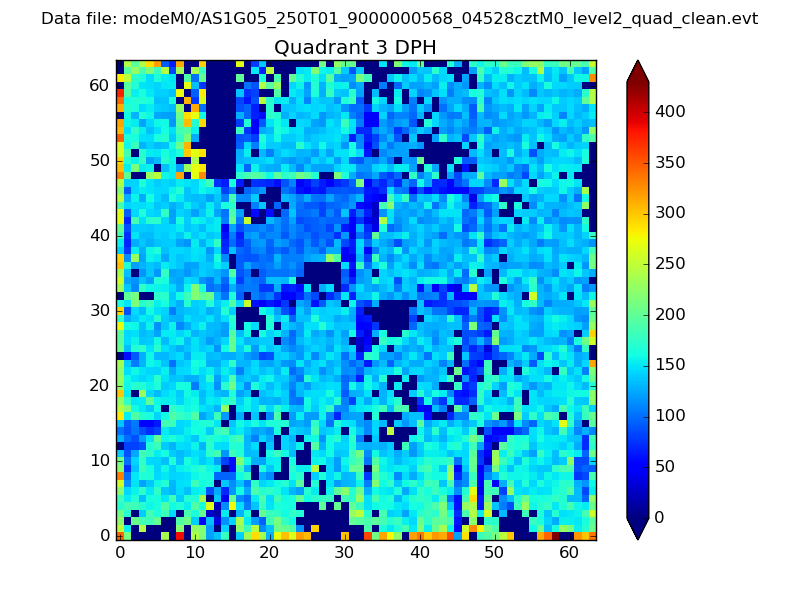 |
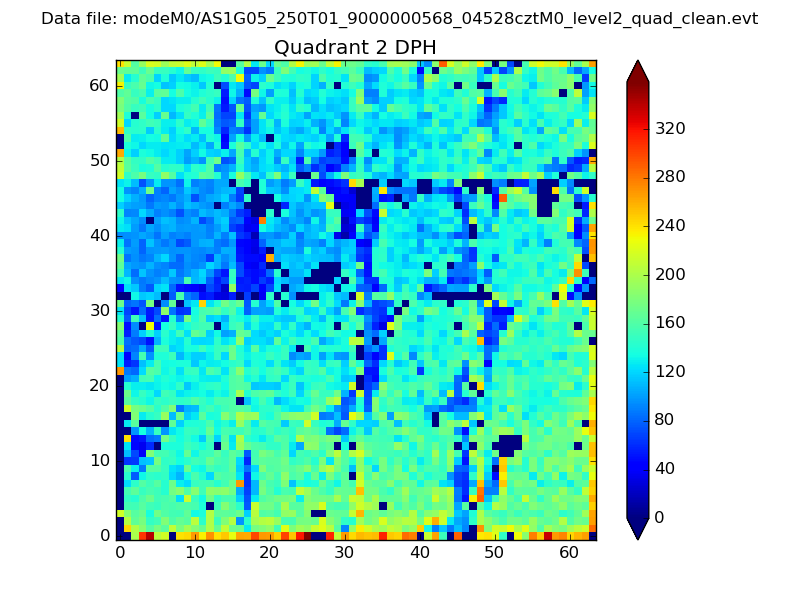 |
Quadrant C |
| Plot type | Count rate plots | Images |
|---|---|---|
| Comparison with Poisson distribution Blue bars denote a histogram of data divided into 1 sec bins. Red curve is a Poisson curve with rate = median count rate of data. |
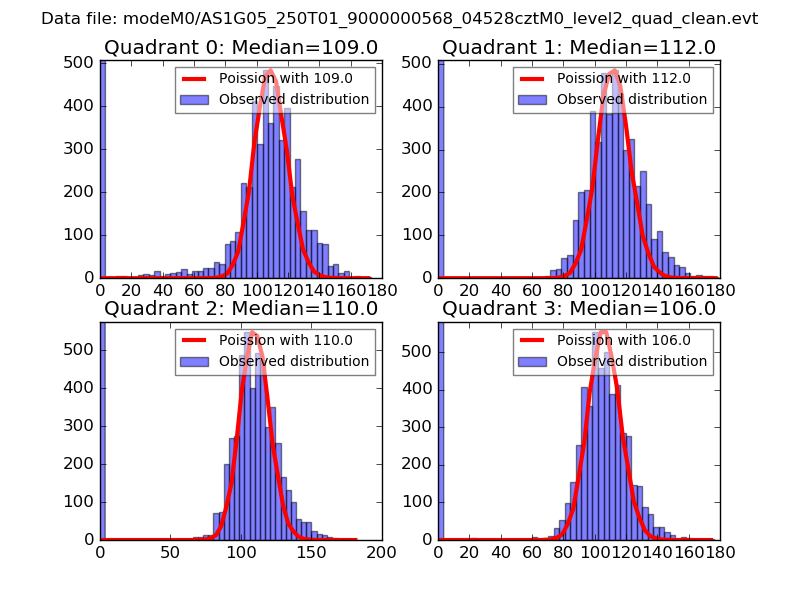 |
 |
| Quadrant-wise count rates Data is divided into 100 sec bins |
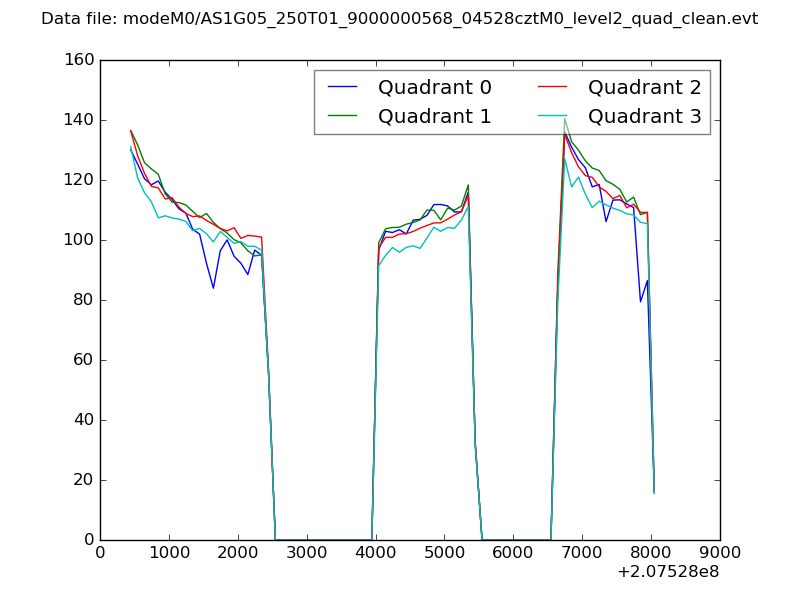 |
|
| Module-wise count rates for Quadrant A Data is divided into 100 sec bins |
 |
 |
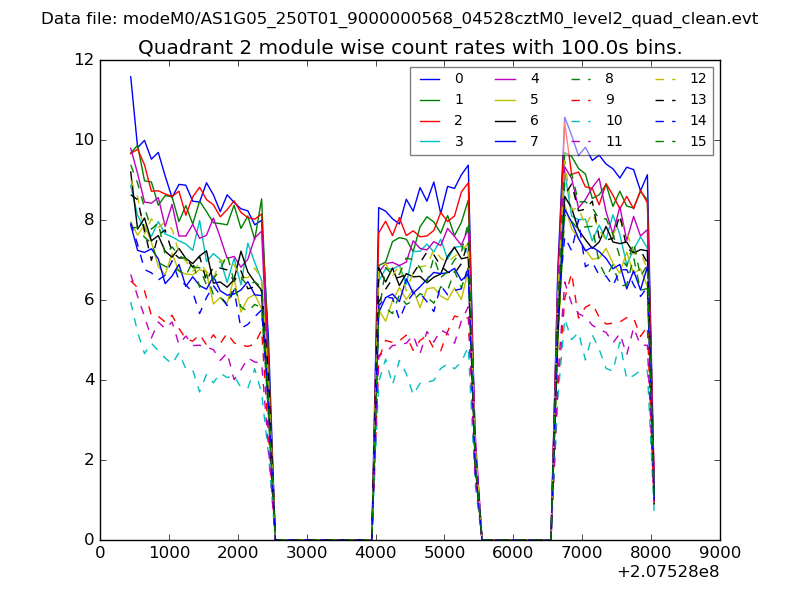
| Module-wise count rates for Quadrant B Data is divided into 100 sec bins |
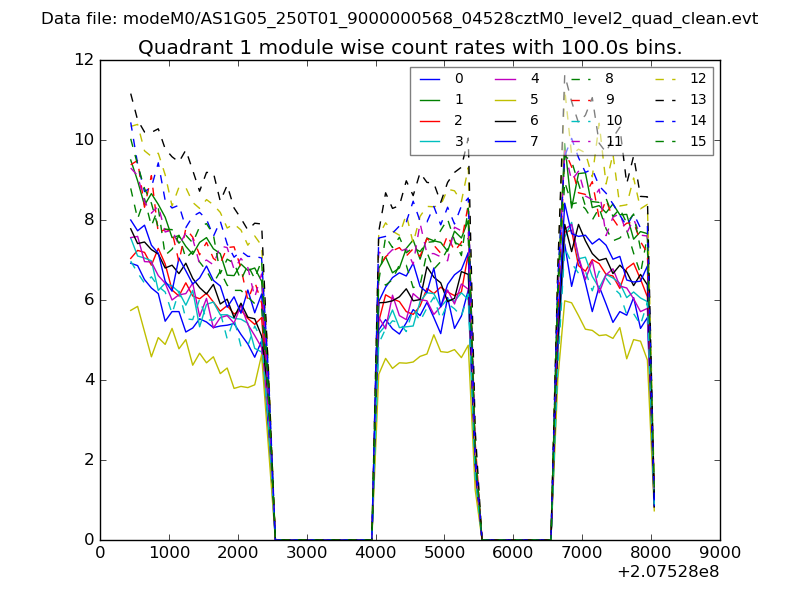 |
 |
| Module-wise count rates for Quadrant C Data is divided into 100 sec bins |
 |
 |
| Module-wise count rates for Quadrant D Data is divided into 100 sec bins |
 |
 |
| Parameter | Plot |
|---|---|
| CZT HV Monitor | 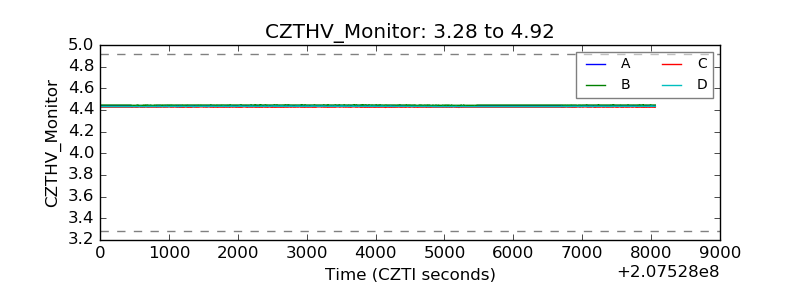 |
| D_VDD | 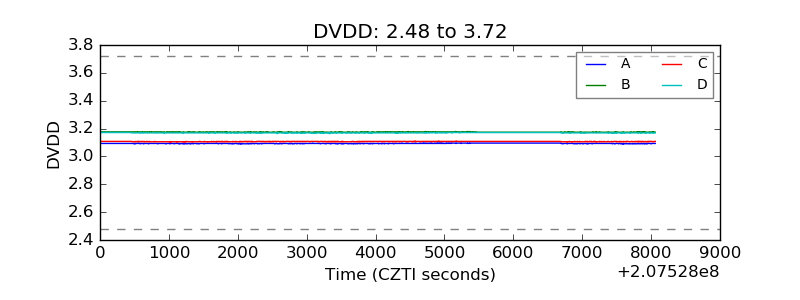 |
| Temperature 1 | 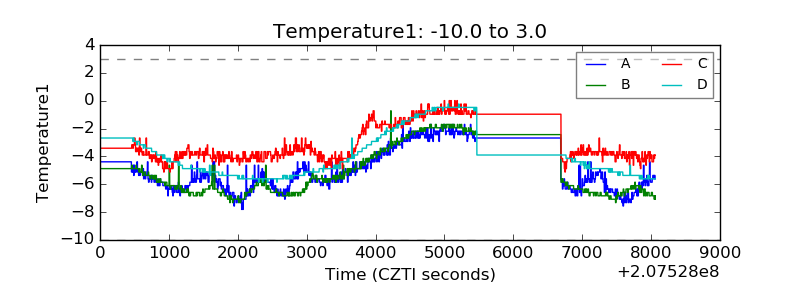 |
| Veto HV Monitor | 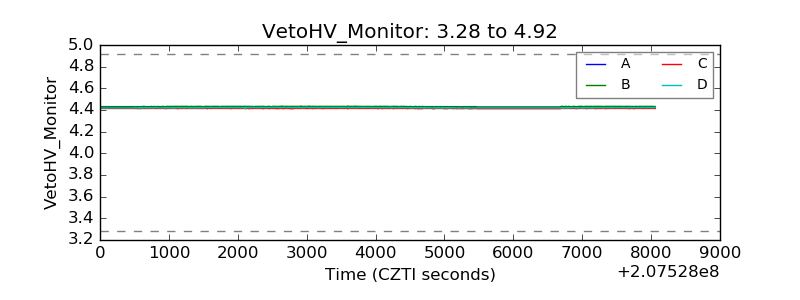 |
| Veto LLD | 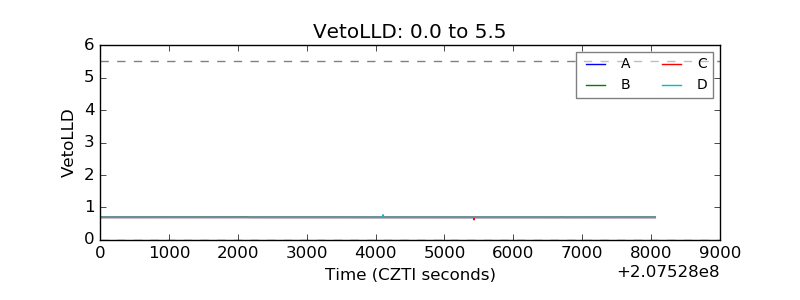 |
| Alpha Counter | 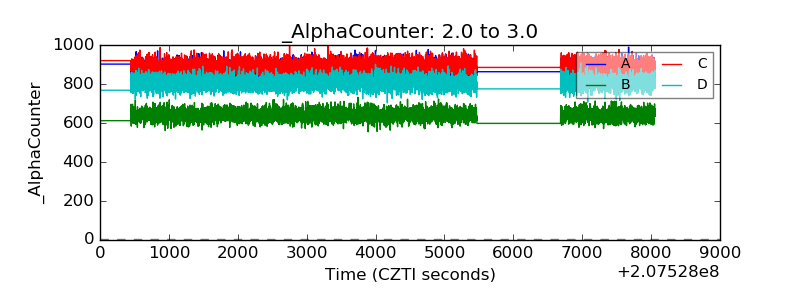 |
| _CPM_Rate | 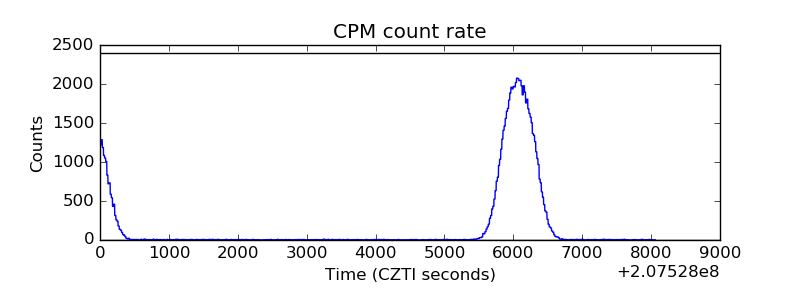 |
| CZT Counter | 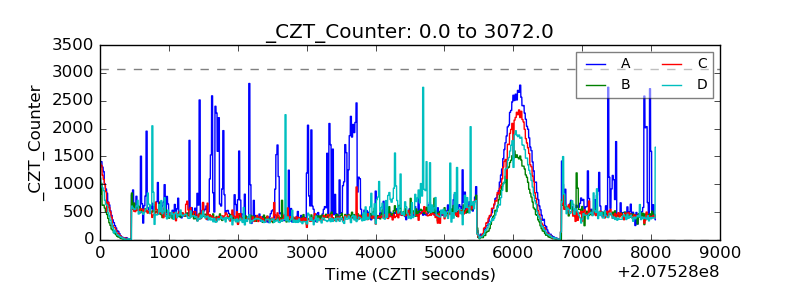 |
| +2.5 Volts monitor |  |
| +5 Volts monitor |  |
| _ROLL_ROT | 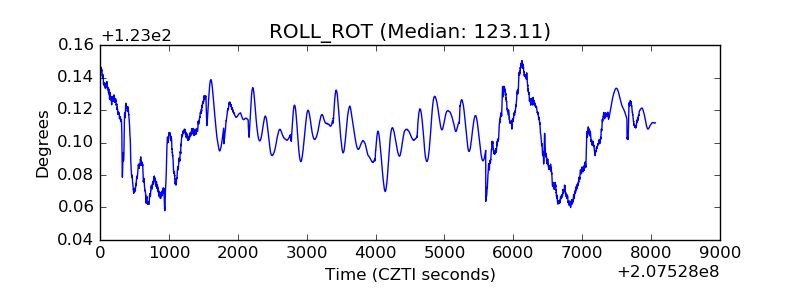 |
| _Roll_DEC | 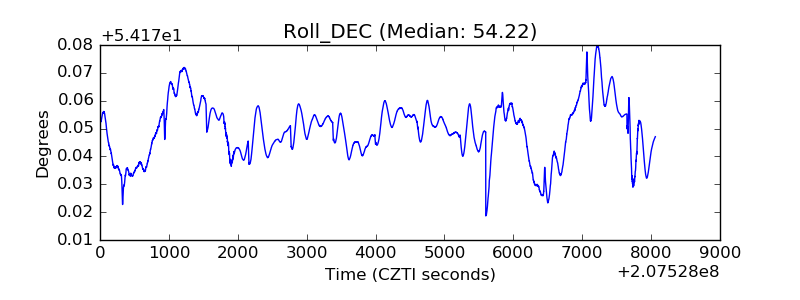 |
| _Roll_RA | 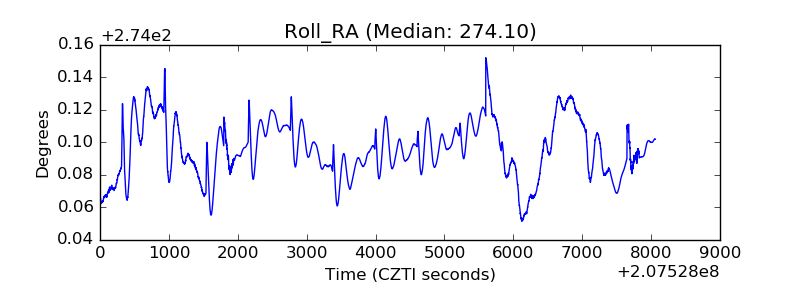 |
| Veto Counter | 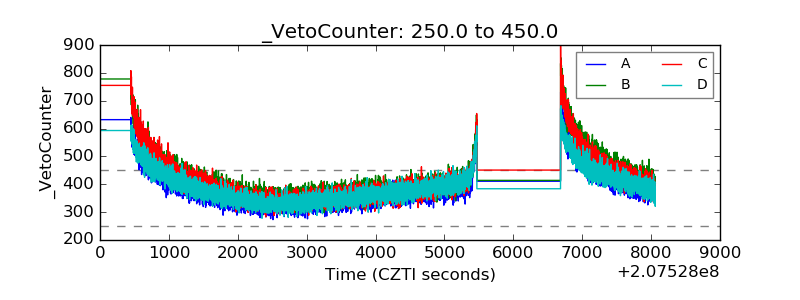 |