| Param | Original file | Final file |
|---|---|---|
| Filename | modeM0/AS1G05_250T01_9000000568_04529cztM0_level2.evt | modeM0/AS1G05_250T01_9000000568_04529cztM0_level2_quad_clean.evt |
| Size (bytes) | 458,219,520 | 84,464,640 |
| Size | 437.0 MB | 80.6 MB |
| Events in quadrant A | 4,375,997 | 520,079 |
| Events in quadrant B | 3,112,890 | 550,204 |
| Events in quadrant C | 2,911,333 | 534,956 |
| Events in quadrant D | 3,051,023 | 514,947 |
| Mode M0 | |||
|---|---|---|---|
| Quadrant | BADHDUFLAG | Total packets | Discarded packets |
| A | 0 | 17309 | 3 |
| B | 0 | 13371 | 2 |
| C | 0 | 13062 | 2 |
| D | 0 | 13713 | 2 |
| Mode SS | |||
|---|---|---|---|
| Quadrant | BADHDUFLAG | Total packets | Discarded packets |
| A | 0 | 128 | 0 |
| B | 0 | 128 | 0 |
| C | 0 | 128 | 0 |
| D | 0 | 128 | 0 |
| Mode M9 | |||
|---|---|---|---|
| Quadrant | BADHDUFLAG | Total packets | Discarded packets |
| A | 0 | 18 | 0 |
| B | 0 | 18 | 0 |
| C | 0 | 18 | 0 |
| D | 0 | 19 | 0 |
| Quadrant | Total seconds | Saturated seconds | Saturation percentage |
|---|---|---|---|
| A | 6264 | 425 | 6.784802% |
| B | 6264 | 37 | 0.590677% |
| C | 6264 | 36 | 0.574713% |
| D | 6264 | 79 | 1.261175% |
Noise dominated data is calculated using 1-second bins in cleaned event files. If a bin has >2000 counts, and if more than 50% of those come from <1% of pixels, then it is considered to be noise-dominated and hence unusable.
| Quadrant | # 1 sec bins | Bins with >0 counts | Bins with >2000 counts | High rate bins dominated by noise | Noise dominated (total time) | Noise dominated (detector-on time) | Marked lightcurve |
|---|---|---|---|---|---|---|---|
| A | 7539 | 6265 | 244 | 244 | 3.24% | 3.89% | 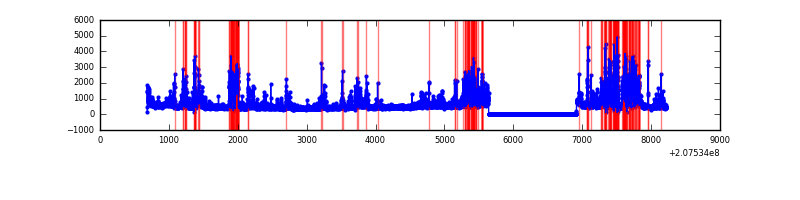 |
| B | 7539 | 6265 | 2 | 2 | 0.03% | 0.03% | 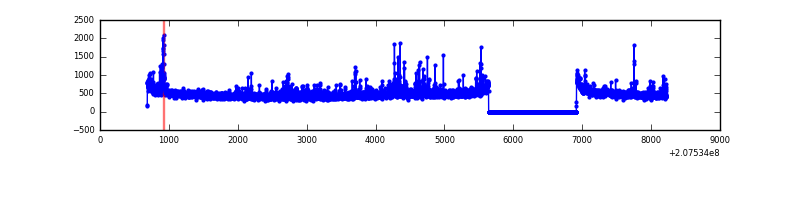 |
| C | 7539 | 6265 | 13 | 13 | 0.17% | 0.21% | 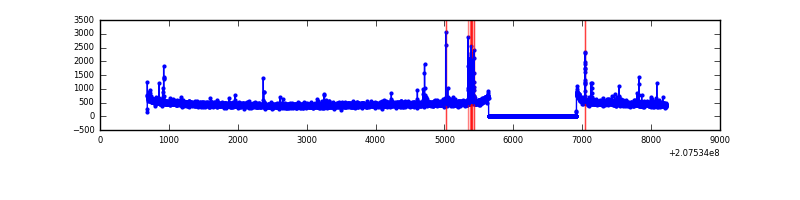 |
| D | 7539 | 6265 | 51 | 51 | 0.68% | 0.81% | 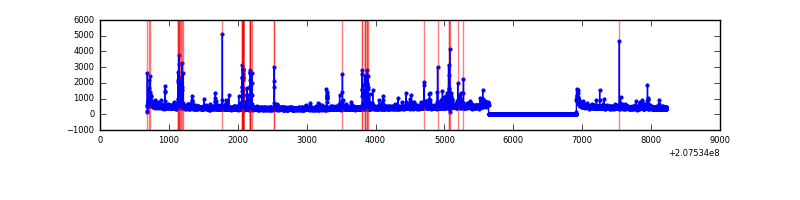 |
Top three noisy pixels from each quadrant. If the there are fewer than three noisy pixels in the level2.evt file, extra rows are filled as -1
| Pixel properties | Quadrant properties | ||||||
|---|---|---|---|---|---|---|---|
| Quadrant | DetID | PixID | Counts | Sigma | Mean | Median | Sigma |
| A | 0 | 13 | 1536351 | 10741.39 | 710 | 697 | 143.0 |
| A | 8 | 15 | 91587 | 635.75 | 710 | 697 | 143.0 |
| A | 0 | 226 | 7176 | 45.32 | 710 | 697 | 143.0 |
| B | 4 | 80 | 160213 | 1134.98 | 745 | 727 | 140.5 |
| B | 4 | 48 | 54551 | 383.04 | 745 | 727 | 140.5 |
| B | 12 | 111 | 12120 | 81.08 | 745 | 727 | 140.5 |
| C | 1 | 16 | 43330 | 258.97 | 712 | 715 | 164.6 |
| C | 14 | 48 | 41406 | 247.28 | 712 | 715 | 164.6 |
| C | 9 | 247 | 40817 | 243.7 | 712 | 715 | 164.6 |
| D | 13 | 235 | 137968 | 806.44 | 696 | 679 | 170.2 |
| D | 2 | 14 | 68467 | 398.19 | 696 | 679 | 170.2 |
| D | 12 | 110 | 66786 | 388.32 | 696 | 679 | 170.2 |
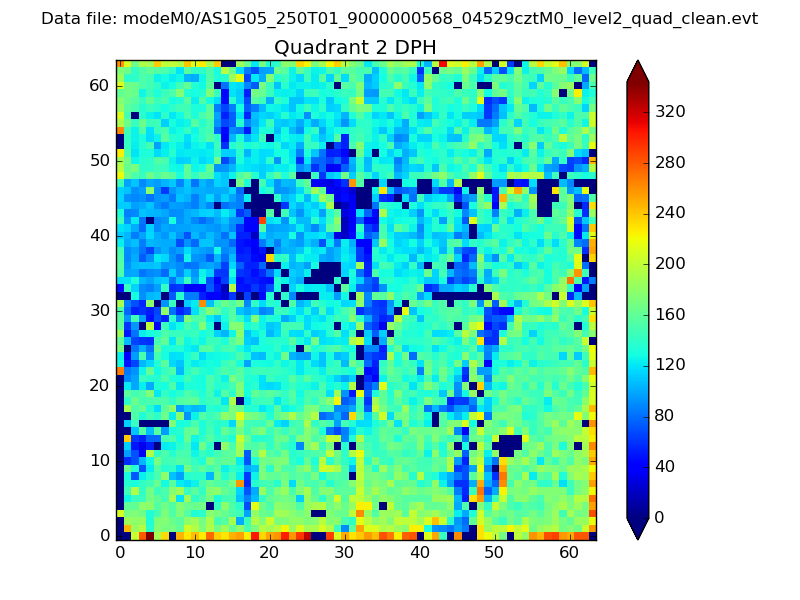
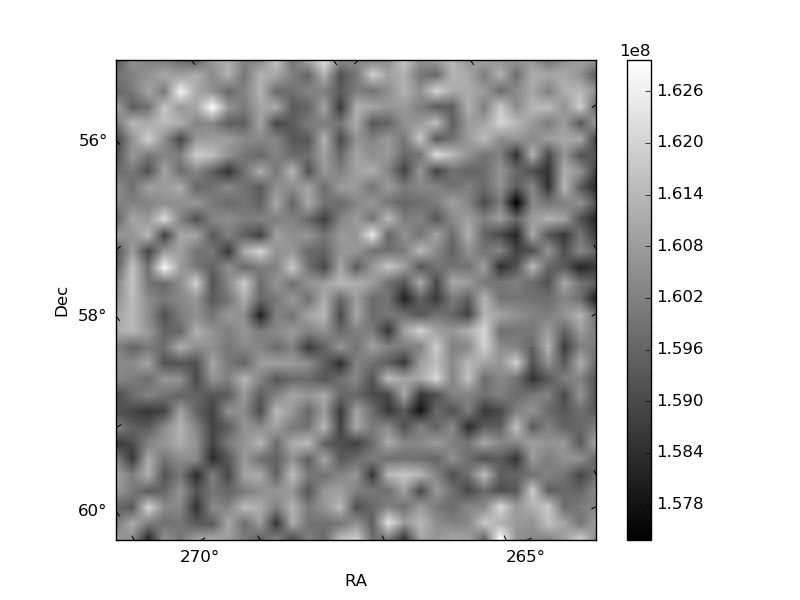
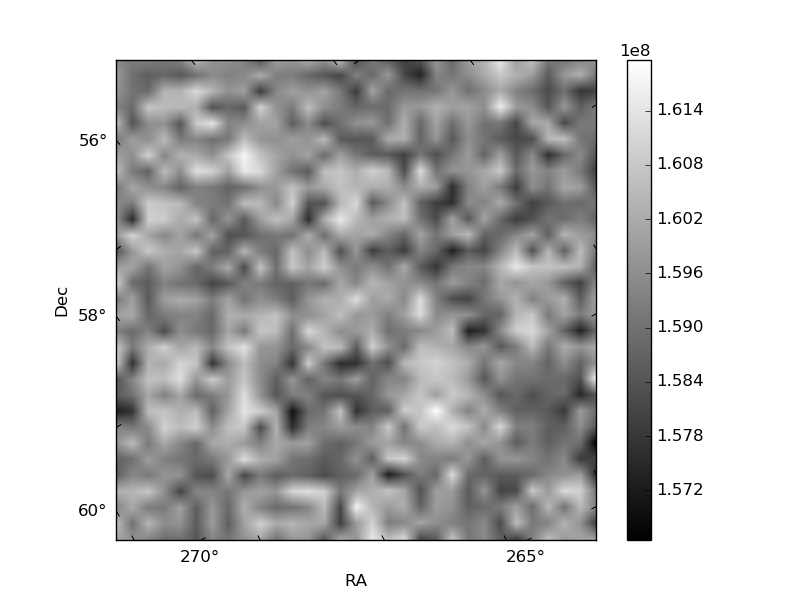
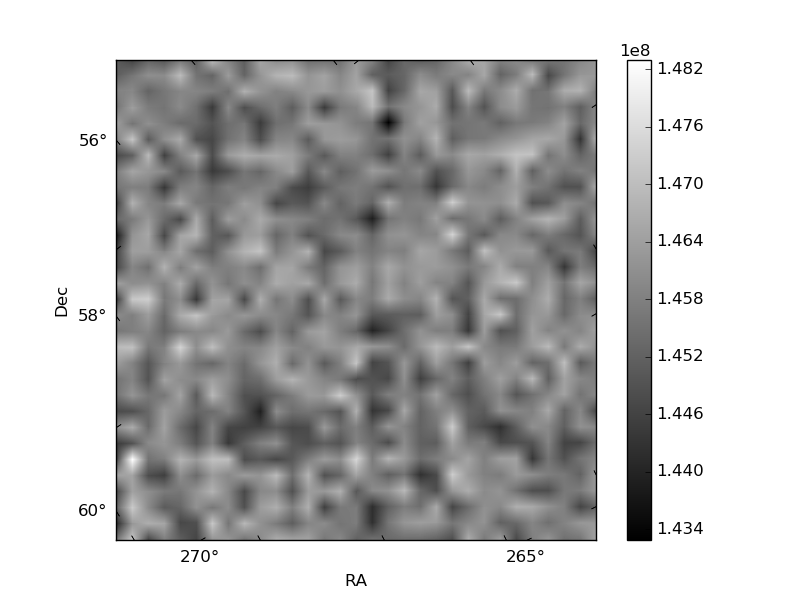
Histogram calculated using DETX and DETY for each event in the final _common_clean file
| Quadrant A |  |
 |
Quadrant B |
|---|---|---|---|
| Quadrant D | 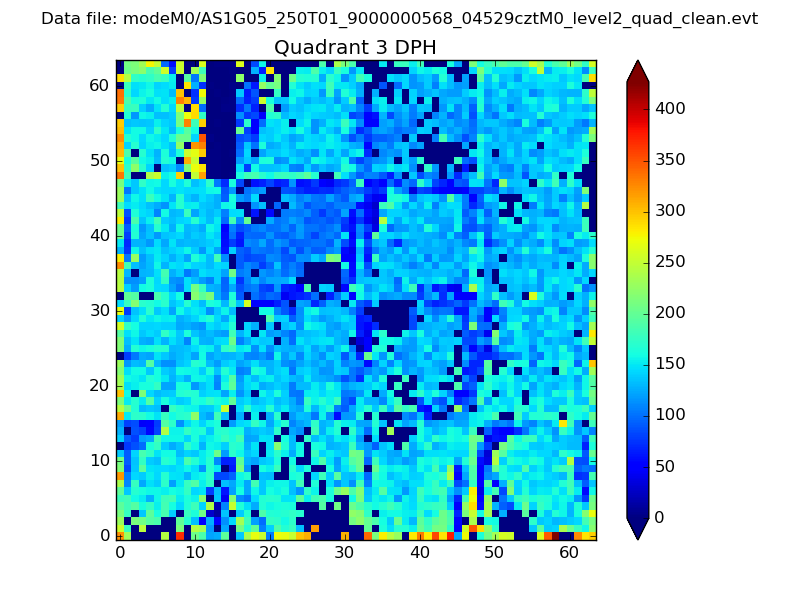 |
 |
Quadrant C |
| Plot type | Count rate plots | Images |
|---|---|---|
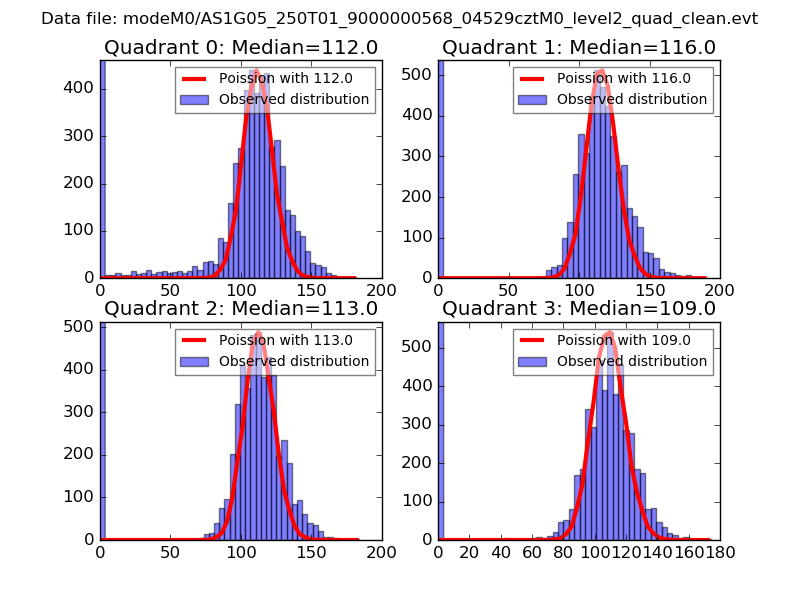
| Comparison with Poisson distribution Blue bars denote a histogram of data divided into 1 sec bins. Red curve is a Poisson curve with rate = median count rate of data. |
 |
 |
| Quadrant-wise count rates Data is divided into 100 sec bins |
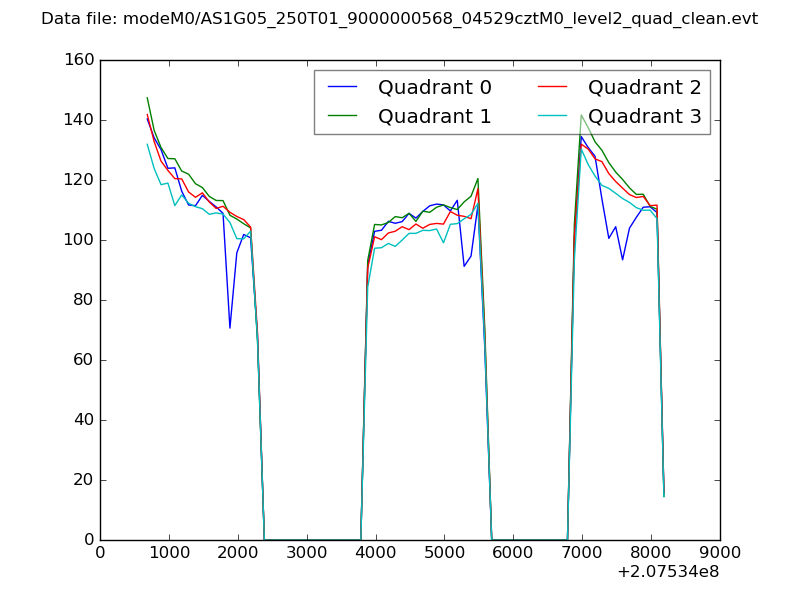 |
|
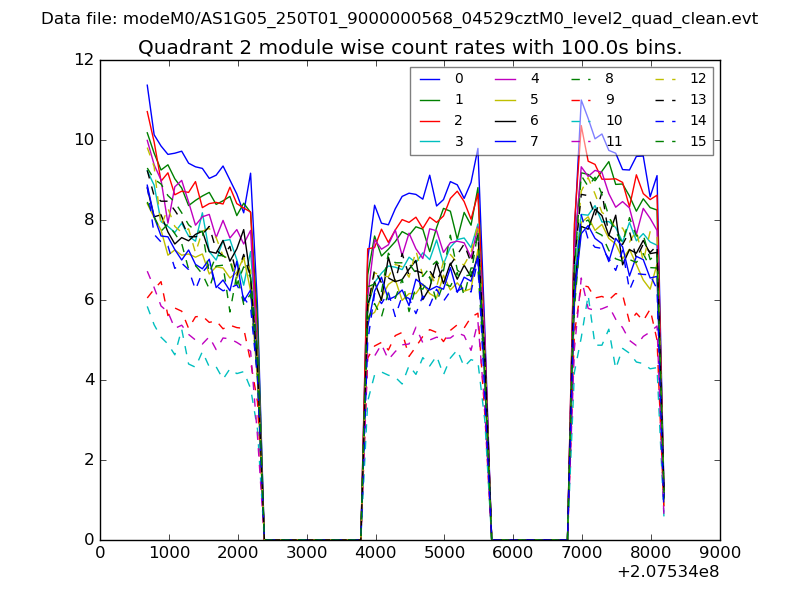
| Module-wise count rates for Quadrant A Data is divided into 100 sec bins |
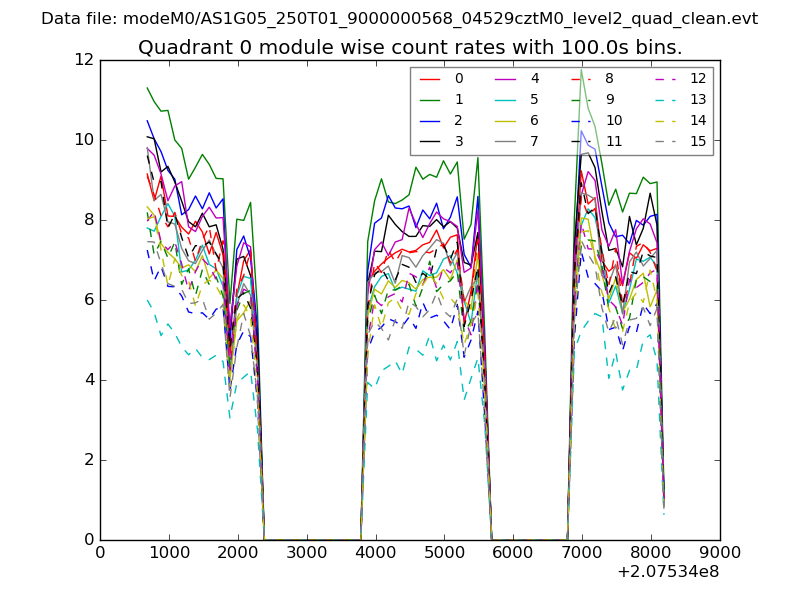 |
 |
| Module-wise count rates for Quadrant B Data is divided into 100 sec bins |
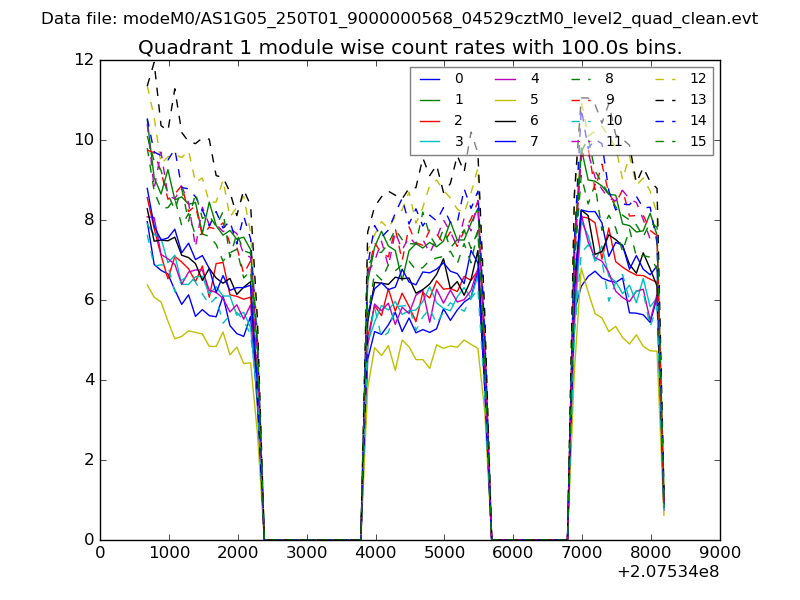 |
 |
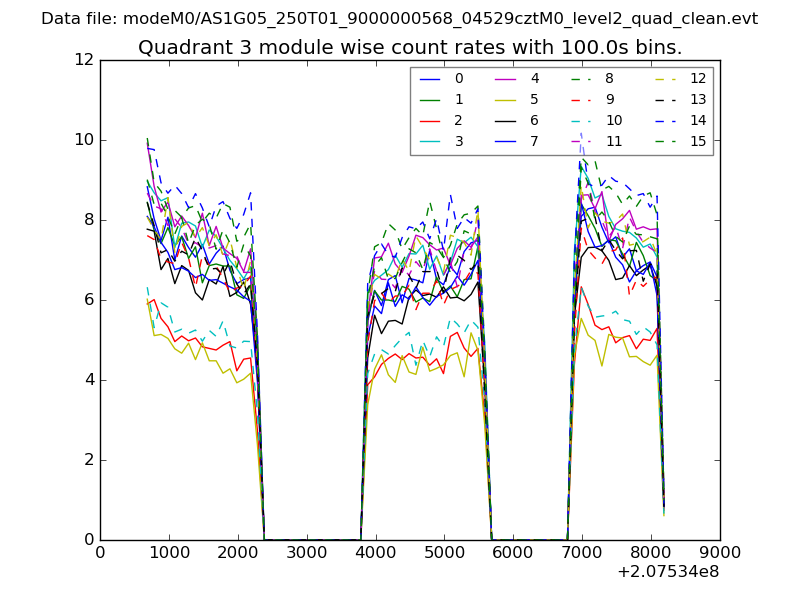
| Module-wise count rates for Quadrant C Data is divided into 100 sec bins |
 |
 |
| Module-wise count rates for Quadrant D Data is divided into 100 sec bins |
 |
 |
| Parameter | Plot |
|---|---|
| CZT HV Monitor | 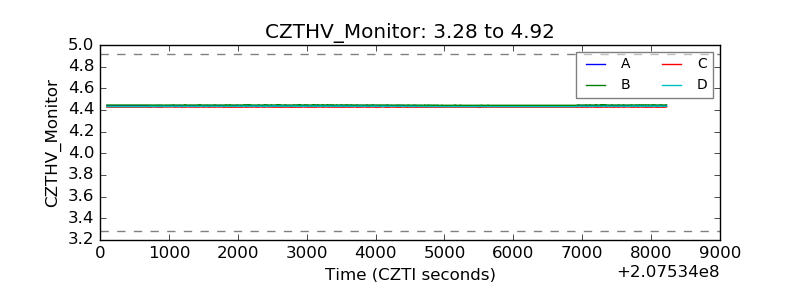 |
| D_VDD | 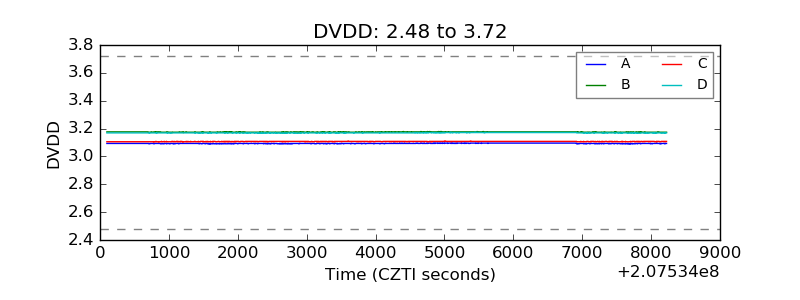 |
| Temperature 1 | 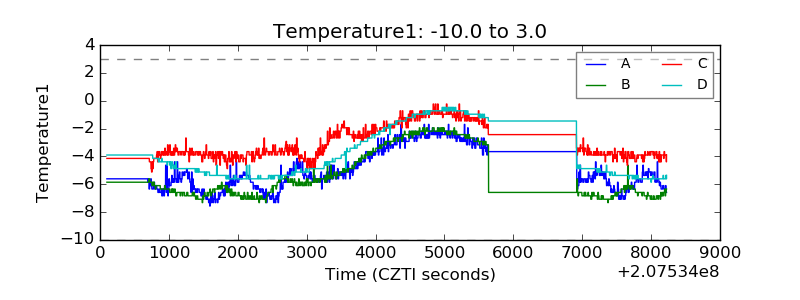 |
| Veto HV Monitor | 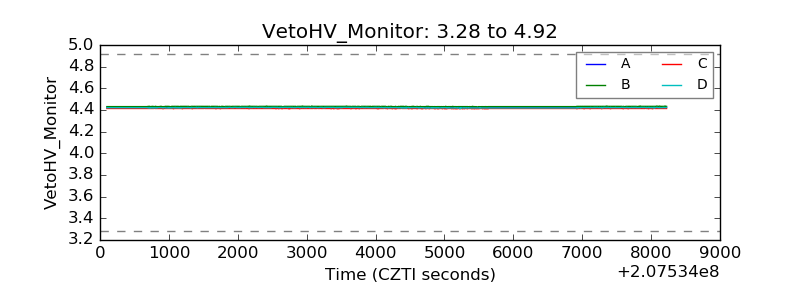 |
| Veto LLD | 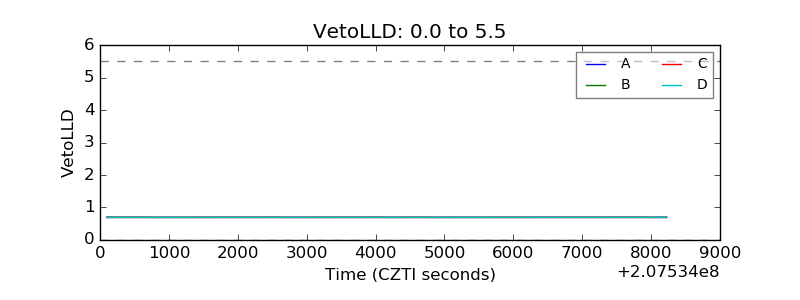 |
| Alpha Counter | 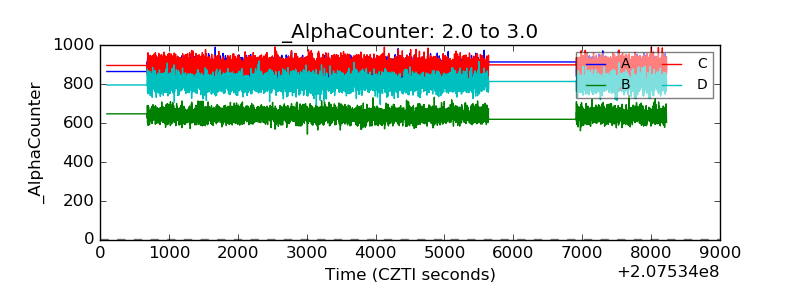 |
| _CPM_Rate | 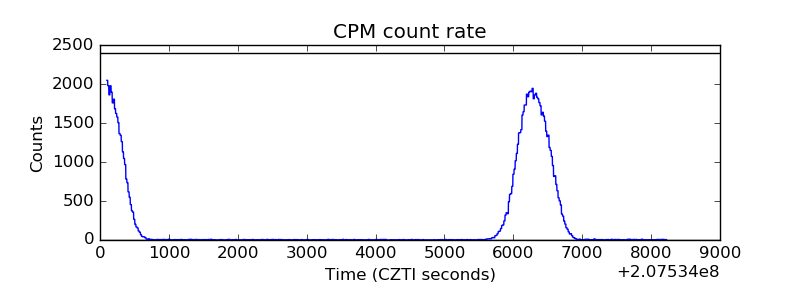 |
| CZT Counter | 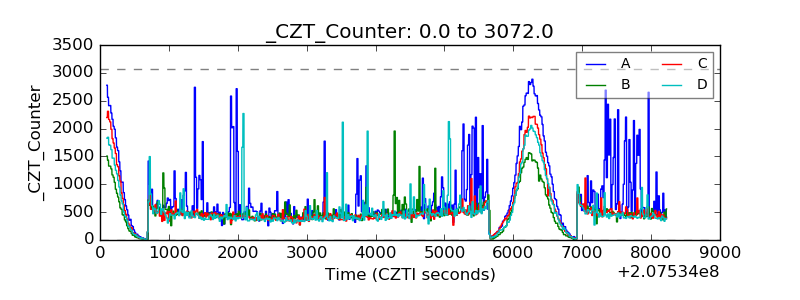 |
| +2.5 Volts monitor |  |
| +5 Volts monitor |  |
| _ROLL_ROT | 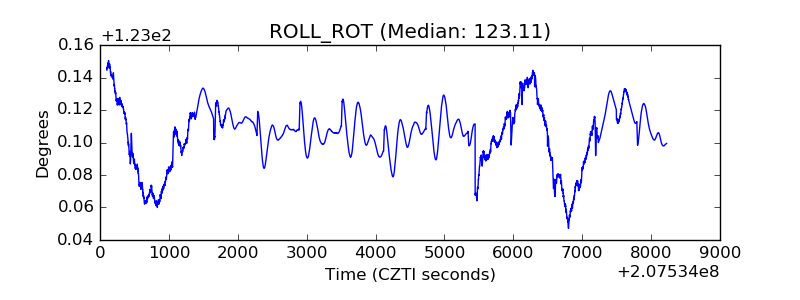 |
| _Roll_DEC | 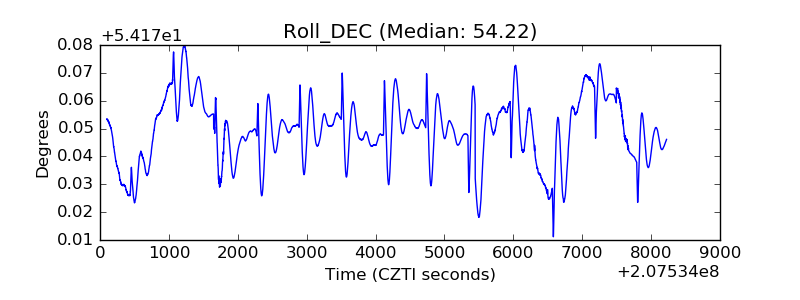 |
| _Roll_RA | 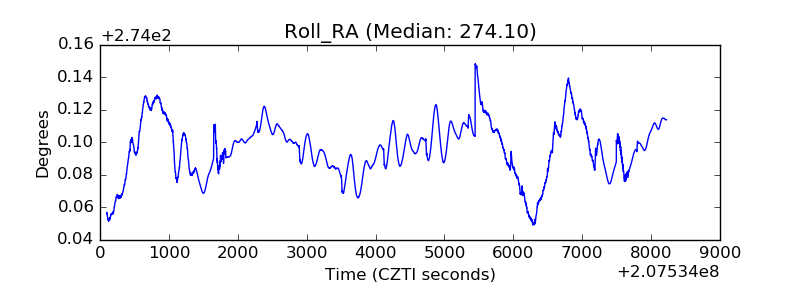 |
| Veto Counter | 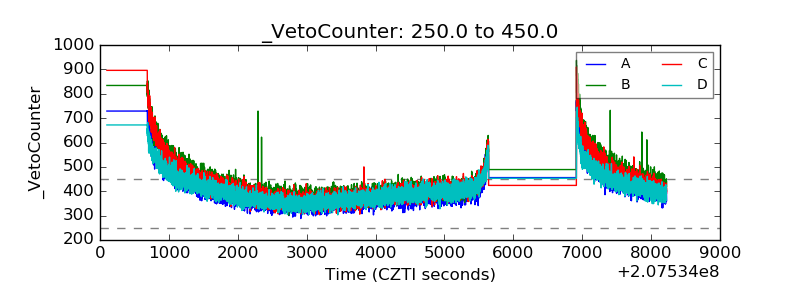 |