| Param | Original file | Final file |
|---|---|---|
| Filename | modeM0/AS1G05_250T01_9000000568_04530cztM0_level2.evt | modeM0/AS1G05_250T01_9000000568_04530cztM0_level2_quad_clean.evt |
| Size (bytes) | 498,467,520 | 78,183,360 |
| Size | 475.4 MB | 74.6 MB |
| Events in quadrant A | 5,148,660 | 464,063 |
| Events in quadrant B | 3,252,684 | 496,965 |
| Events in quadrant C | 2,992,459 | 482,941 |
| Events in quadrant D | 3,258,142 | 467,124 |
| Mode M0 | |||
|---|---|---|---|
| Quadrant | BADHDUFLAG | Total packets | Discarded packets |
| A | 0 | 19589 | 3 |
| B | 0 | 13896 | 2 |
| C | 0 | 13454 | 2 |
| D | 0 | 14378 | 2 |
| Mode SS | |||
|---|---|---|---|
| Quadrant | BADHDUFLAG | Total packets | Discarded packets |
| A | 0 | 134 | 0 |
| B | 0 | 134 | 0 |
| C | 0 | 134 | 0 |
| D | 0 | 134 | 0 |
| Mode M9 | |||
|---|---|---|---|
| Quadrant | BADHDUFLAG | Total packets | Discarded packets |
| A | 0 | 19 | 0 |
| B | 0 | 19 | 0 |
| C | 0 | 19 | 0 |
| D | 0 | 20 | 0 |
| Quadrant | Total seconds | Saturated seconds | Saturation percentage |
|---|---|---|---|
| A | 6537 | 583 | 8.918464% |
| B | 6537 | 53 | 0.810769% |
| C | 6537 | 26 | 0.397736% |
| D | 6537 | 85 | 1.300291% |
Noise dominated data is calculated using 1-second bins in cleaned event files. If a bin has >2000 counts, and if more than 50% of those come from <1% of pixels, then it is considered to be noise-dominated and hence unusable.
| Quadrant | # 1 sec bins | Bins with >0 counts | Bins with >2000 counts | High rate bins dominated by noise | Noise dominated (total time) | Noise dominated (detector-on time) | Marked lightcurve |
|---|---|---|---|---|---|---|---|
| A | 7897 | 6538 | 412 | 412 | 5.22% | 6.30% | 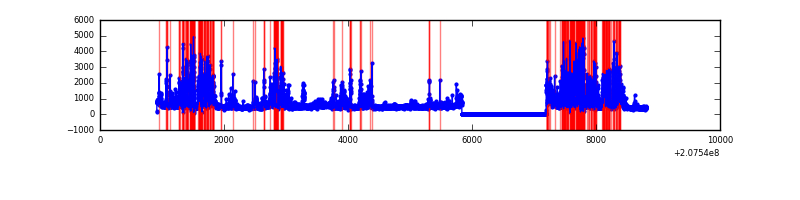 |
| B | 7897 | 6538 | 13 | 13 | 0.16% | 0.20% | 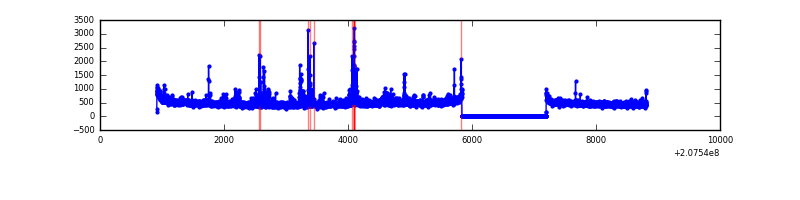 |
| C | 7897 | 6538 | 6 | 6 | 0.08% | 0.09% | 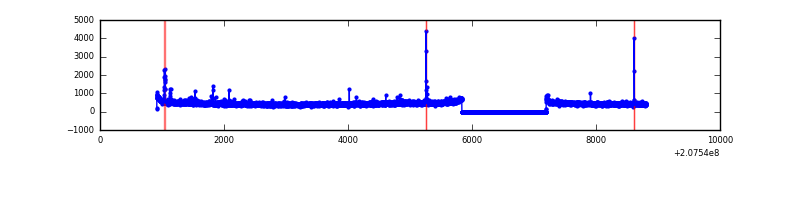 |
| D | 7897 | 6538 | 58 | 58 | 0.73% | 0.89% | 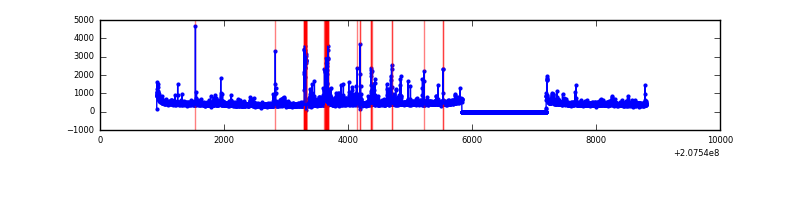 |
Top three noisy pixels from each quadrant. If the there are fewer than three noisy pixels in the level2.evt file, extra rows are filled as -1
| Pixel properties | Quadrant properties | ||||||
|---|---|---|---|---|---|---|---|
| Quadrant | DetID | PixID | Counts | Sigma | Mean | Median | Sigma |
| A | 0 | 13 | 2223366 | 15044.45 | 736 | 722 | 147.7 |
| A | 8 | 15 | 67741 | 453.63 | 736 | 722 | 147.7 |
| A | 13 | 248 | 9053 | 56.39 | 736 | 722 | 147.7 |
| B | 4 | 80 | 142685 | 976.21 | 777 | 761 | 145.4 |
| B | 4 | 48 | 45072 | 304.79 | 777 | 761 | 145.4 |
| B | 15 | 54 | 29375 | 196.82 | 777 | 761 | 145.4 |
| C | 14 | 48 | 44054 | 252.71 | 743 | 744 | 171.4 |
| C | 1 | 16 | 17384 | 97.09 | 743 | 744 | 171.4 |
| C | 9 | 247 | 13352 | 73.57 | 743 | 744 | 171.4 |
| D | 7 | 67 | 223783 | 1165.21 | 721 | 706 | 191.4 |
| D | 13 | 235 | 155949 | 810.89 | 721 | 706 | 191.4 |
| D | 2 | 136 | 33491 | 171.25 | 721 | 706 | 191.4 |
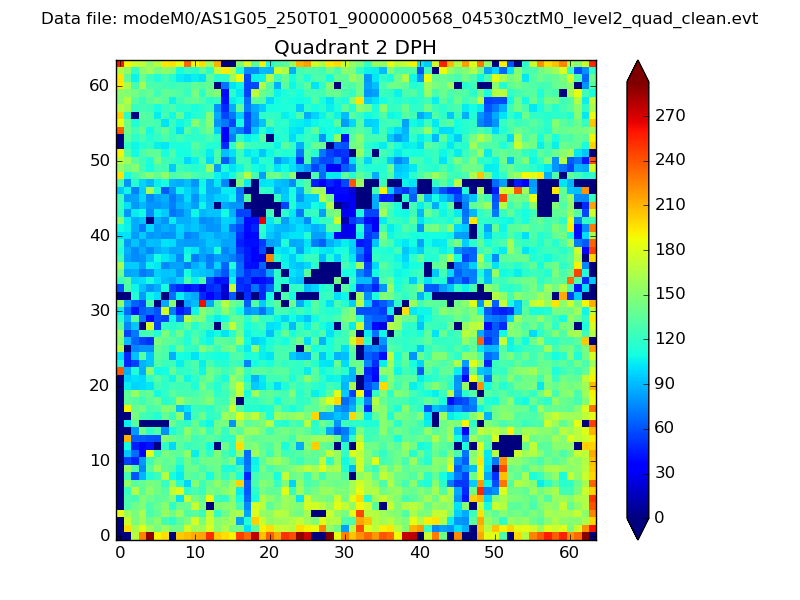
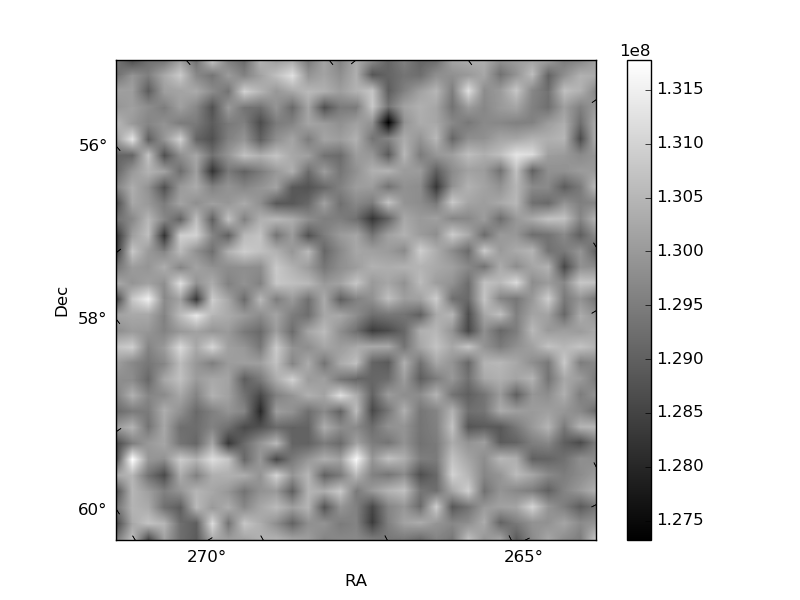
Histogram calculated using DETX and DETY for each event in the final _common_clean file
| Quadrant A |  |
 |
Quadrant B |
|---|---|---|---|
| Quadrant D | 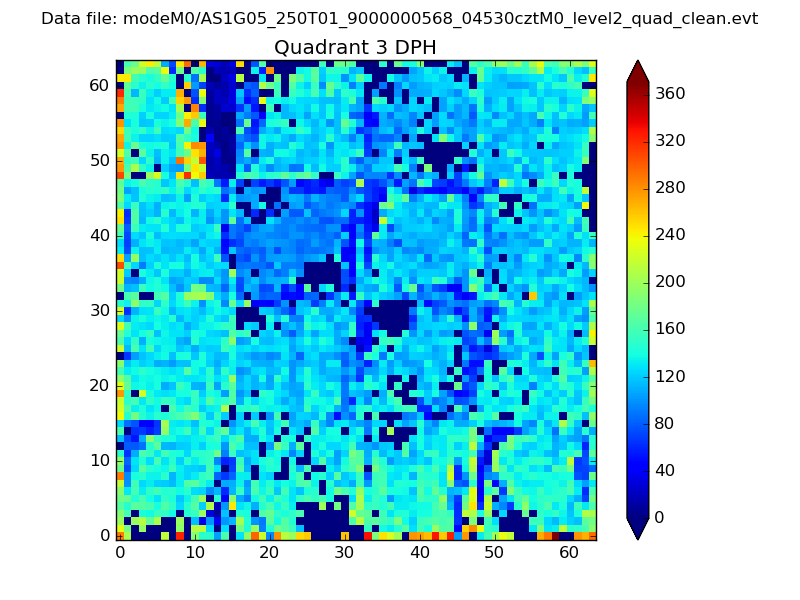 |
 |
Quadrant C |
| Plot type | Count rate plots | Images |
|---|---|---|
| Comparison with Poisson distribution Blue bars denote a histogram of data divided into 1 sec bins. Red curve is a Poisson curve with rate = median count rate of data. |
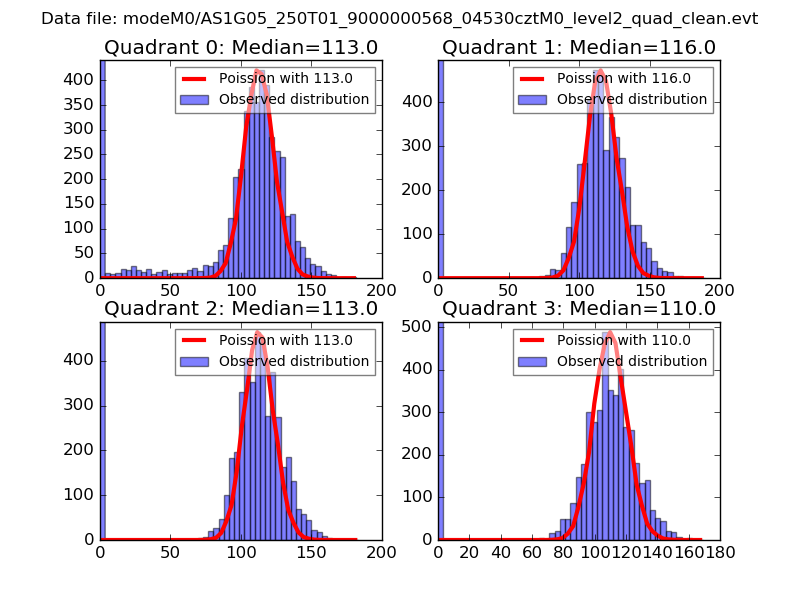 |
 |
| Quadrant-wise count rates Data is divided into 100 sec bins |
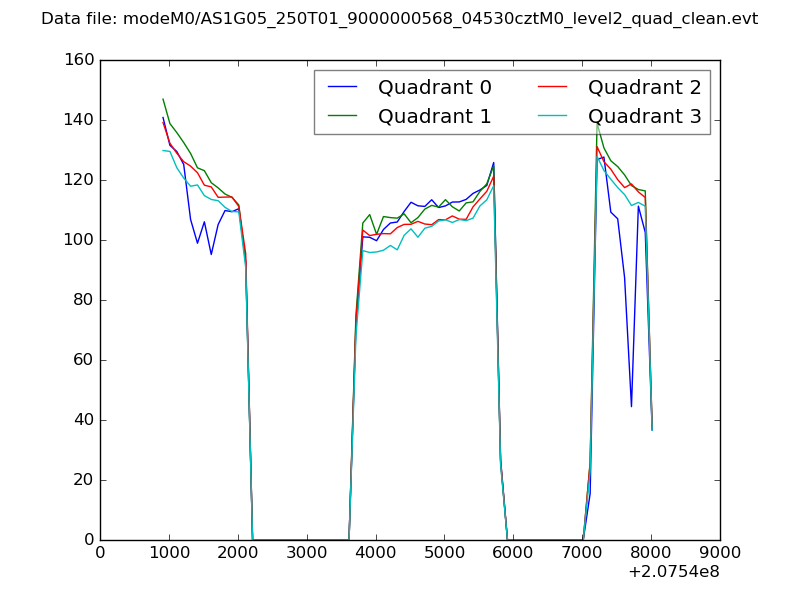 |
|
| Module-wise count rates for Quadrant A Data is divided into 100 sec bins |
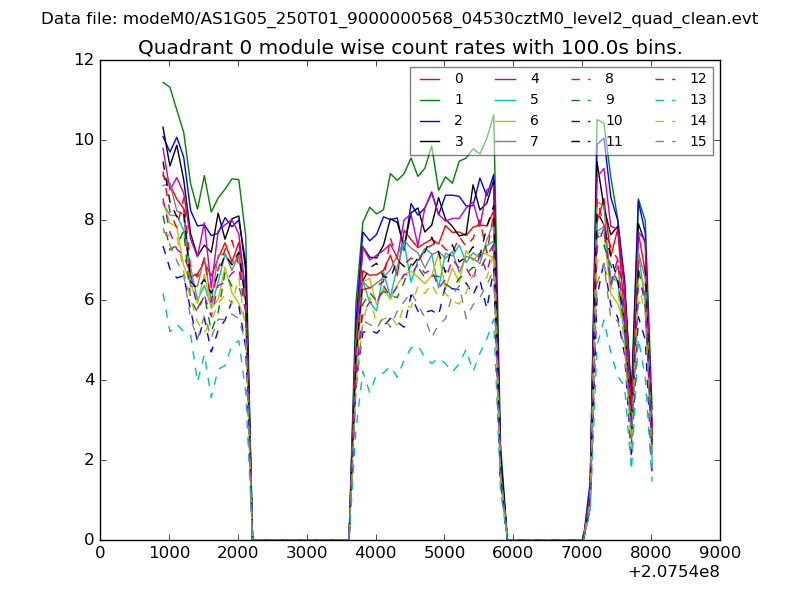 |
 |
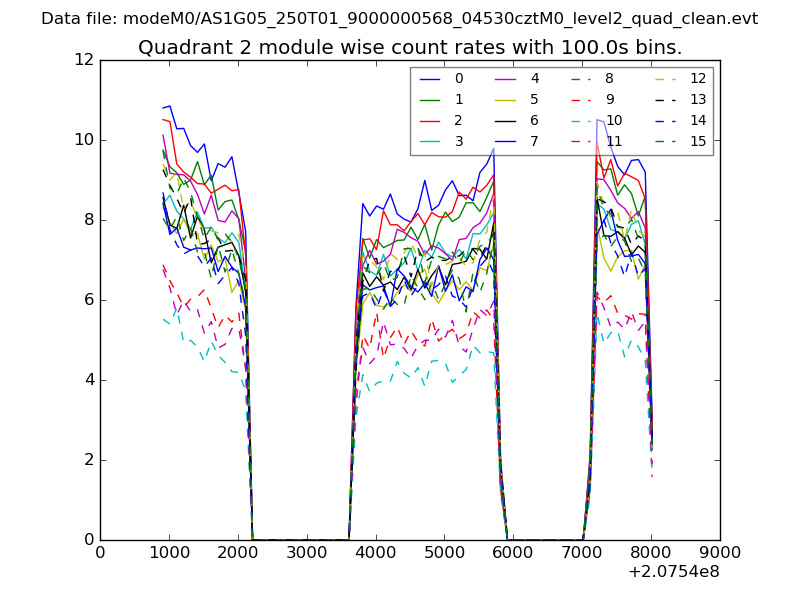
| Module-wise count rates for Quadrant B Data is divided into 100 sec bins |
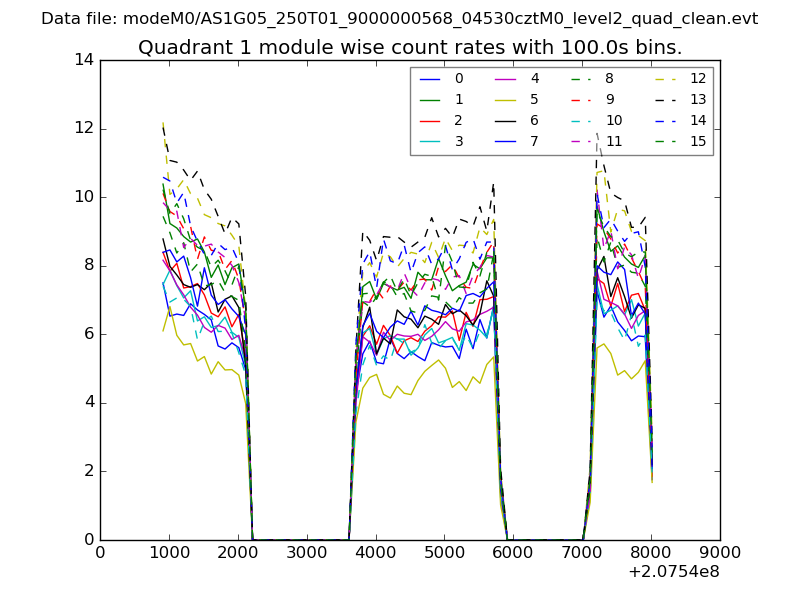 |
 |
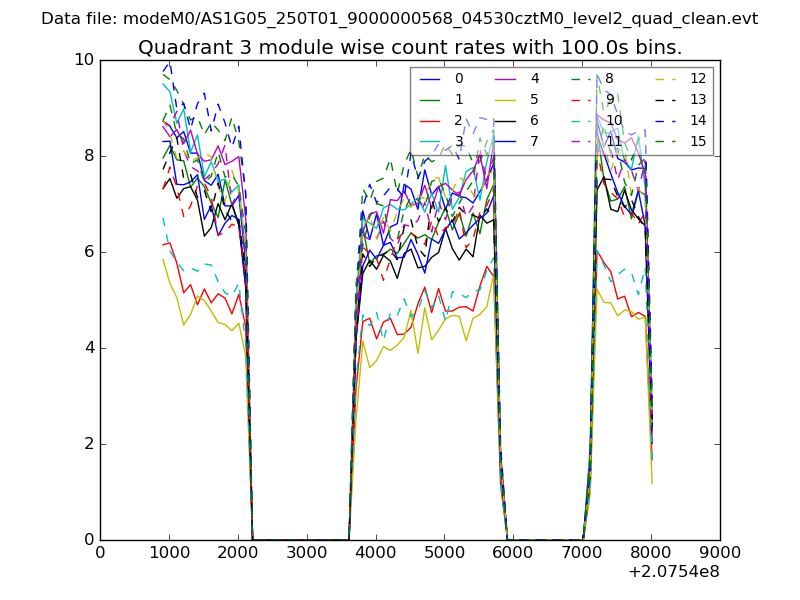
| Module-wise count rates for Quadrant C Data is divided into 100 sec bins |
 |
 |
| Module-wise count rates for Quadrant D Data is divided into 100 sec bins |
 |
 |
| Parameter | Plot |
|---|---|
| CZT HV Monitor | 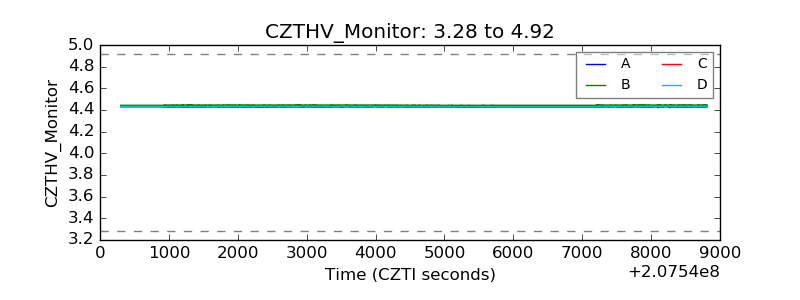 |
| D_VDD | 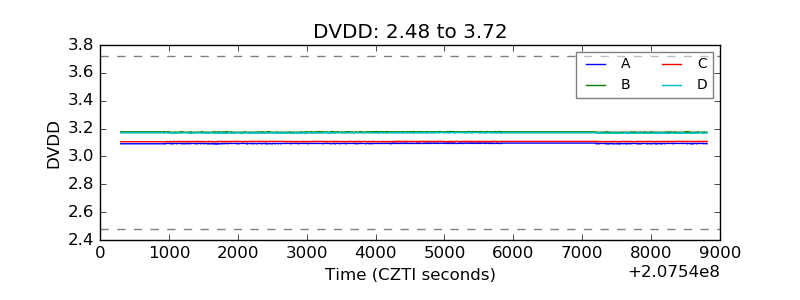 |
| Temperature 1 | 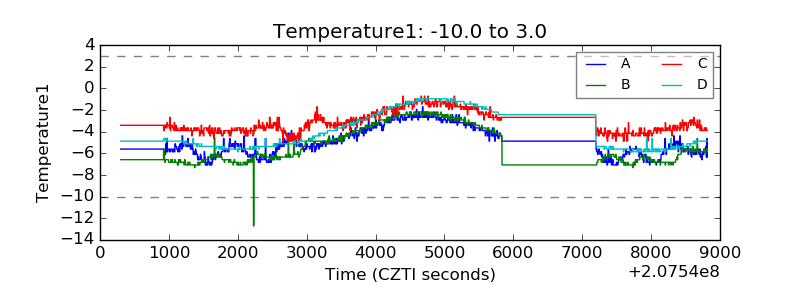 |
| Veto HV Monitor | 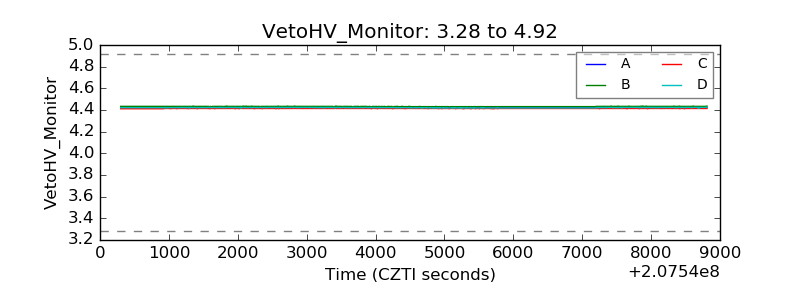 |
| Veto LLD | 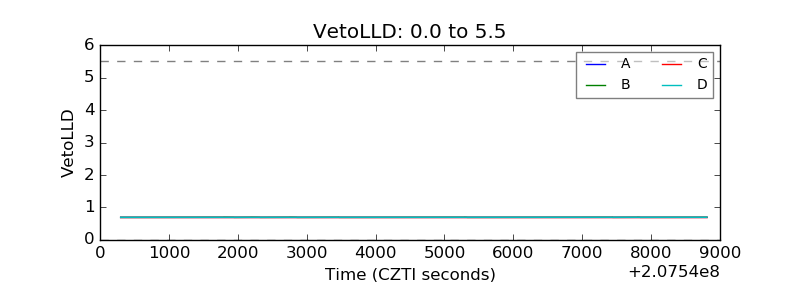 |
| Alpha Counter | 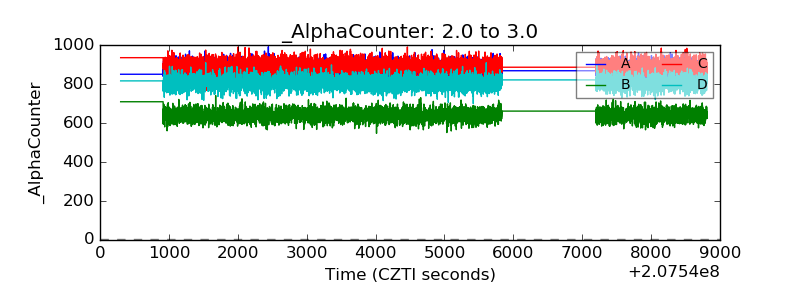 |
| _CPM_Rate | 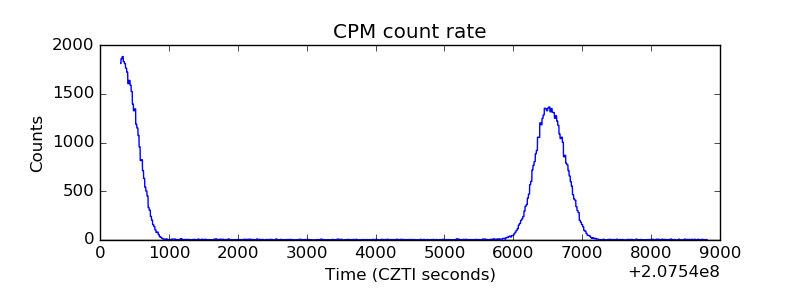 |
| CZT Counter | 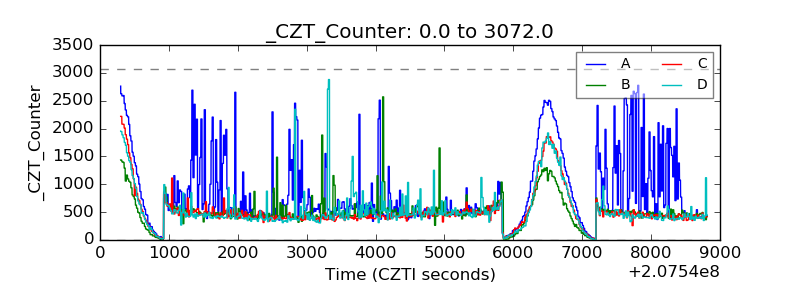 |
| +2.5 Volts monitor |  |
| +5 Volts monitor |  |
| _ROLL_ROT | 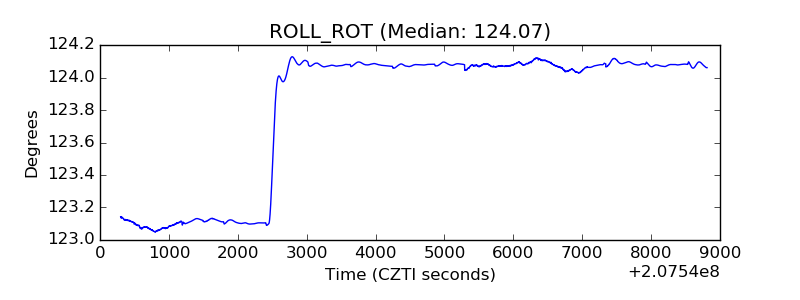 |
| _Roll_DEC | 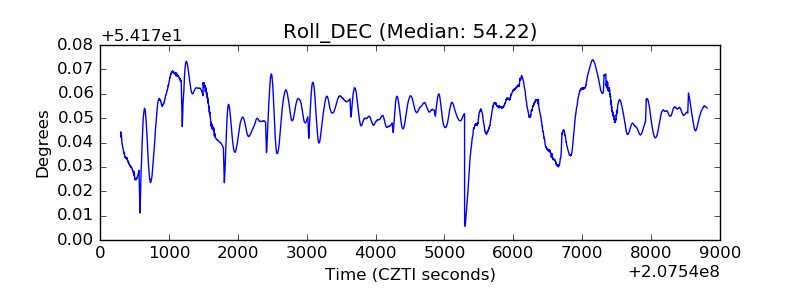 |
| _Roll_RA | 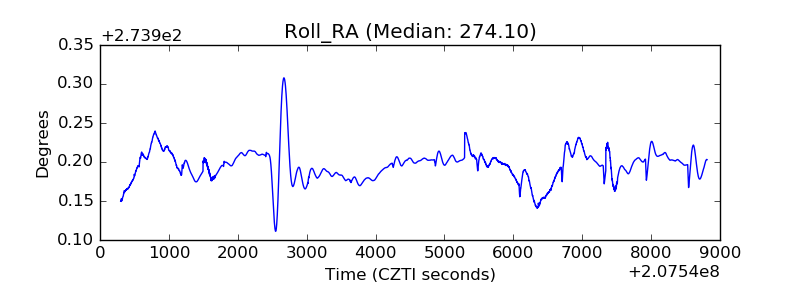 |
| Veto Counter | 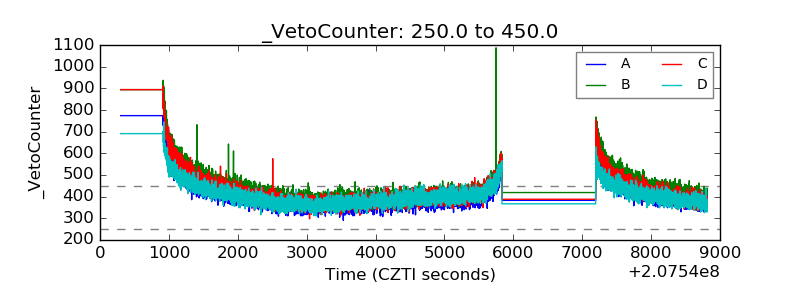 |