| Param | Original file | Final file |
|---|---|---|
| Filename | modeM0/AS1G05_250T01_9000000568_04532cztM0_level2.evt | modeM0/AS1G05_250T01_9000000568_04532cztM0_level2_quad_clean.evt |
| Size (bytes) | 270,092,160 | 35,256,960 |
| Size | 257.6 MB | 33.6 MB |
| Events in quadrant A | 2,665,204 | 154,120 |
| Events in quadrant B | 1,706,478 | 226,267 |
| Events in quadrant C | 1,650,695 | 225,704 |
| Events in quadrant D | 1,915,910 | 211,475 |
| Mode M0 | |||
|---|---|---|---|
| Quadrant | BADHDUFLAG | Total packets | Discarded packets |
| A | 0 | 23008 | 13007 |
| B | 0 | 12665 | 5172 |
| C | 0 | 12579 | 5075 |
| D | 0 | 14418 | 6204 |
| Mode SS | |||
|---|---|---|---|
| Quadrant | BADHDUFLAG | Total packets | Discarded packets |
| A | 0 | 126 | 50 |
| B | 0 | 125 | 47 |
| C | 0 | 125 | 41 |
| D | 0 | 126 | 42 |
| Mode M9 | |||
|---|---|---|---|
| Quadrant | BADHDUFLAG | Total packets | Discarded packets |
| A | 0 | 10 | 0 |
| B | 0 | 10 | 0 |
| C | 0 | 10 | 0 |
| D | 0 | 10 | 0 |
| Quadrant | Total seconds | Saturated seconds | Saturation percentage |
|---|---|---|---|
| A | 3146 | 555 | 17.641449% |
| B | 3609 | 91 | 2.521474% |
| C | 3632 | 57 | 1.569383% |
| D | 3530 | 95 | 2.691218% |
Noise dominated data is calculated using 1-second bins in cleaned event files. If a bin has >2000 counts, and if more than 50% of those come from <1% of pixels, then it is considered to be noise-dominated and hence unusable.
| Quadrant | # 1 sec bins | Bins with >0 counts | Bins with >2000 counts | High rate bins dominated by noise | Noise dominated (total time) | Noise dominated (detector-on time) | Marked lightcurve |
|---|---|---|---|---|---|---|---|
| A | 7127 | 3609 | 136 | 136 | 1.91% | 3.77% | 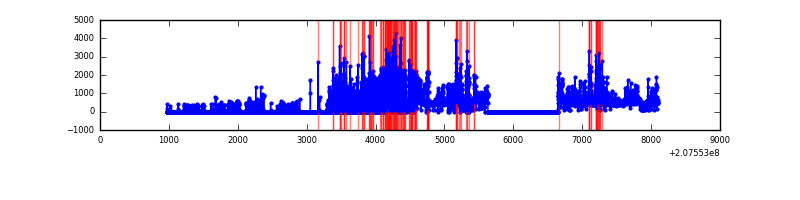 |
| B | 7086 | 4226 | 0 | 0 | 0.00% | 0.00% | 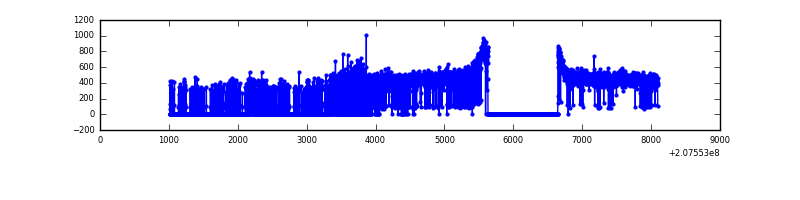 |
| C | 7076 | 4199 | 0 | 0 | 0.00% | 0.00% | 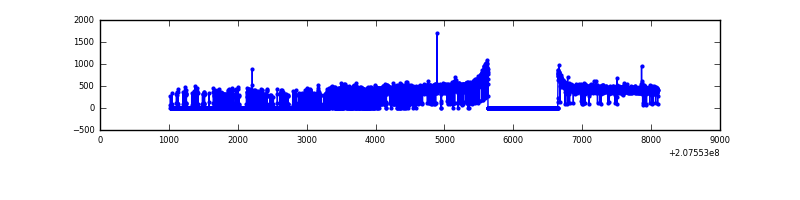 |
| D | 6976 | 4108 | 29 | 29 | 0.42% | 0.71% | 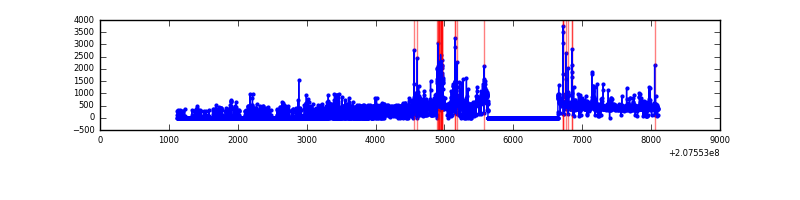 |
Top three noisy pixels from each quadrant. If the there are fewer than three noisy pixels in the level2.evt file, extra rows are filled as -1
| Pixel properties | Quadrant properties | ||||||
|---|---|---|---|---|---|---|---|
| Quadrant | DetID | PixID | Counts | Sigma | Mean | Median | Sigma |
| A | 0 | 13 | 1161390 | 15972.38 | 346 | 337 | 72.7 |
| A | 13 | 251 | 139319 | 1911.95 | 346 | 337 | 72.7 |
| A | 8 | 15 | 24945 | 338.53 | 346 | 337 | 72.7 |
| B | 7 | 252 | 15778 | 180.53 | 433 | 422 | 85.1 |
| B | 0 | 183 | 7952 | 88.52 | 433 | 422 | 85.1 |
| B | 12 | 111 | 7582 | 84.17 | 433 | 422 | 85.1 |
| C | 1 | 3 | 5793 | 54.41 | 420 | 421 | 98.7 |
| C | 13 | 61 | 3551 | 31.7 | 420 | 421 | 98.7 |
| C | 14 | 48 | 2884 | 24.95 | 420 | 421 | 98.7 |
| D | 1 | 20 | 126696 | 1211.0 | 401 | 390 | 104.3 |
| D | 13 | 235 | 75170 | 716.98 | 401 | 390 | 104.3 |
| D | 13 | 239 | 53912 | 513.16 | 401 | 390 | 104.3 |
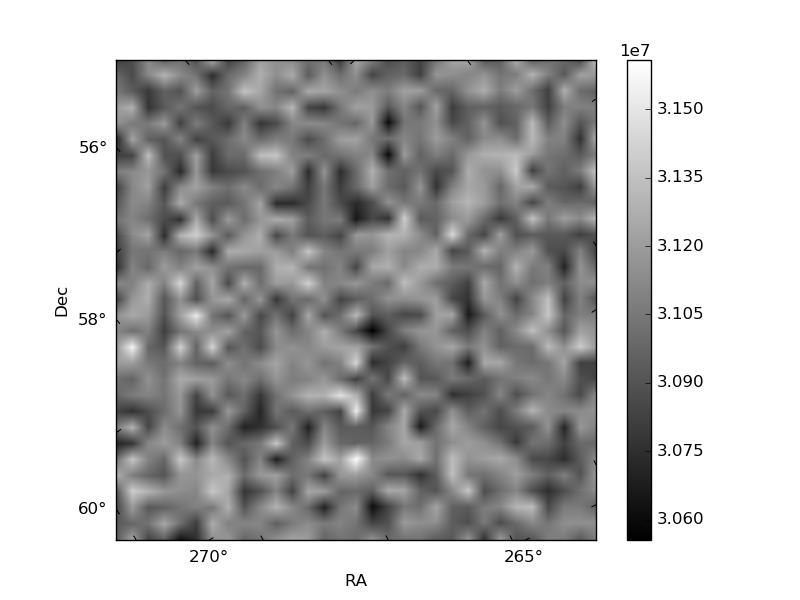
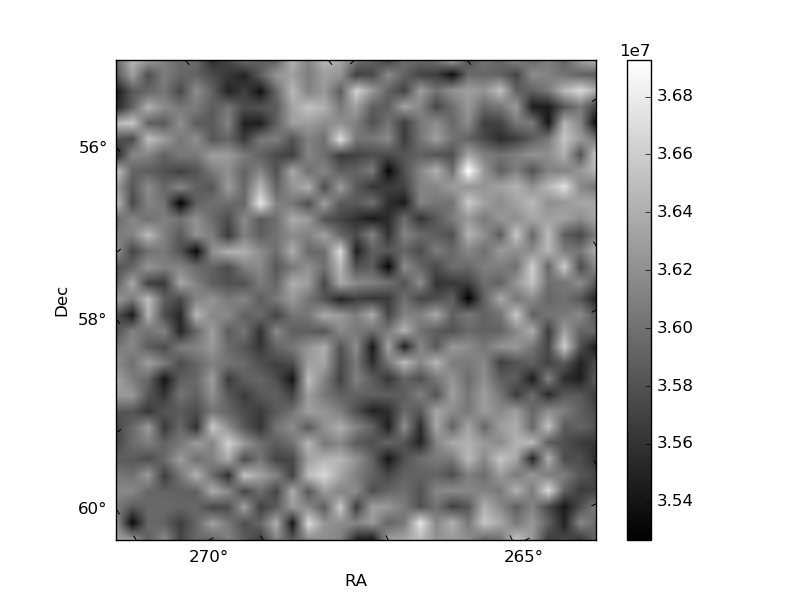
Histogram calculated using DETX and DETY for each event in the final _common_clean file
| Quadrant A | 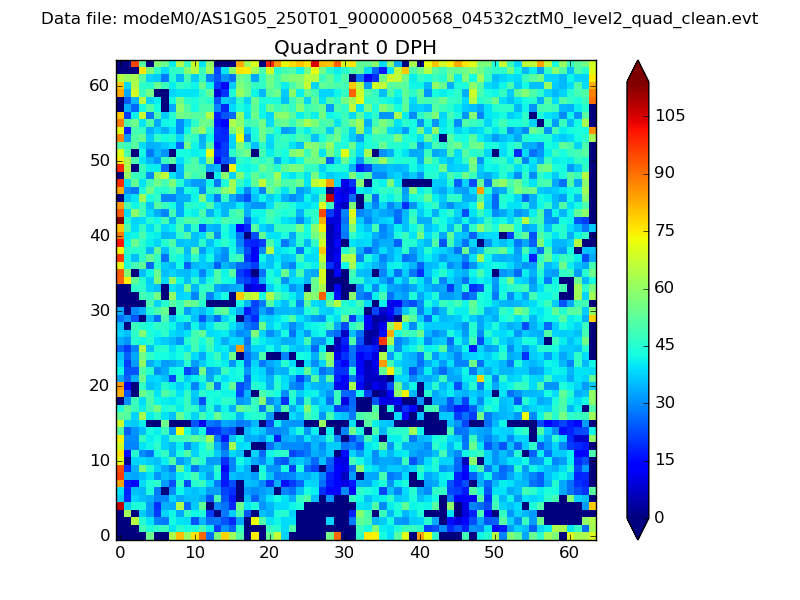 |
 |
Quadrant B |
|---|---|---|---|
| Quadrant D |  |
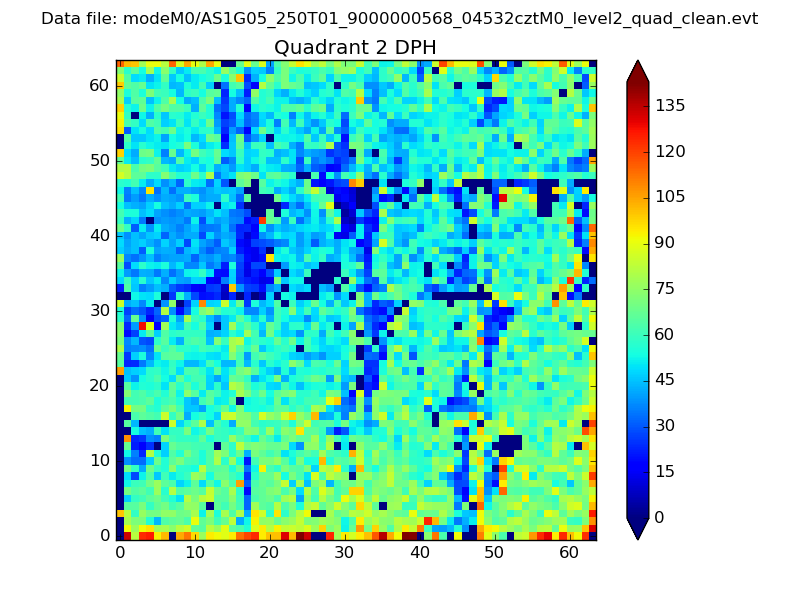 |
Quadrant C |
| Plot type | Count rate plots | Images |
|---|---|---|
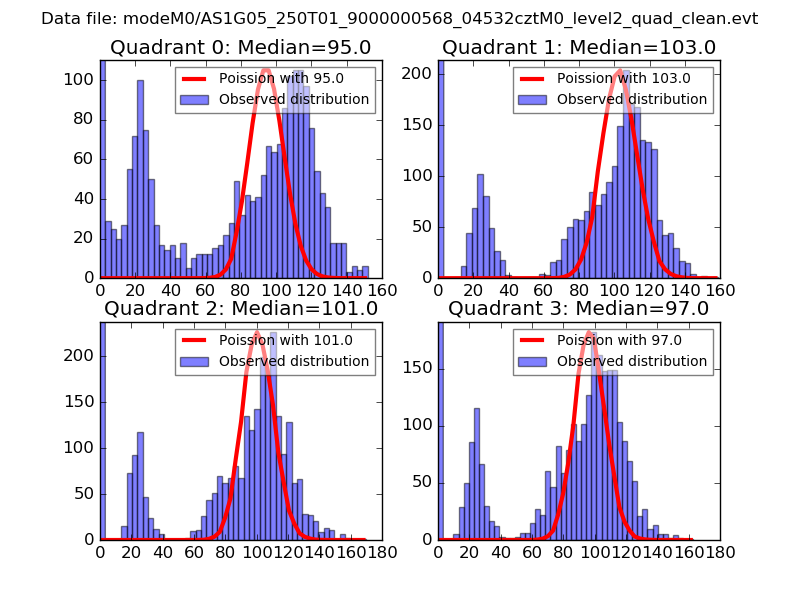
| Comparison with Poisson distribution Blue bars denote a histogram of data divided into 1 sec bins. Red curve is a Poisson curve with rate = median count rate of data. |
 |
 |
| Quadrant-wise count rates Data is divided into 100 sec bins |
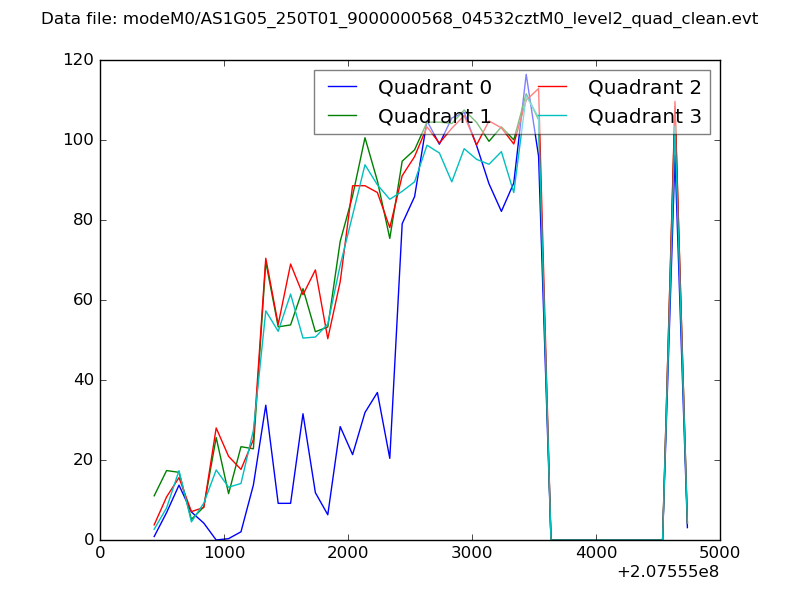 |
|
| Module-wise count rates for Quadrant A Data is divided into 100 sec bins |
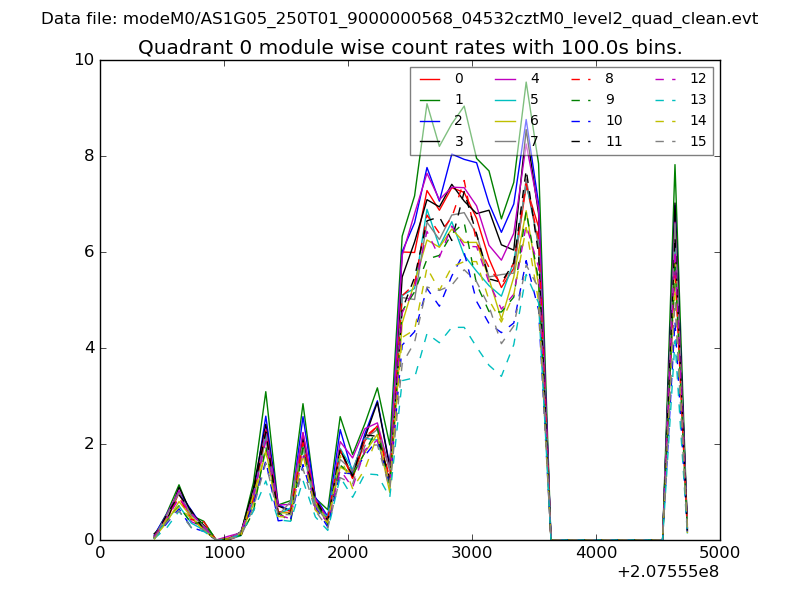 |
 |
| Module-wise count rates for Quadrant B Data is divided into 100 sec bins |
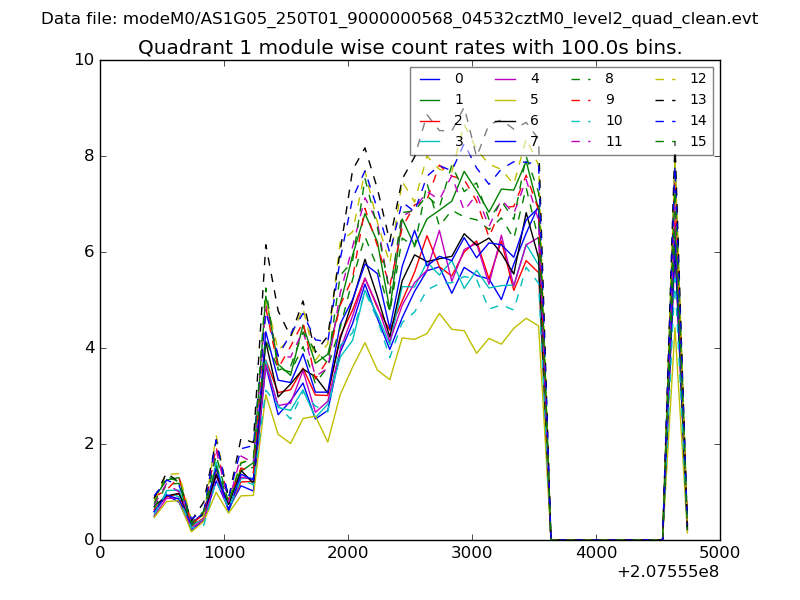 |
 |
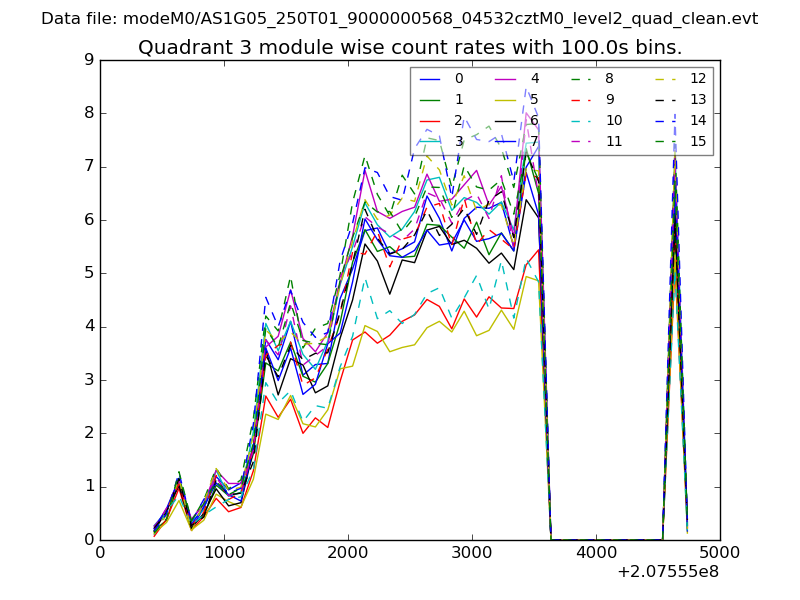
| Module-wise count rates for Quadrant C Data is divided into 100 sec bins |
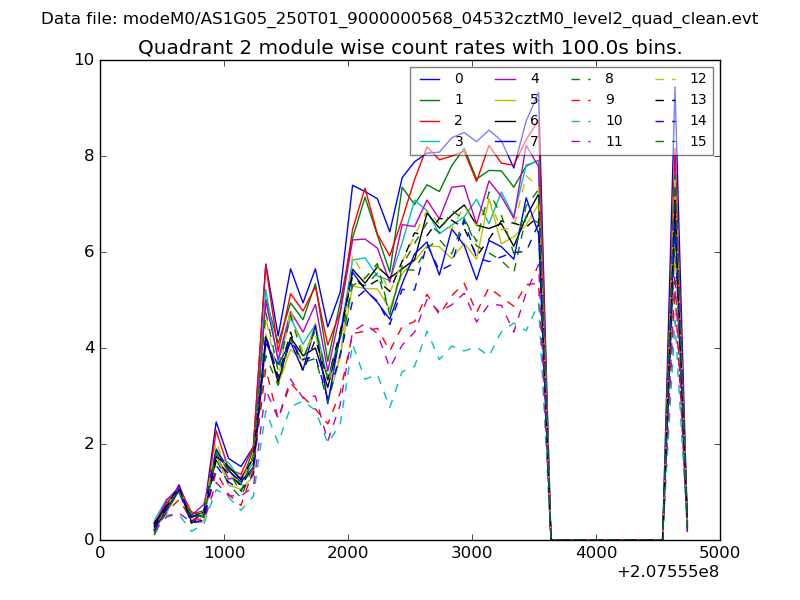 |
 |
| Module-wise count rates for Quadrant D Data is divided into 100 sec bins |
 |
 |
| Parameter | Plot |
|---|---|
| CZT HV Monitor | 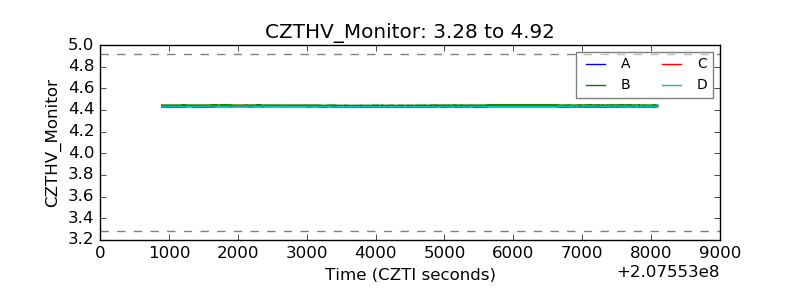 |
| D_VDD | 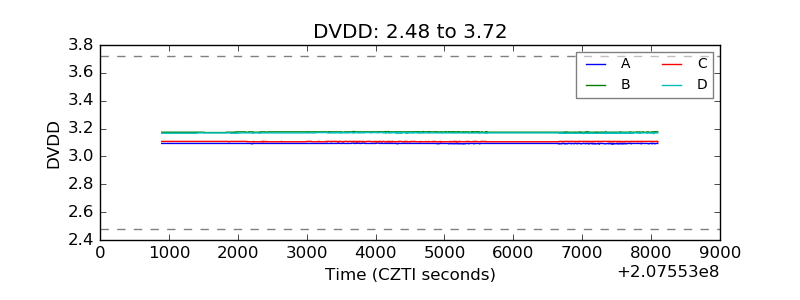 |
| Temperature 1 | 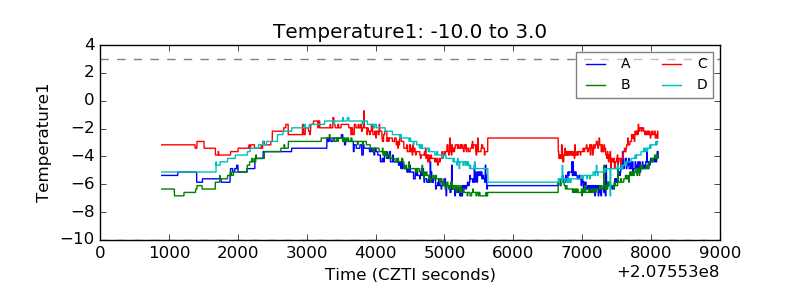 |
| Veto HV Monitor | 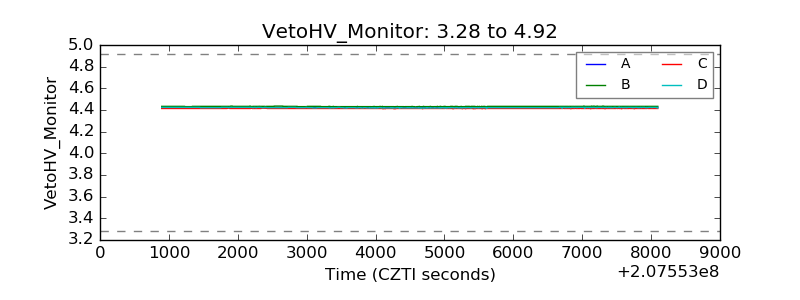 |
| Veto LLD | 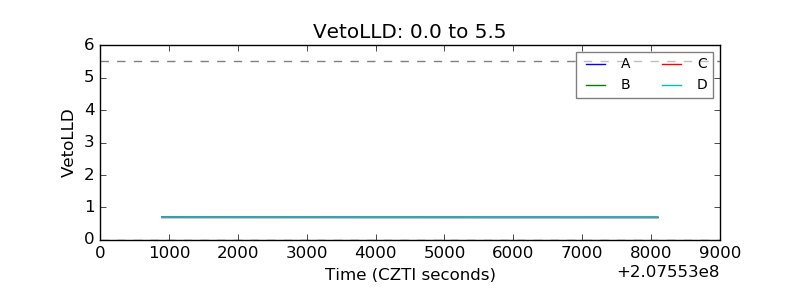 |
| Alpha Counter | 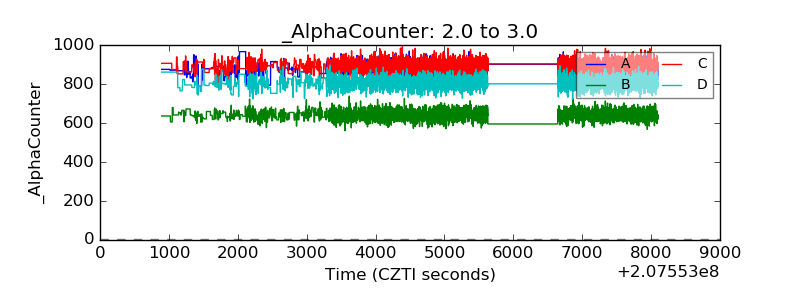 |
| _CPM_Rate | 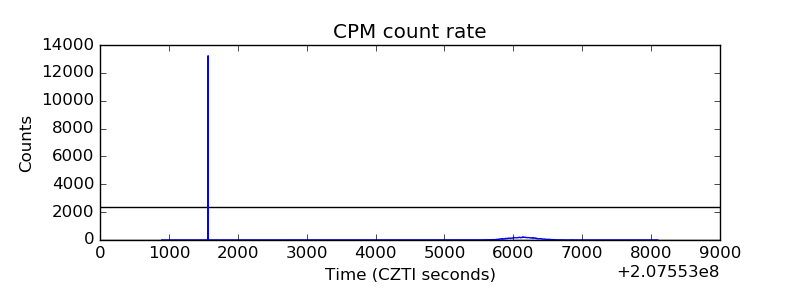 |
| CZT Counter | 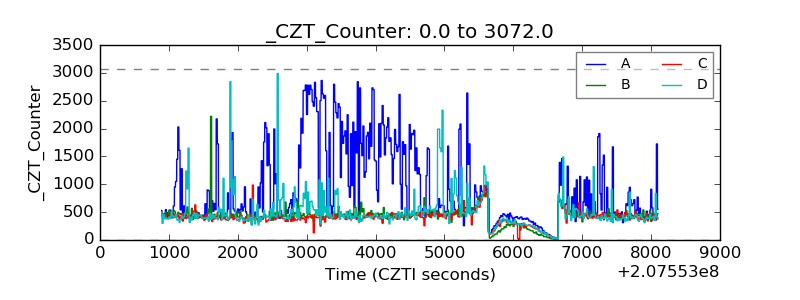 |
| +2.5 Volts monitor |  |
| +5 Volts monitor | 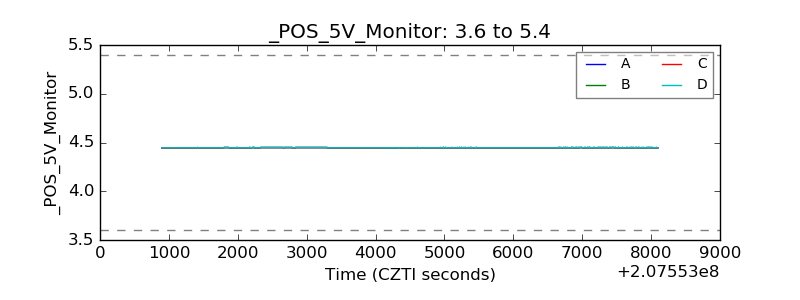 |
| _ROLL_ROT | 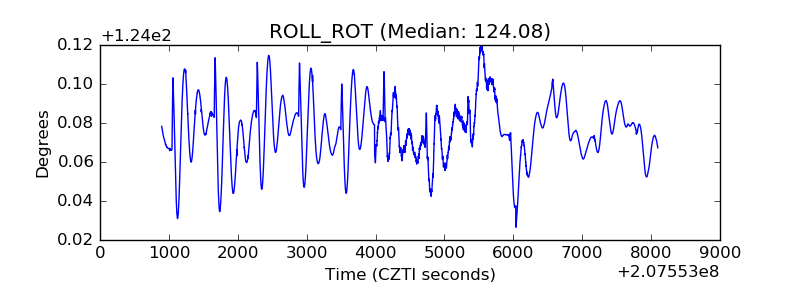 |
| _Roll_DEC | 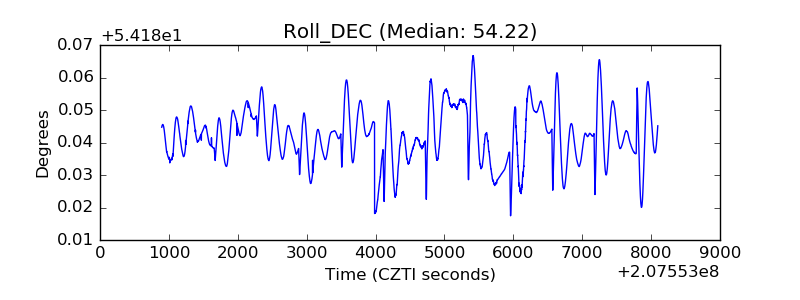 |
| _Roll_RA | 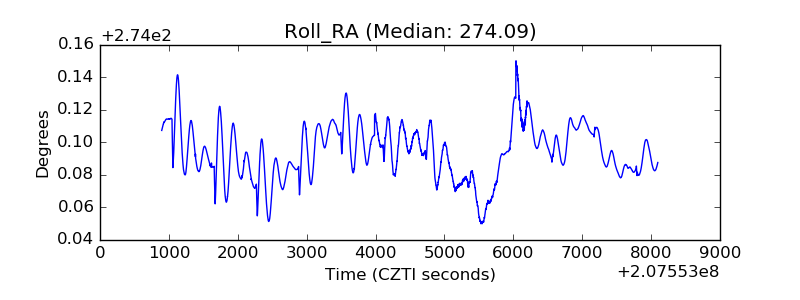 |
| Veto Counter | 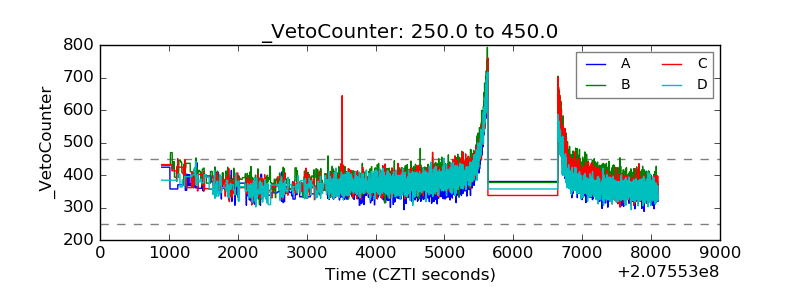 |