| Param | Original file | Final file |
|---|---|---|
| Filename | modeM0/AS1G05_250T01_9000000568_04534cztM0_level2.evt | modeM0/AS1G05_250T01_9000000568_04534cztM0_level2_quad_clean.evt |
| Size (bytes) | 567,241,920 | 85,098,240 |
| Size | 541.0 MB | 81.2 MB |
| Events in quadrant A | 5,596,627 | 501,940 |
| Events in quadrant B | 3,630,207 | 520,053 |
| Events in quadrant C | 3,505,475 | 510,124 |
| Events in quadrant D | 3,915,408 | 500,838 |
| Mode M0 | |||
|---|---|---|---|
| Quadrant | BADHDUFLAG | Total packets | Discarded packets |
| A | 0 | 21945 | 2 |
| B | 0 | 16233 | 1 |
| C | 0 | 16203 | 1 |
| D | 0 | 17300 | 1 |
| Mode SS | |||
|---|---|---|---|
| Quadrant | BADHDUFLAG | Total packets | Discarded packets |
| A | 0 | 158 | 0 |
| B | 0 | 158 | 0 |
| C | 0 | 158 | 0 |
| D | 0 | 158 | 0 |
| Mode M9 | |||
|---|---|---|---|
| Quadrant | BADHDUFLAG | Total packets | Discarded packets |
| A | 0 | 1 | 0 |
| B | 0 | 1 | 0 |
| C | 0 | 1 | 0 |
| D | 0 | 1 | 0 |
| Quadrant | Total seconds | Saturated seconds | Saturation percentage |
|---|---|---|---|
| A | 7821 | 815 | 10.420662% |
| B | 7821 | 289 | 3.695180% |
| C | 7821 | 239 | 3.055875% |
| D | 7821 | 281 | 3.592891% |
Noise dominated data is calculated using 1-second bins in cleaned event files. If a bin has >2000 counts, and if more than 50% of those come from <1% of pixels, then it is considered to be noise-dominated and hence unusable.
| Quadrant | # 1 sec bins | Bins with >0 counts | Bins with >2000 counts | High rate bins dominated by noise | Noise dominated (total time) | Noise dominated (detector-on time) | Marked lightcurve |
|---|---|---|---|---|---|---|---|
| A | 7861 | 7822 | 364 | 364 | 4.63% | 4.65% | 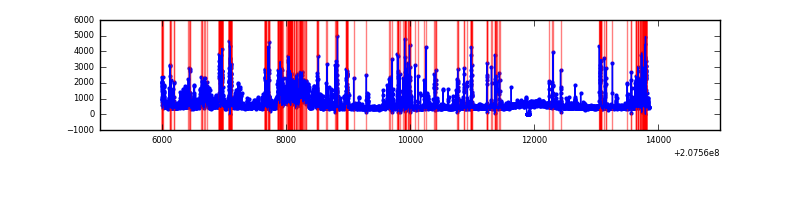 |
| B | 7861 | 7822 | 4 | 4 | 0.05% | 0.05% | 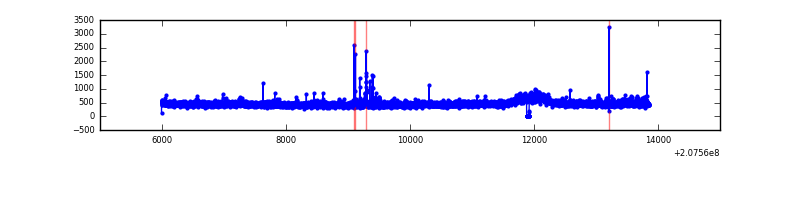 |
| C | 7861 | 7822 | 2 | 2 | 0.03% | 0.03% | 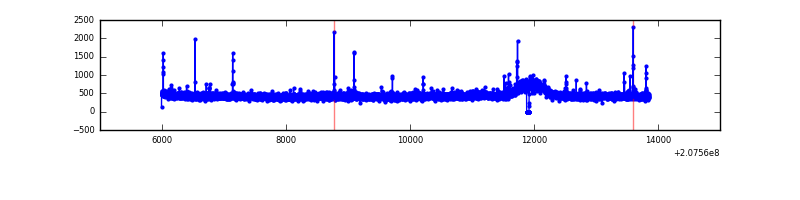 |
| D | 7861 | 7822 | 47 | 47 | 0.60% | 0.60% | 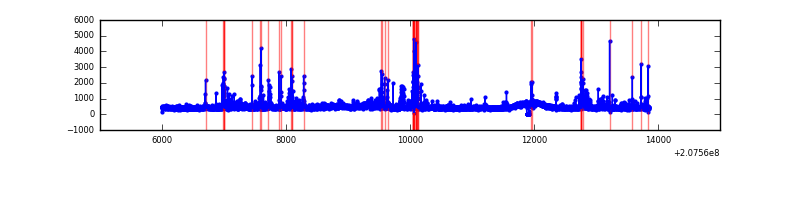 |
Top three noisy pixels from each quadrant. If the there are fewer than three noisy pixels in the level2.evt file, extra rows are filled as -1
| Pixel properties | Quadrant properties | ||||||
|---|---|---|---|---|---|---|---|
| Quadrant | DetID | PixID | Counts | Sigma | Mean | Median | Sigma |
| A | 0 | 13 | 1662998 | 9288.9 | 868 | 845 | 178.9 |
| A | 13 | 251 | 501241 | 2796.45 | 868 | 845 | 178.9 |
| A | 8 | 15 | 48754 | 267.74 | 868 | 845 | 178.9 |
| B | 4 | 80 | 48246 | 270.72 | 904 | 878 | 175.0 |
| B | 15 | 204 | 35736 | 199.22 | 904 | 878 | 175.0 |
| B | 4 | 48 | 22247 | 122.13 | 904 | 878 | 175.0 |
| C | 1 | 3 | 39470 | 190.71 | 869 | 869 | 202.4 |
| C | 8 | 128 | 20407 | 96.53 | 869 | 869 | 202.4 |
| C | 9 | 54 | 19065 | 89.9 | 869 | 869 | 202.4 |
| D | 13 | 235 | 210515 | 923.23 | 857 | 833 | 227.1 |
| D | 1 | 20 | 173010 | 758.1 | 857 | 833 | 227.1 |
| D | 2 | 14 | 69295 | 301.44 | 857 | 833 | 227.1 |
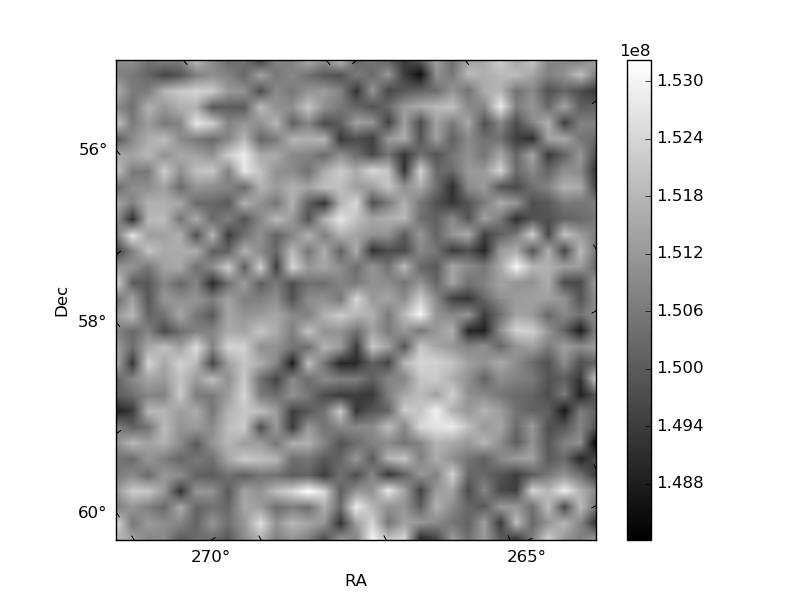
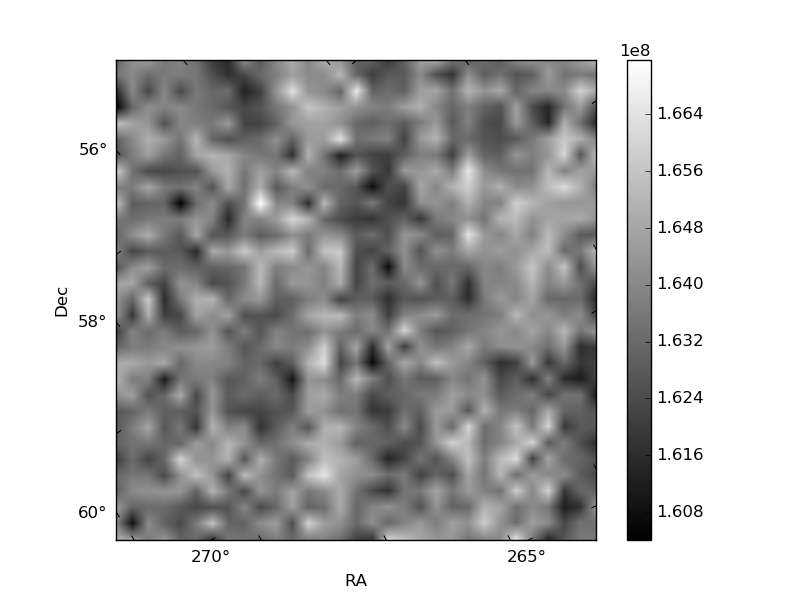
Histogram calculated using DETX and DETY for each event in the final _common_clean file
| Quadrant A | 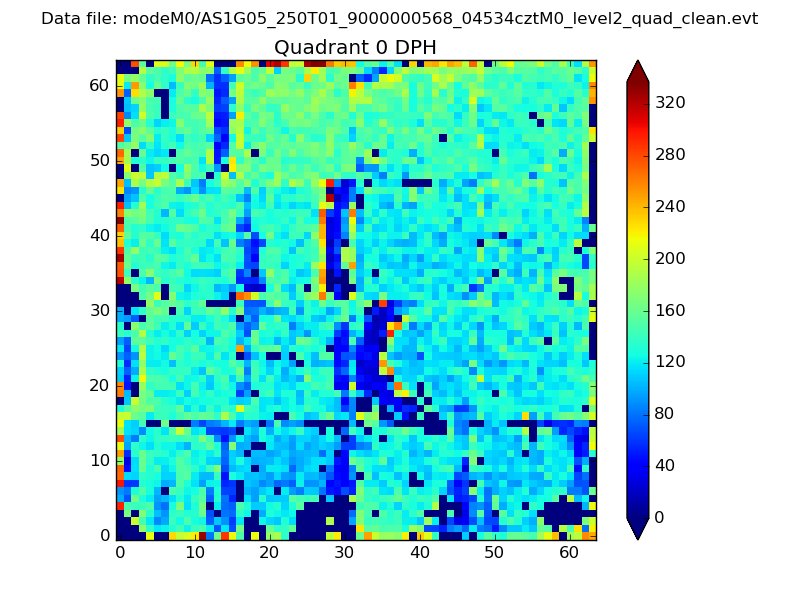 |
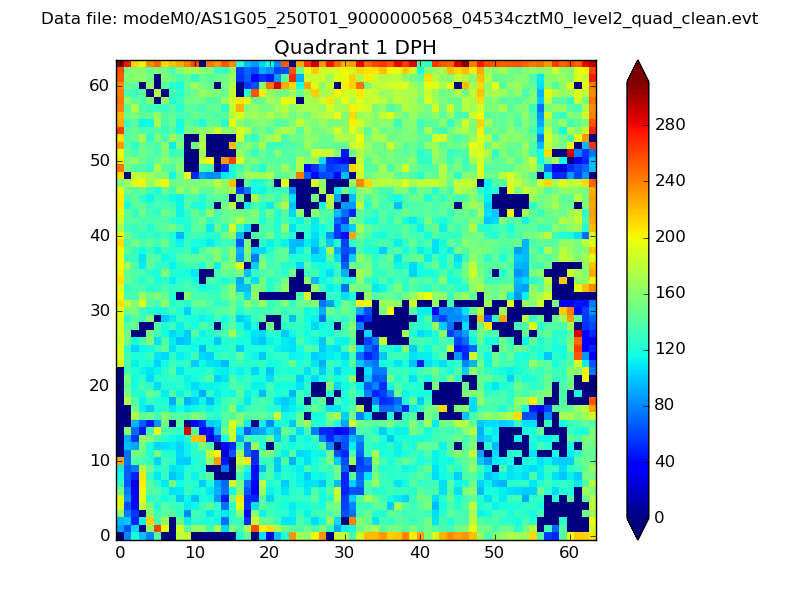 |
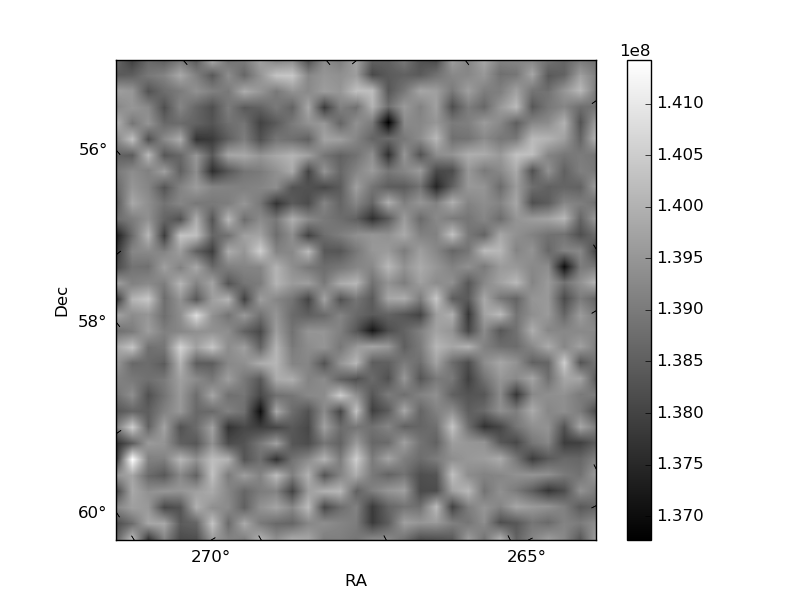
Quadrant B |
|---|---|---|---|
| Quadrant D | 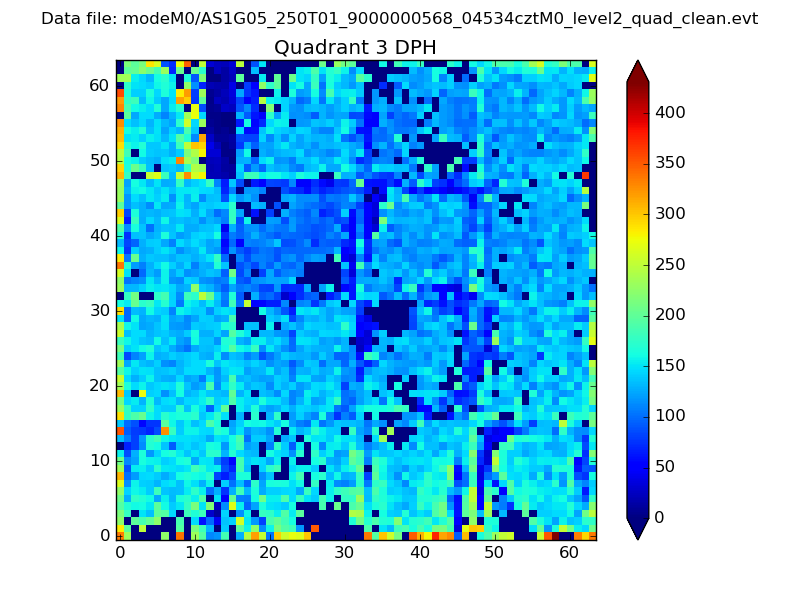 |
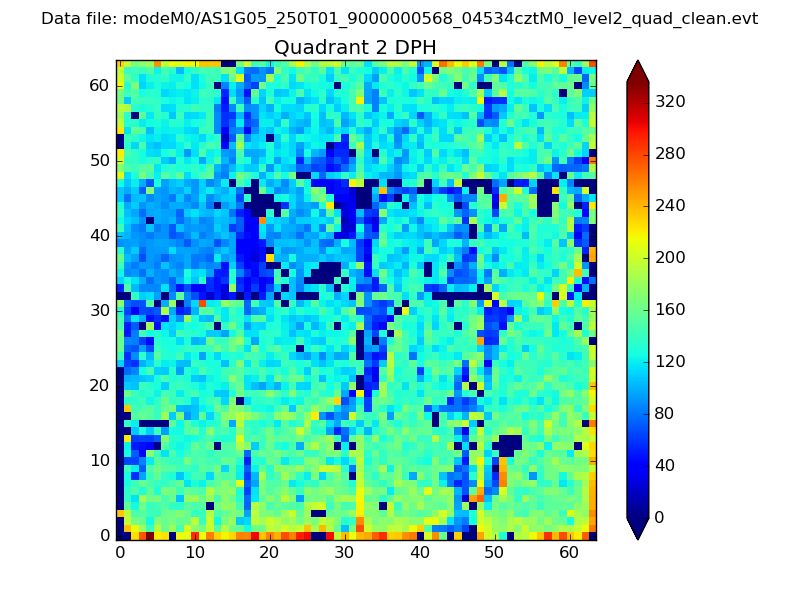 |
Quadrant C |
| Plot type | Count rate plots | Images |
|---|---|---|
| Comparison with Poisson distribution Blue bars denote a histogram of data divided into 1 sec bins. Red curve is a Poisson curve with rate = median count rate of data. |
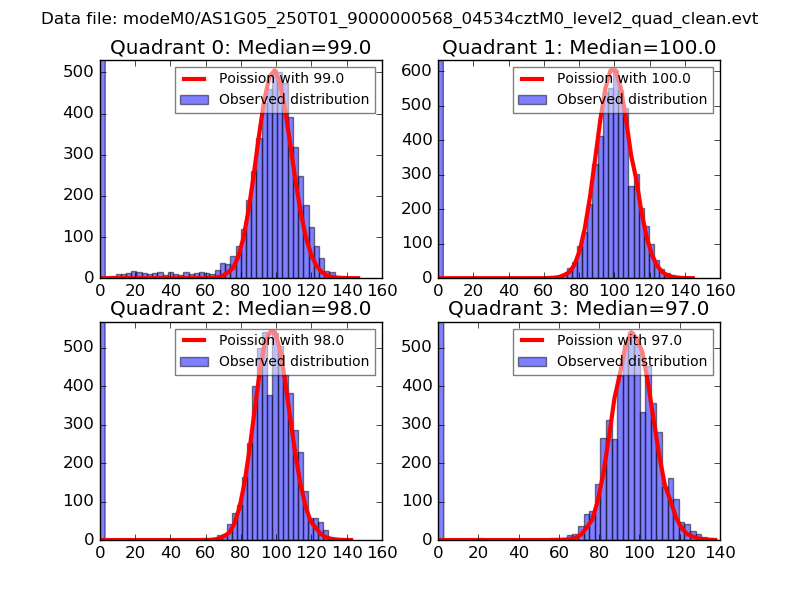 |
 |
| Quadrant-wise count rates Data is divided into 100 sec bins |
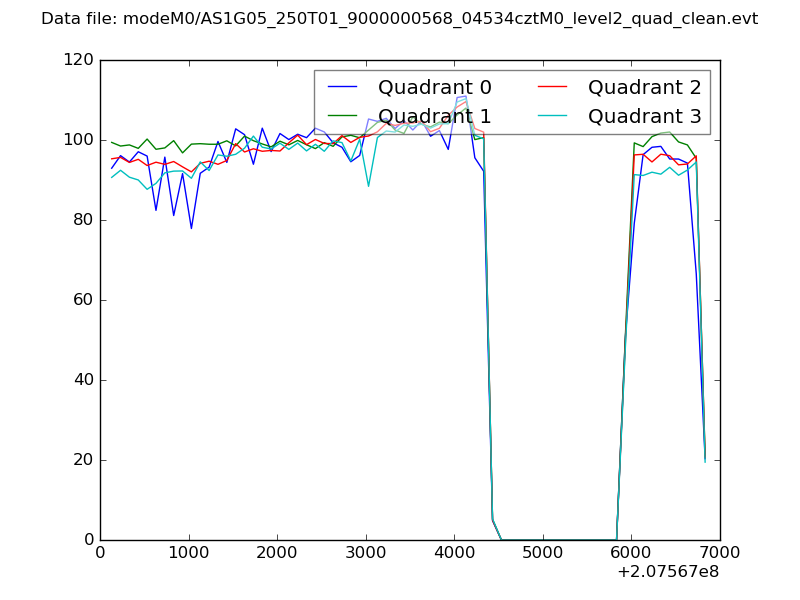 |
|
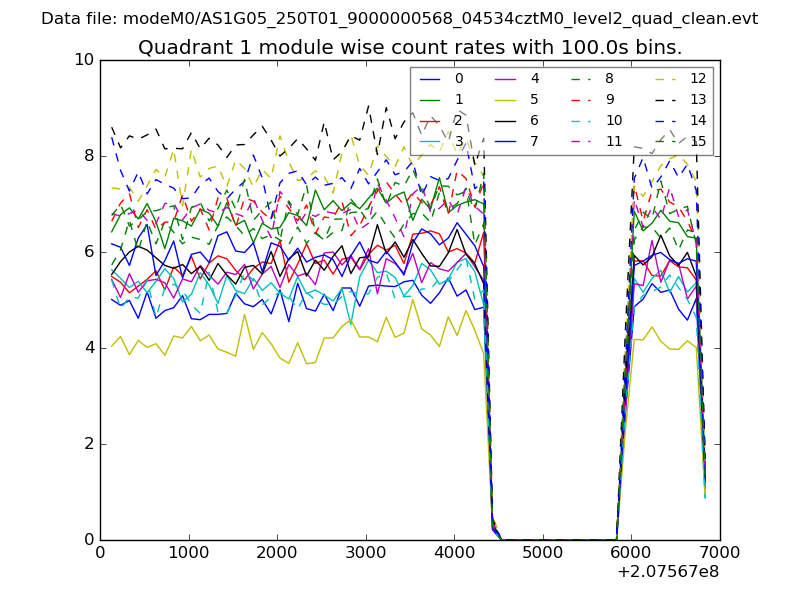
| Module-wise count rates for Quadrant A Data is divided into 100 sec bins |
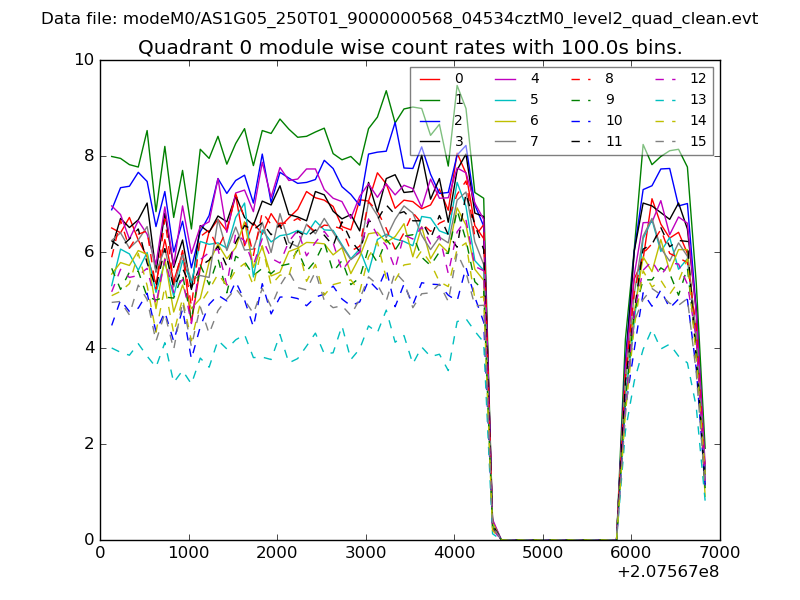 |
 |
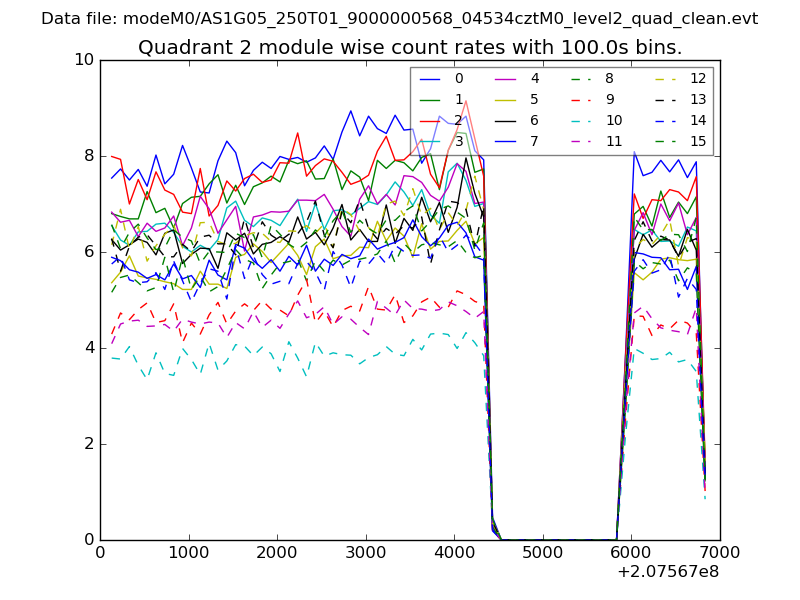
| Module-wise count rates for Quadrant B Data is divided into 100 sec bins |
 |
 |
| Module-wise count rates for Quadrant C Data is divided into 100 sec bins |
 |
 |
| Module-wise count rates for Quadrant D Data is divided into 100 sec bins |
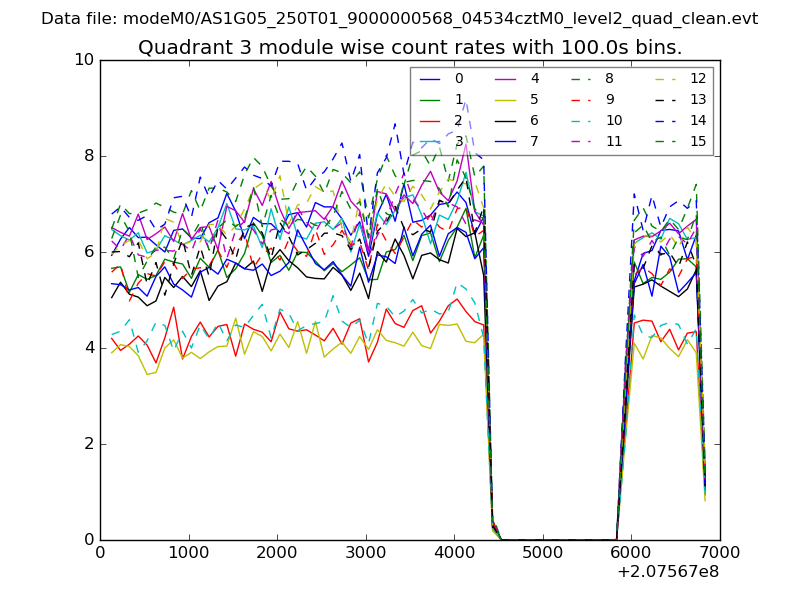 |
 |
| Parameter | Plot |
|---|---|
| CZT HV Monitor | 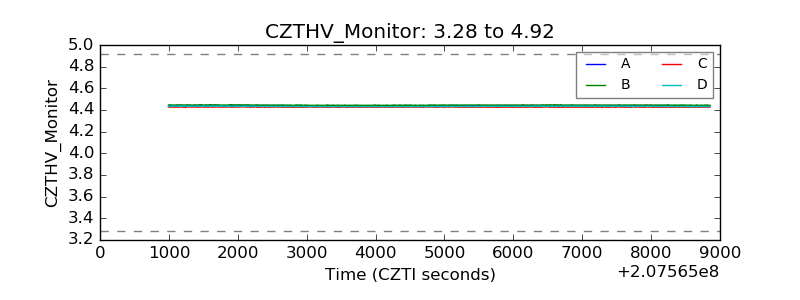 |
| D_VDD |  |
| Temperature 1 | 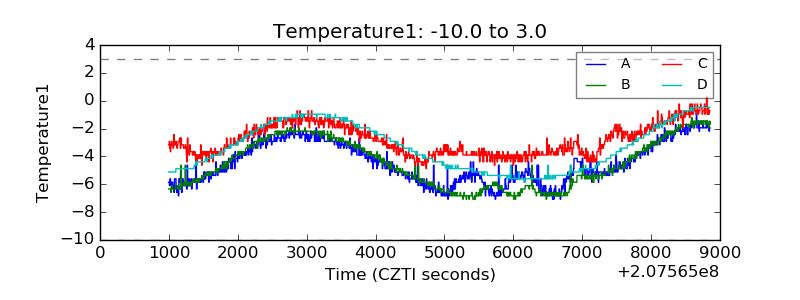 |
| Veto HV Monitor | 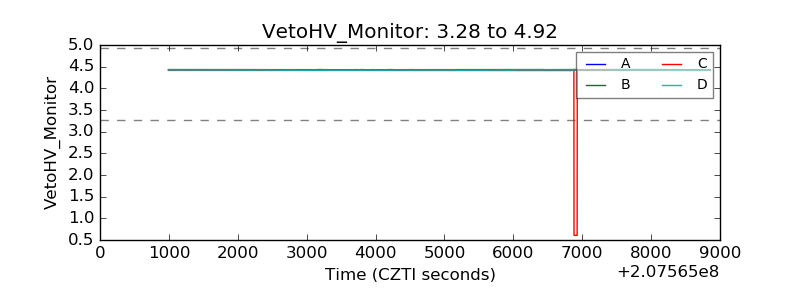 |
| Veto LLD | 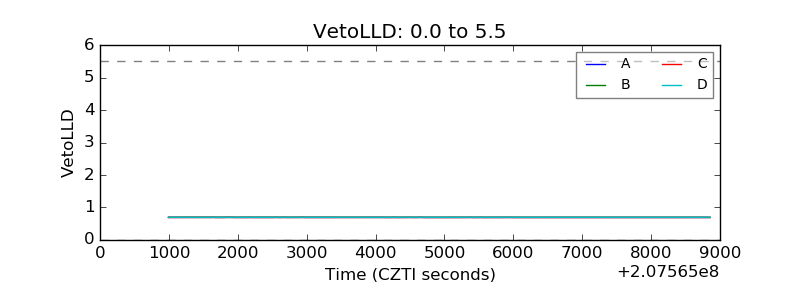 |
| Alpha Counter | 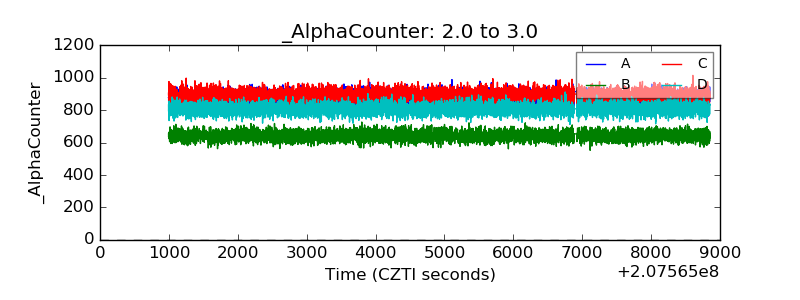 |
| _CPM_Rate | 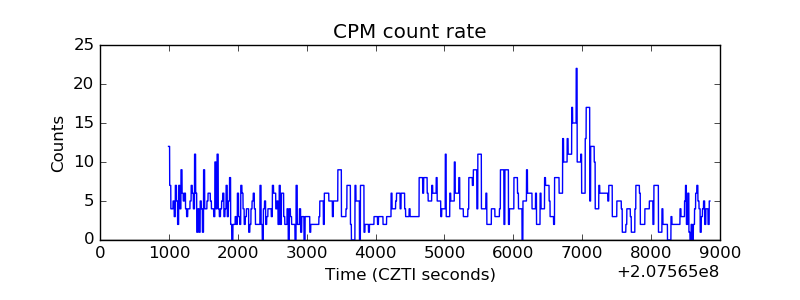 |
| CZT Counter | 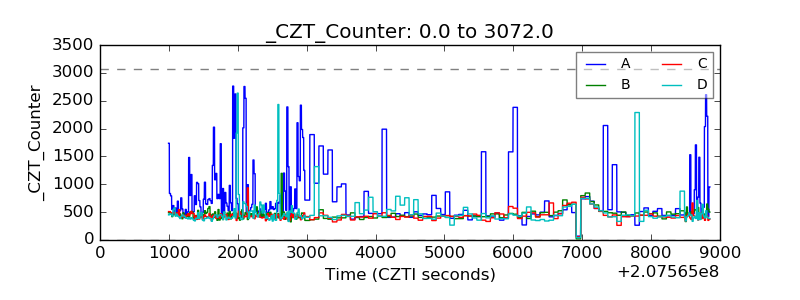 |
| +2.5 Volts monitor |  |
| +5 Volts monitor |  |
| _ROLL_ROT | 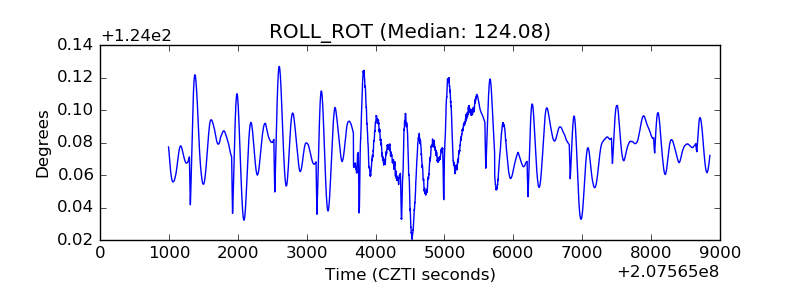 |
| _Roll_DEC | 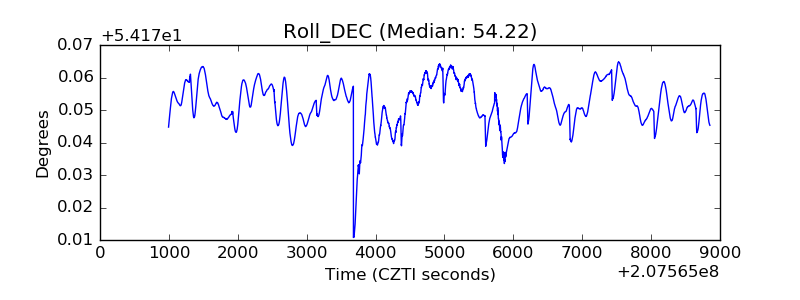 |
| _Roll_RA |  |
| Veto Counter | 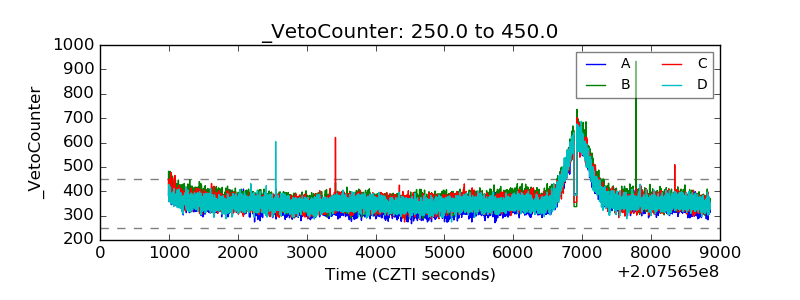 |