| Param | Original file | Final file |
|---|---|---|
| Filename | modeM0/AS1G05_250T01_9000000568_04535cztM0_level2.evt | modeM0/AS1G05_250T01_9000000568_04535cztM0_level2_quad_clean.evt |
| Size (bytes) | 1,865,816,640 | 274,466,880 |
| Size | 1.7 GB | 261.8 MB |
| Events in quadrant A | 20,066,902 | 1,568,558 |
| Events in quadrant B | 11,132,512 | 1,742,324 |
| Events in quadrant C | 10,576,405 | 1,709,525 |
| Events in quadrant D | 13,131,588 | 1,662,215 |
| Mode M0 | |||
|---|---|---|---|
| Quadrant | BADHDUFLAG | Total packets | Discarded packets |
| A | 0 | 75628 | 7 |
| B | 0 | 49478 | 6 |
| C | 0 | 49000 | 8 |
| D | 0 | 56225 | 6 |
| Mode SS | |||
|---|---|---|---|
| Quadrant | BADHDUFLAG | Total packets | Discarded packets |
| A | 0 | 480 | 0 |
| B | 0 | 480 | 0 |
| C | 0 | 480 | 0 |
| D | 0 | 480 | 0 |
| Mode M9 | |||
|---|---|---|---|
| Quadrant | BADHDUFLAG | Total packets | Discarded packets |
| A | 0 | 17 | 0 |
| B | 0 | 17 | 0 |
| C | 0 | 17 | 0 |
| D | 0 | 17 | 0 |
| Quadrant | Total seconds | Saturated seconds | Saturation percentage |
|---|---|---|---|
| A | 23666 | 3912 | 16.530043% |
| B | 23666 | 703 | 2.970506% |
| C | 23665 | 573 | 2.421297% |
| D | 23666 | 778 | 3.287417% |
Noise dominated data is calculated using 1-second bins in cleaned event files. If a bin has >2000 counts, and if more than 50% of those come from <1% of pixels, then it is considered to be noise-dominated and hence unusable.
| Quadrant | # 1 sec bins | Bins with >0 counts | Bins with >2000 counts | High rate bins dominated by noise | Noise dominated (total time) | Noise dominated (detector-on time) | Marked lightcurve |
|---|---|---|---|---|---|---|---|
| A | 25396 | 23671 | 2055 | 2055 | 8.09% | 8.68% | 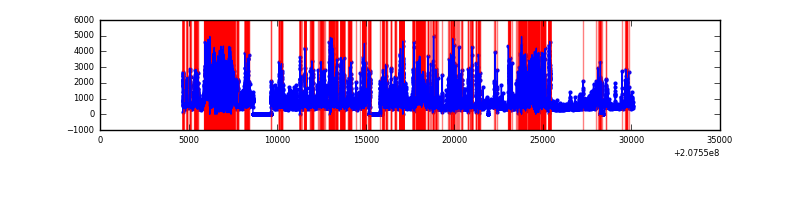 |
| B | 25396 | 23674 | 10 | 10 | 0.04% | 0.04% | 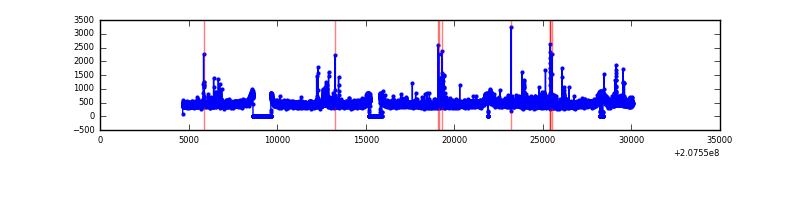 |
| C | 25396 | 23674 | 9 | 9 | 0.04% | 0.04% | 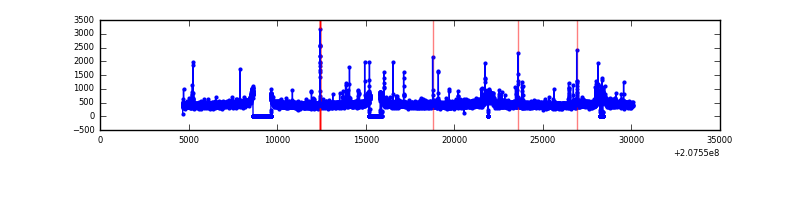 |
| D | 25396 | 23674 | 227 | 227 | 0.89% | 0.96% | 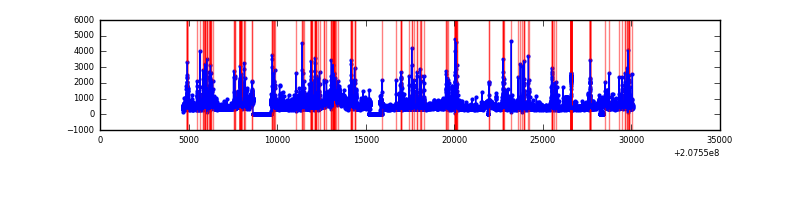 |
Top three noisy pixels from each quadrant. If the there are fewer than three noisy pixels in the level2.evt file, extra rows are filled as -1
| Pixel properties | Quadrant properties | ||||||
|---|---|---|---|---|---|---|---|
| Quadrant | DetID | PixID | Counts | Sigma | Mean | Median | Sigma |
| A | 0 | 13 | 6885767 | 13418.21 | 2520 | 2456 | 513.0 |
| A | 13 | 251 | 3146179 | 6128.32 | 2520 | 2456 | 513.0 |
| A | 8 | 15 | 198209 | 381.6 | 2520 | 2456 | 513.0 |
| B | 15 | 204 | 130854 | 246.83 | 2742 | 2673 | 519.3 |
| B | 4 | 80 | 127703 | 240.76 | 2742 | 2673 | 519.3 |
| B | 7 | 252 | 87108 | 162.59 | 2742 | 2673 | 519.3 |
| C | 1 | 3 | 123677 | 198.83 | 2646 | 2650 | 608.7 |
| C | 8 | 128 | 28222 | 42.01 | 2646 | 2650 | 608.7 |
| C | 9 | 54 | 25345 | 37.28 | 2646 | 2650 | 608.7 |
| D | 1 | 20 | 1146950 | 1636.81 | 2605 | 2544 | 699.2 |
| D | 13 | 235 | 828267 | 1181.01 | 2605 | 2544 | 699.2 |
| D | 7 | 67 | 357052 | 507.04 | 2605 | 2544 | 699.2 |
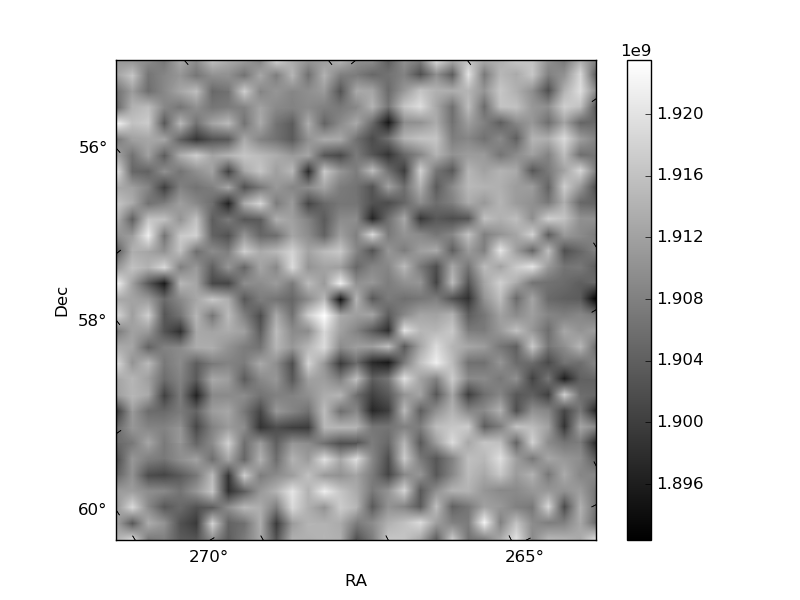
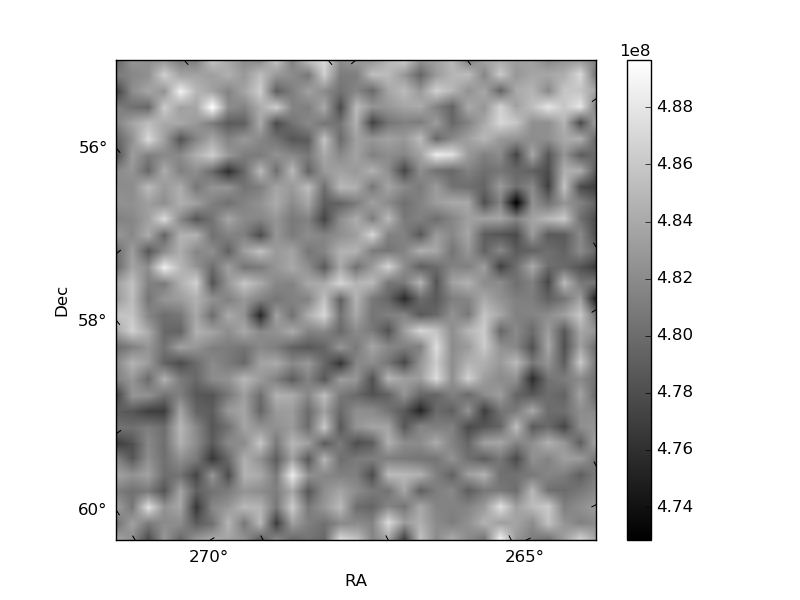
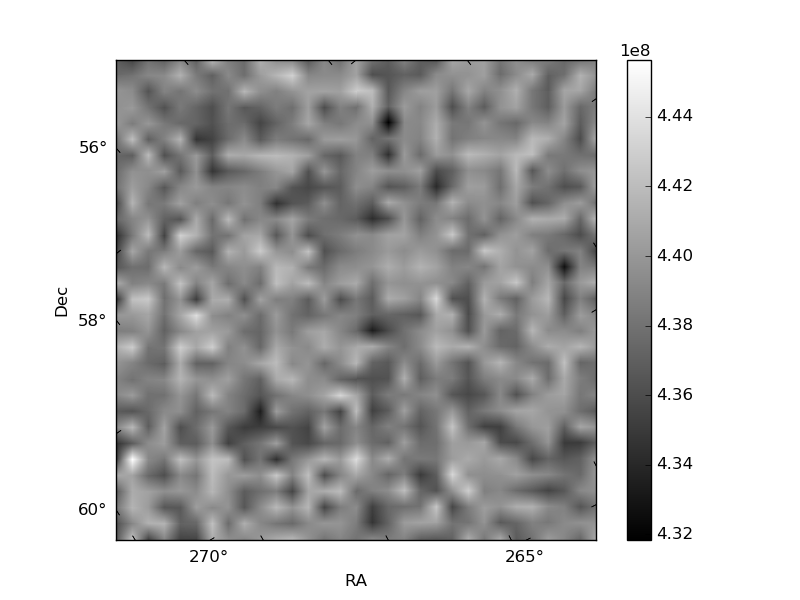
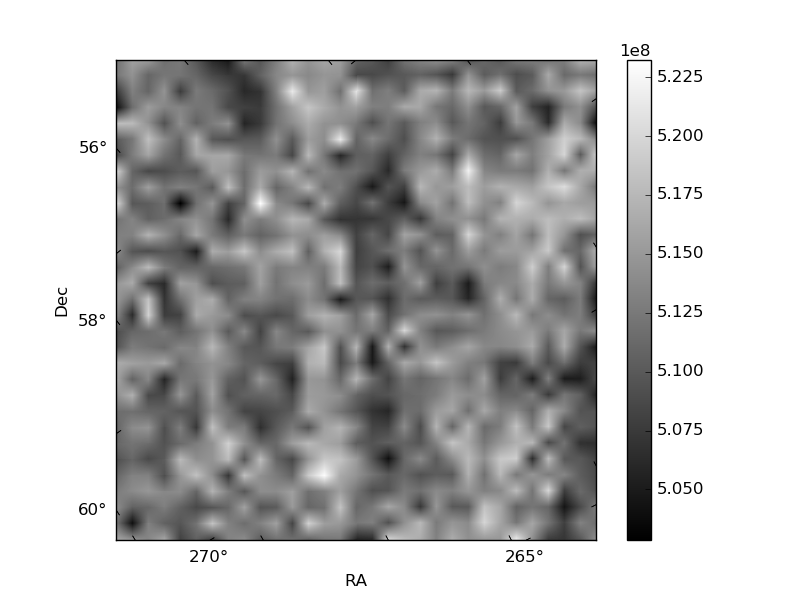
Histogram calculated using DETX and DETY for each event in the final _common_clean file
| Quadrant A | 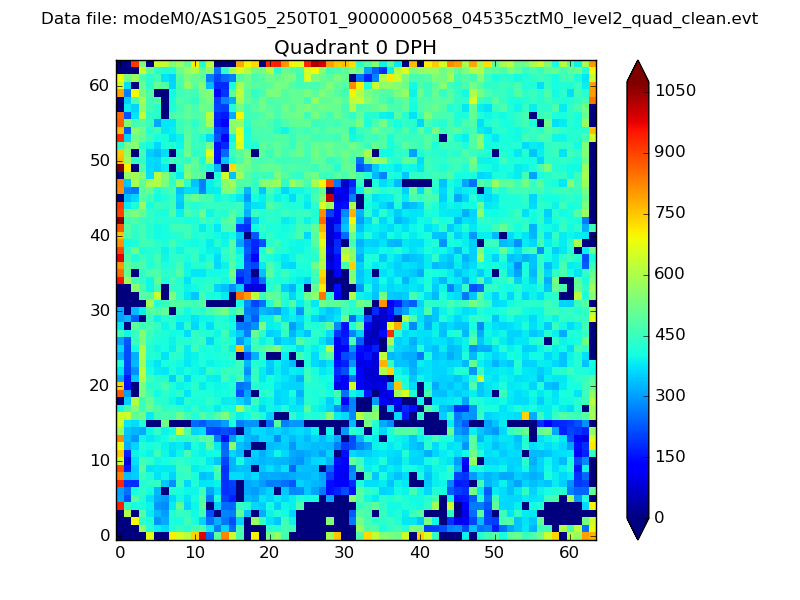 |
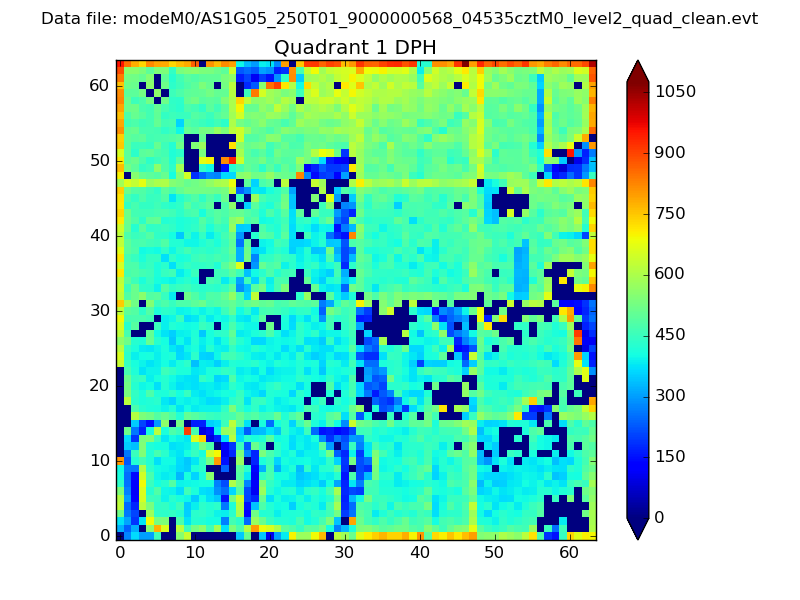 |
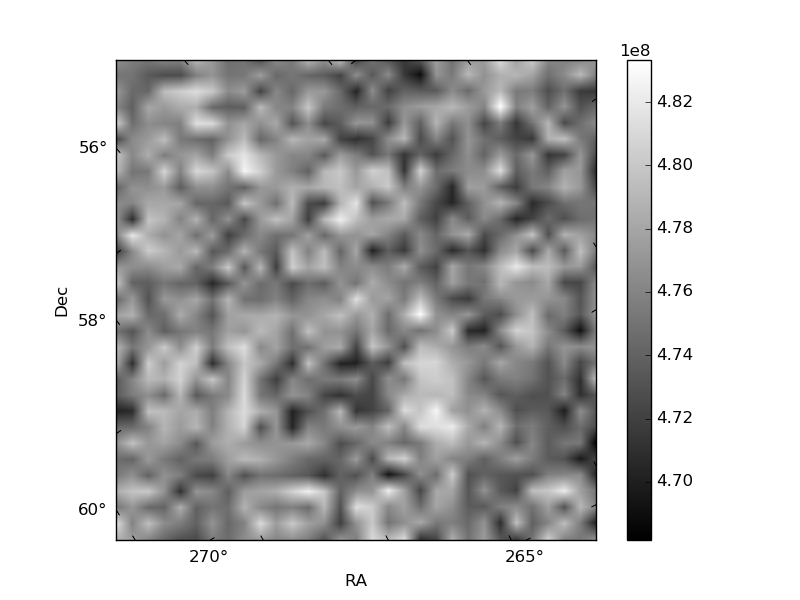
Quadrant B |
|---|---|---|---|
| Quadrant D | 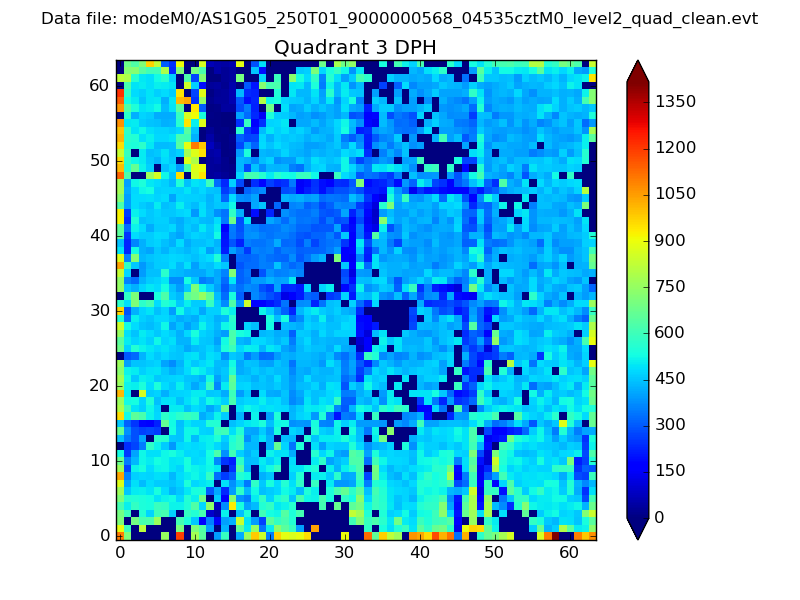 |
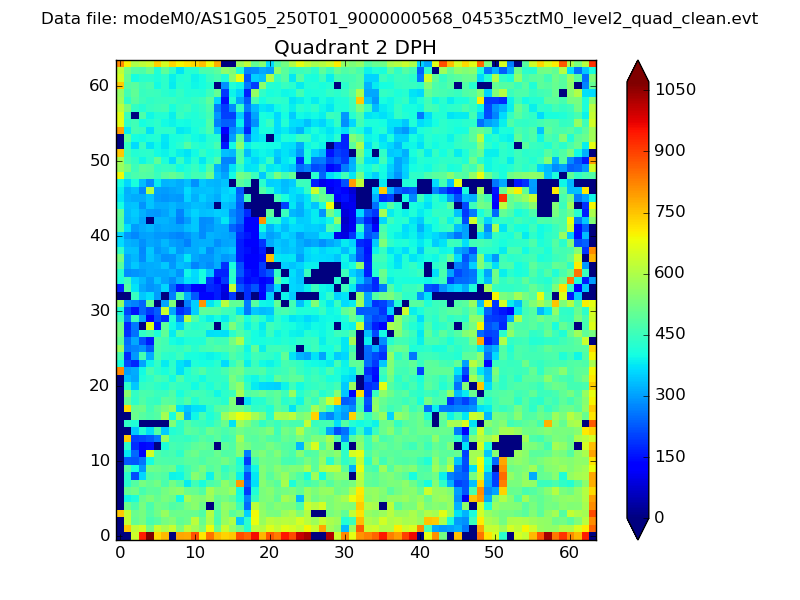 |
Quadrant C |
| Plot type | Count rate plots | Images |
|---|---|---|
| Comparison with Poisson distribution Blue bars denote a histogram of data divided into 1 sec bins. Red curve is a Poisson curve with rate = median count rate of data. |
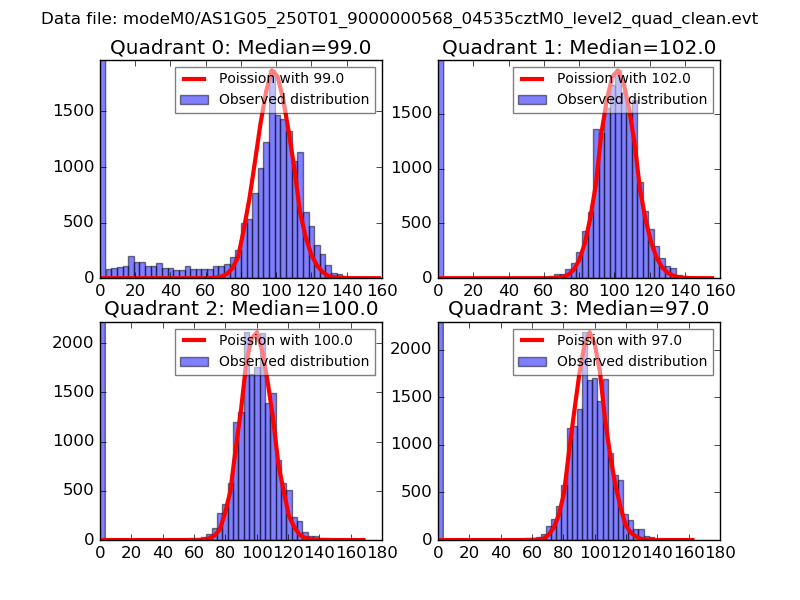 |
 |
| Quadrant-wise count rates Data is divided into 100 sec bins |
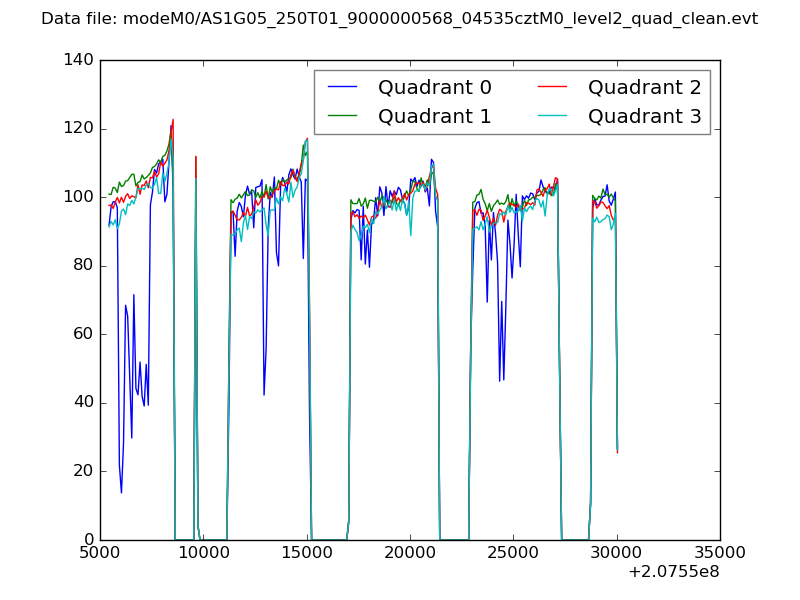 |
|
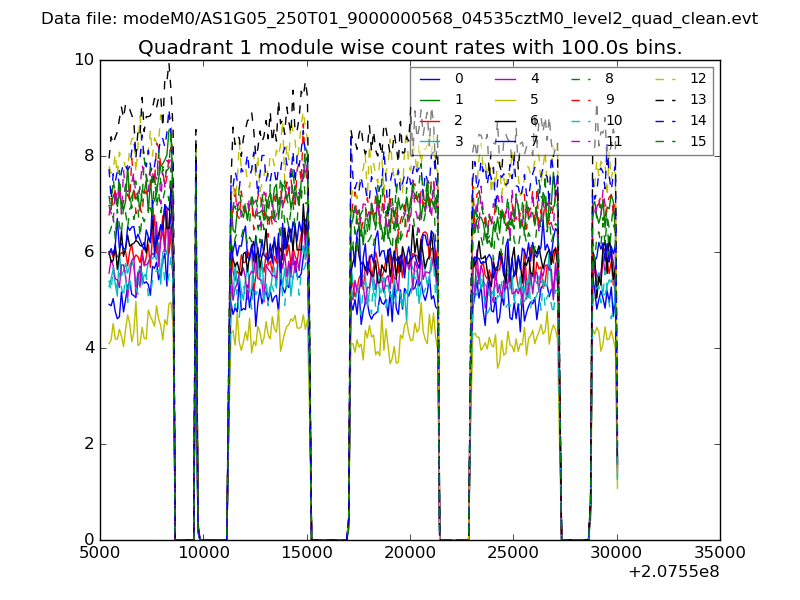
| Module-wise count rates for Quadrant A Data is divided into 100 sec bins |
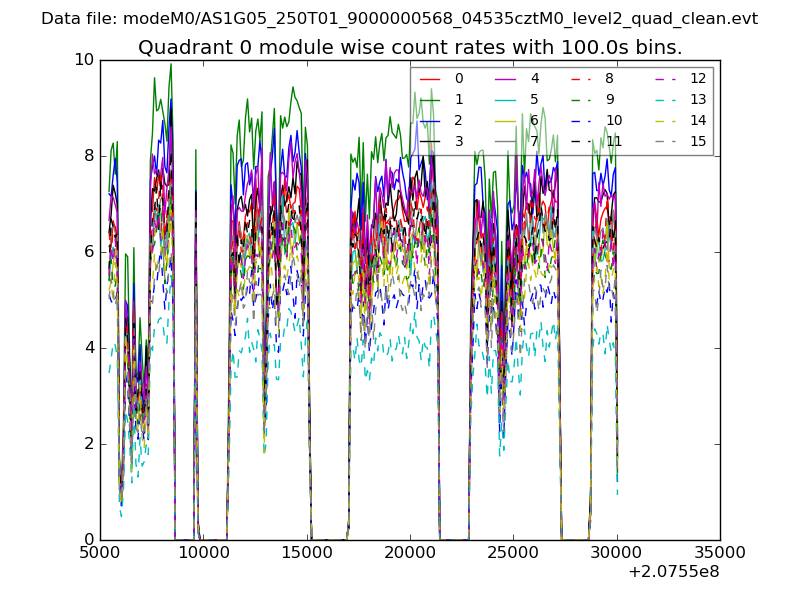 |
 |
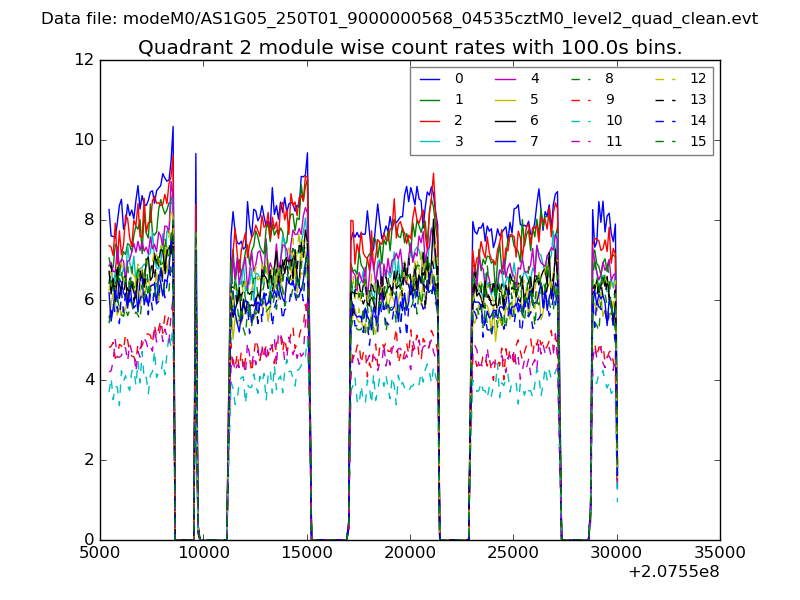
| Module-wise count rates for Quadrant B Data is divided into 100 sec bins |
 |
 |
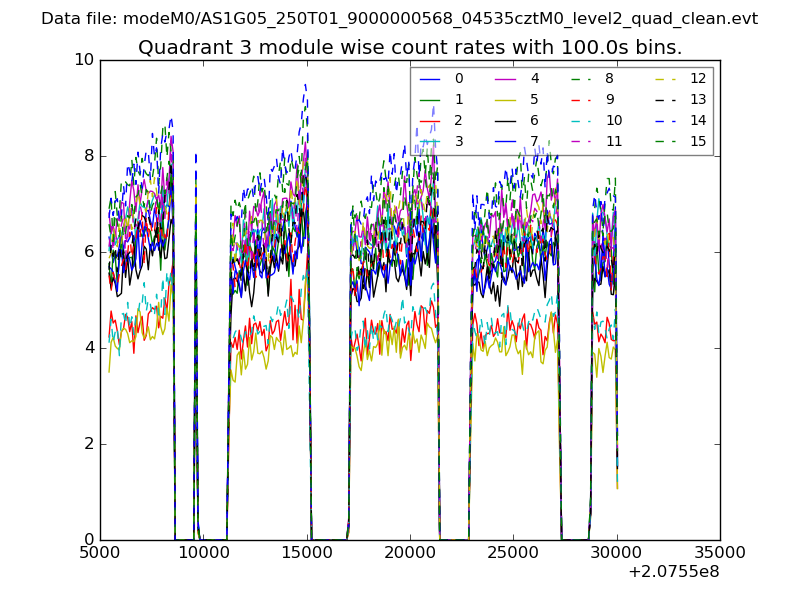
| Module-wise count rates for Quadrant C Data is divided into 100 sec bins |
 |
 |
| Module-wise count rates for Quadrant D Data is divided into 100 sec bins |
 |
 |
| Parameter | Plot |
|---|---|
| CZT HV Monitor | 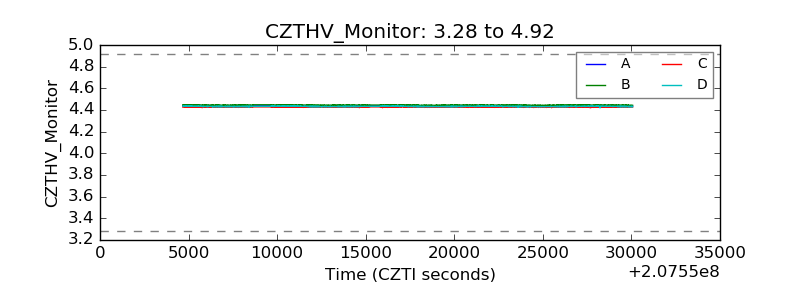 |
| D_VDD | 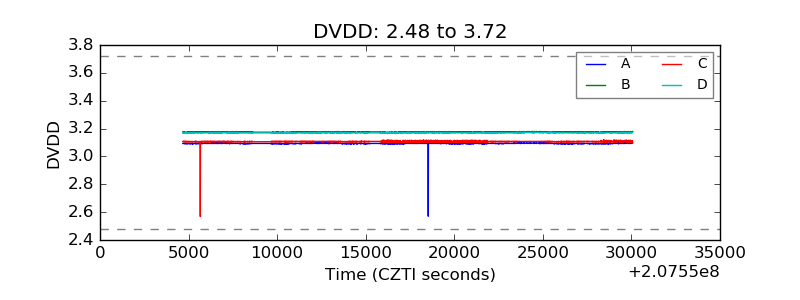 |
| Temperature 1 | 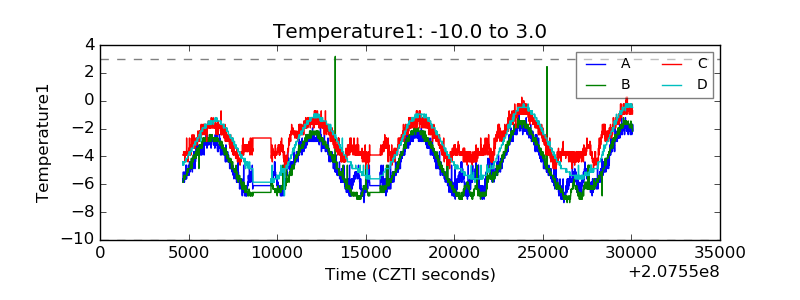 |
| Veto HV Monitor | 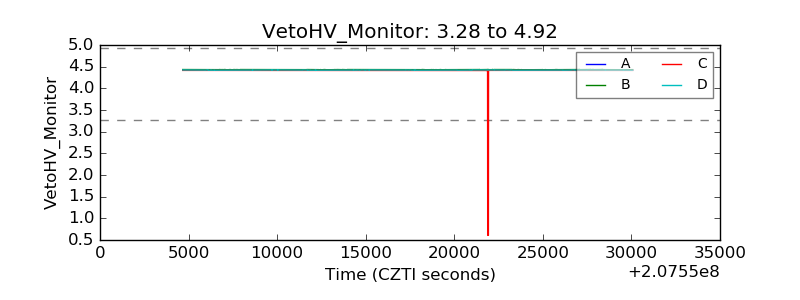 |
| Veto LLD | 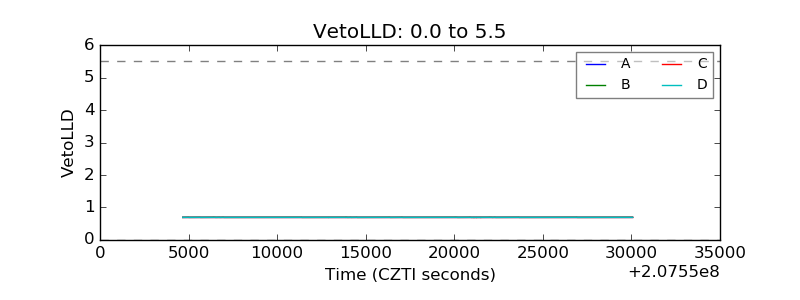 |
| Alpha Counter | 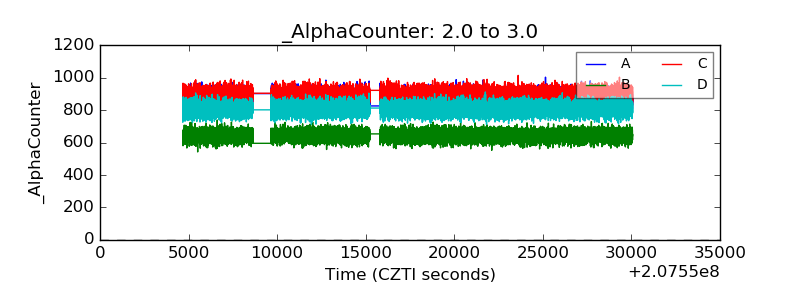 |
| _CPM_Rate | 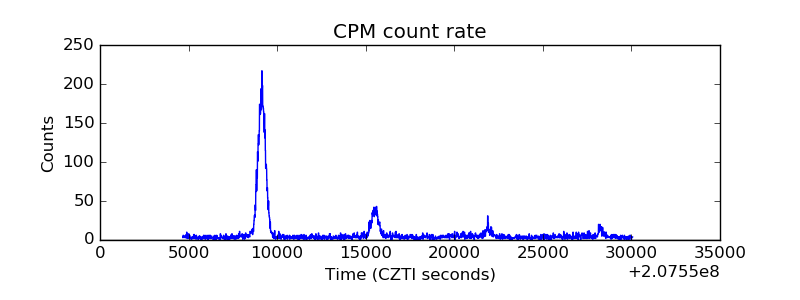 |
| CZT Counter |  |
| +2.5 Volts monitor |  |
| +5 Volts monitor |  |
| _ROLL_ROT | 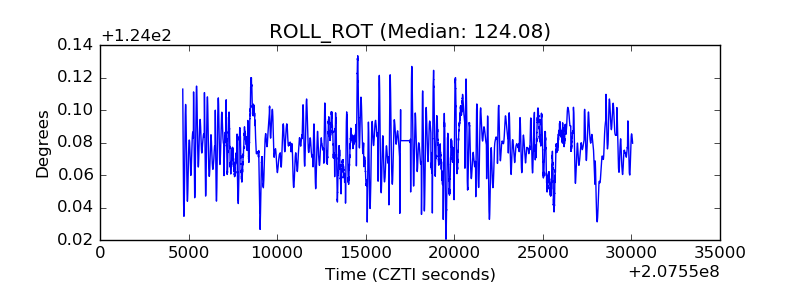 |
| _Roll_DEC | 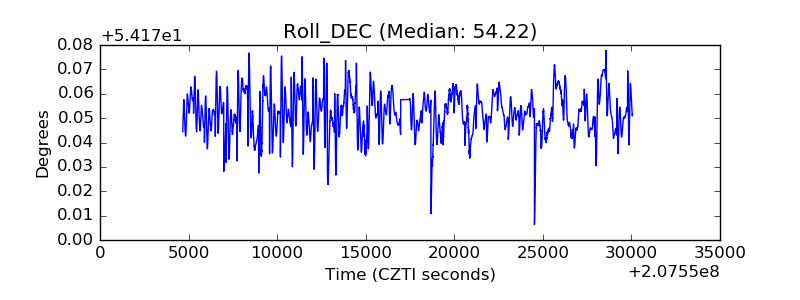 |
| _Roll_RA | 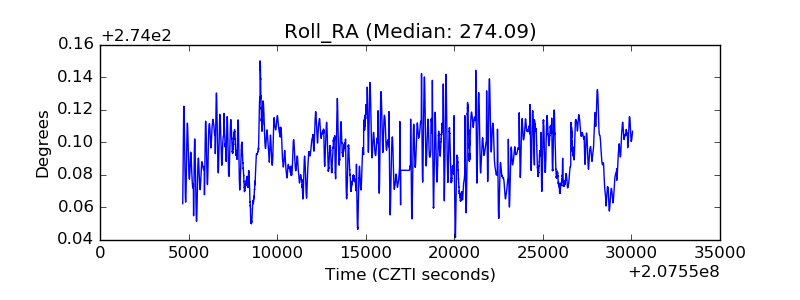 |
| Veto Counter | 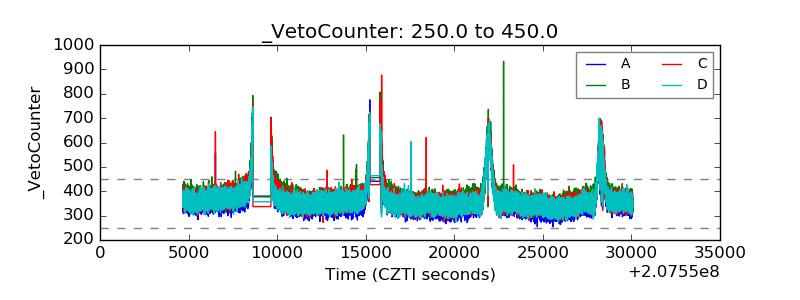 |