| Param | Original file | Final file |
|---|---|---|
| Filename | modeM0/AS1G05_250T01_9000000568_04539cztM0_level2.evt | modeM0/AS1G05_250T01_9000000568_04539cztM0_level2_quad_clean.evt |
| Size (bytes) | 1,496,064,960 | 210,816,000 |
| Size | 1.4 GB | 201.0 MB |
| Events in quadrant A | 17,535,403 | 1,214,597 |
| Events in quadrant B | 8,470,028 | 1,331,286 |
| Events in quadrant C | 8,802,320 | 1,307,185 |
| Events in quadrant D | 9,287,393 | 1,292,398 |
| Mode M0 | |||
|---|---|---|---|
| Quadrant | BADHDUFLAG | Total packets | Discarded packets |
| A | 0 | 64463 | 9 |
| B | 0 | 37843 | 3 |
| C | 0 | 39278 | 3 |
| D | 0 | 41064 | 7 |
| Mode SS | |||
|---|---|---|---|
| Quadrant | BADHDUFLAG | Total packets | Discarded packets |
| A | 0 | 368 | 0 |
| B | 0 | 368 | 0 |
| C | 0 | 368 | 0 |
| D | 0 | 368 | 0 |
| Mode M9 | |||
|---|---|---|---|
| Quadrant | BADHDUFLAG | Total packets | Discarded packets |
| A | 0 | 21 | 0 |
| B | 0 | 21 | 0 |
| C | 0 | 21 | 0 |
| D | 0 | 21 | 0 |
| Quadrant | Total seconds | Saturated seconds | Saturation percentage |
|---|---|---|---|
| A | 17955 | 3531 | 19.665831% |
| B | 17956 | 127 | 0.707284% |
| C | 17956 | 276 | 1.537091% |
| D | 17955 | 282 | 1.570593% |
Noise dominated data is calculated using 1-second bins in cleaned event files. If a bin has >2000 counts, and if more than 50% of those come from <1% of pixels, then it is considered to be noise-dominated and hence unusable.
| Quadrant | # 1 sec bins | Bins with >0 counts | Bins with >2000 counts | High rate bins dominated by noise | Noise dominated (total time) | Noise dominated (detector-on time) | Marked lightcurve |
|---|---|---|---|---|---|---|---|
| A | 20157 | 17959 | 2067 | 2067 | 10.25% | 11.51% | 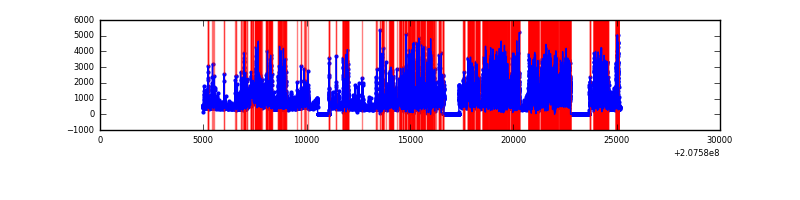 |
| B | 20157 | 17960 | 19 | 19 | 0.09% | 0.11% | 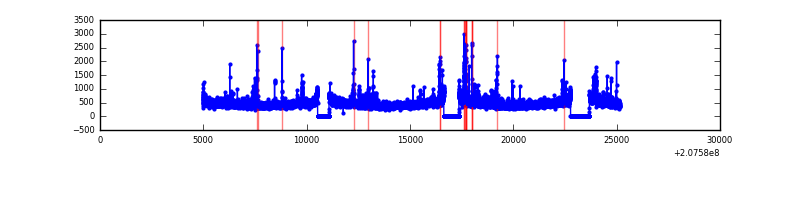 |
| C | 20157 | 17960 | 128 | 128 | 0.64% | 0.71% | 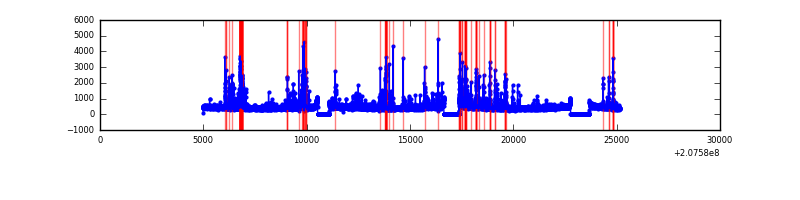 |
| D | 20156 | 17959 | 206 | 206 | 1.02% | 1.15% | 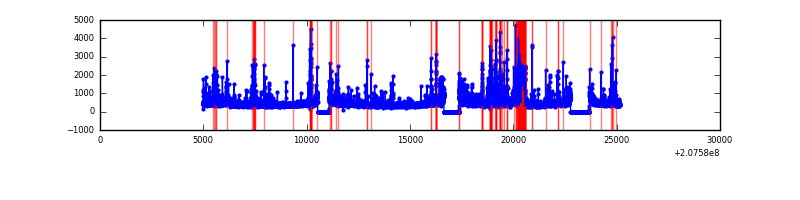 |
Top three noisy pixels from each quadrant. If the there are fewer than three noisy pixels in the level2.evt file, extra rows are filled as -1
| Pixel properties | Quadrant properties | ||||||
|---|---|---|---|---|---|---|---|
| Quadrant | DetID | PixID | Counts | Sigma | Mean | Median | Sigma |
| A | 0 | 13 | 9898105 | 26956.1 | 1823 | 1783 | 367.1 |
| A | 8 | 15 | 253268 | 685.01 | 1823 | 1783 | 367.1 |
| A | 0 | 118 | 191865 | 517.75 | 1823 | 1783 | 367.1 |
| B | 15 | 204 | 203458 | 523.06 | 2028 | 1977 | 385.2 |
| B | 4 | 48 | 111502 | 284.33 | 2028 | 1977 | 385.2 |
| B | 4 | 80 | 78230 | 197.96 | 2028 | 1977 | 385.2 |
| C | 14 | 48 | 903058 | 1998.27 | 1950 | 1955 | 450.9 |
| C | 9 | 247 | 140552 | 307.35 | 1950 | 1955 | 450.9 |
| C | 1 | 3 | 81879 | 177.24 | 1950 | 1955 | 450.9 |
| D | 1 | 20 | 836974 | 1796.24 | 1944 | 1889 | 464.9 |
| D | 2 | 136 | 325766 | 696.65 | 1944 | 1889 | 464.9 |
| D | 13 | 235 | 280968 | 600.29 | 1944 | 1889 | 464.9 |
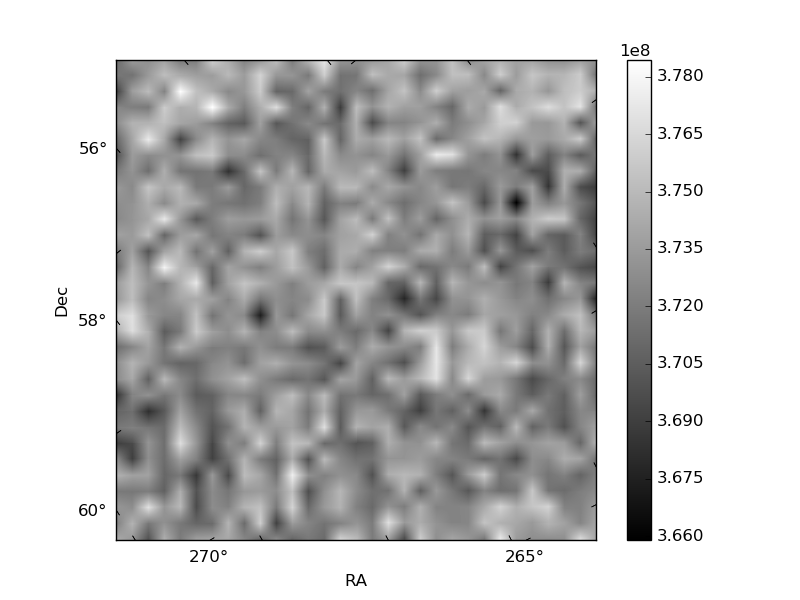
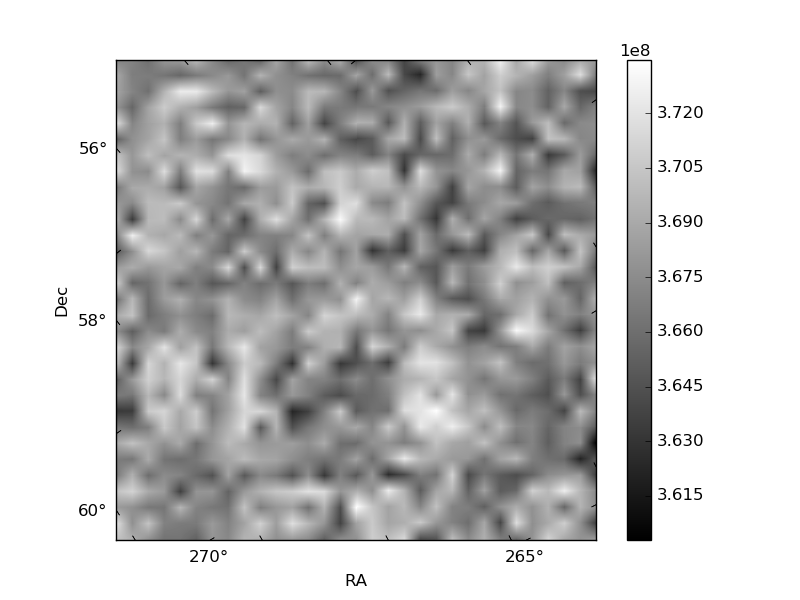
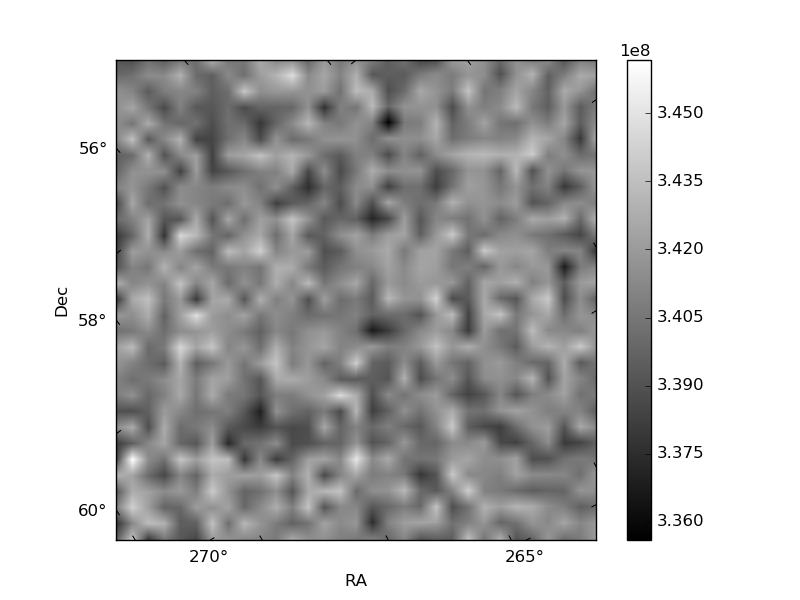
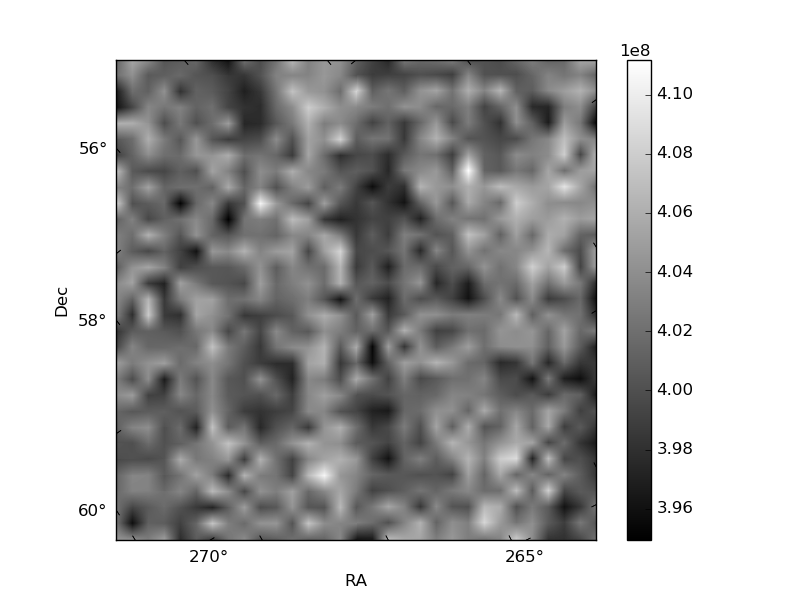
Histogram calculated using DETX and DETY for each event in the final _common_clean file
| Quadrant A | 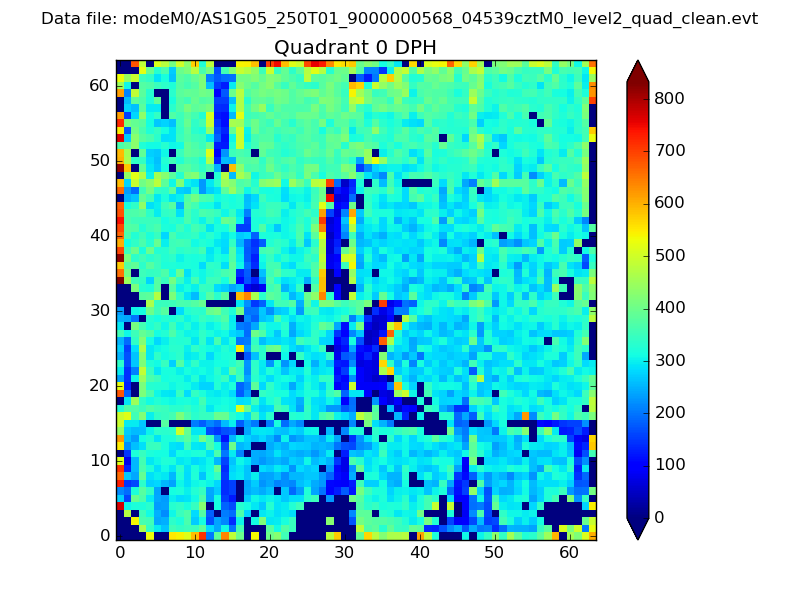 |
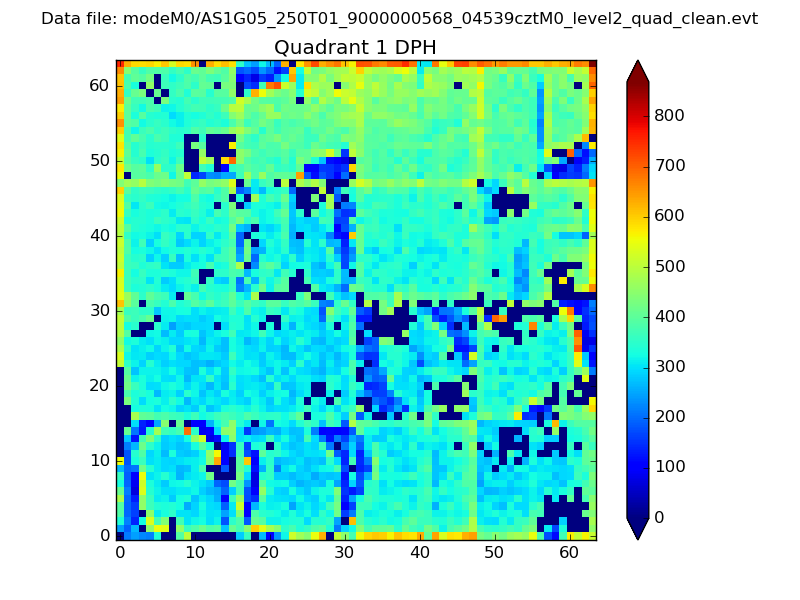 |
Quadrant B |
|---|---|---|---|
| Quadrant D | 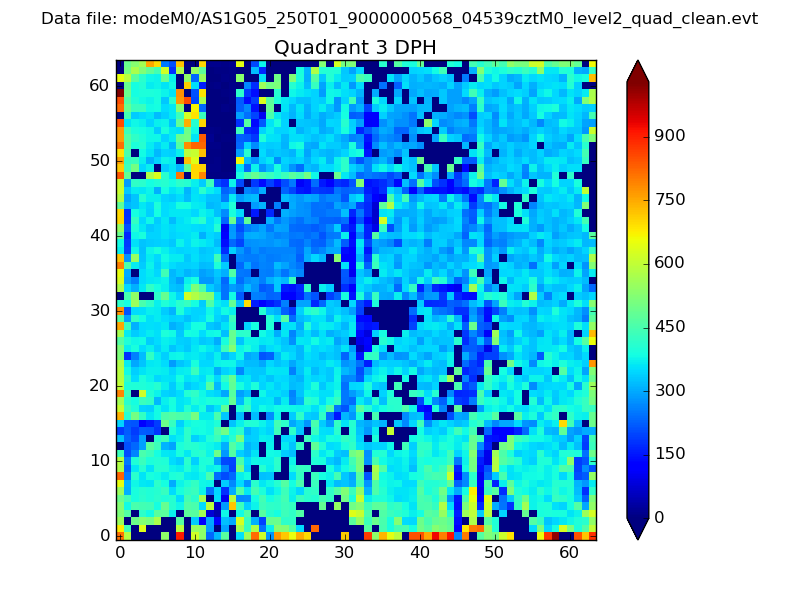 |
 |
Quadrant C |
| Plot type | Count rate plots | Images |
|---|---|---|
| Comparison with Poisson distribution Blue bars denote a histogram of data divided into 1 sec bins. Red curve is a Poisson curve with rate = median count rate of data. |
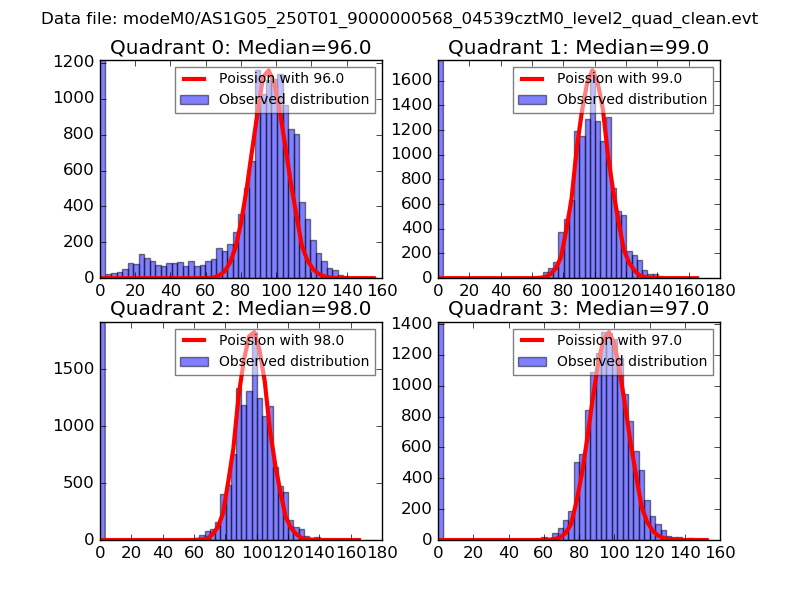 |
 |
| Quadrant-wise count rates Data is divided into 100 sec bins |
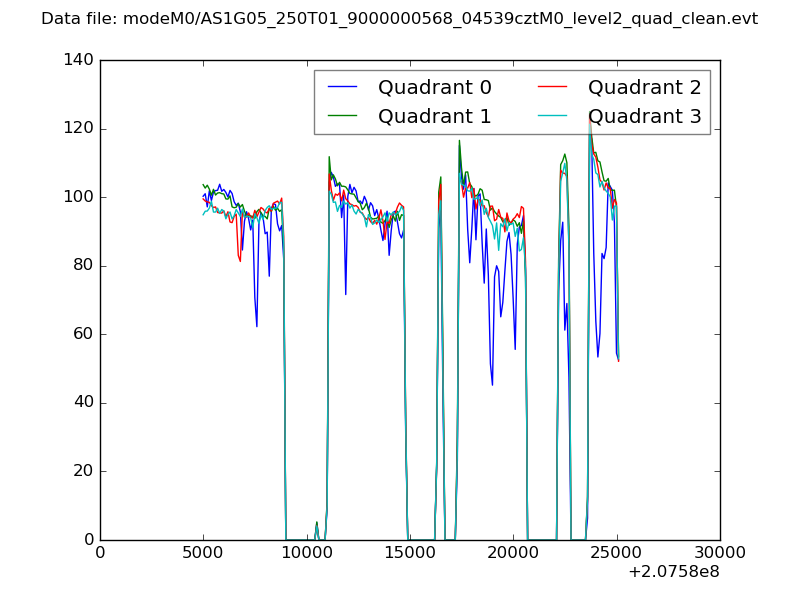 |
|
| Module-wise count rates for Quadrant A Data is divided into 100 sec bins |
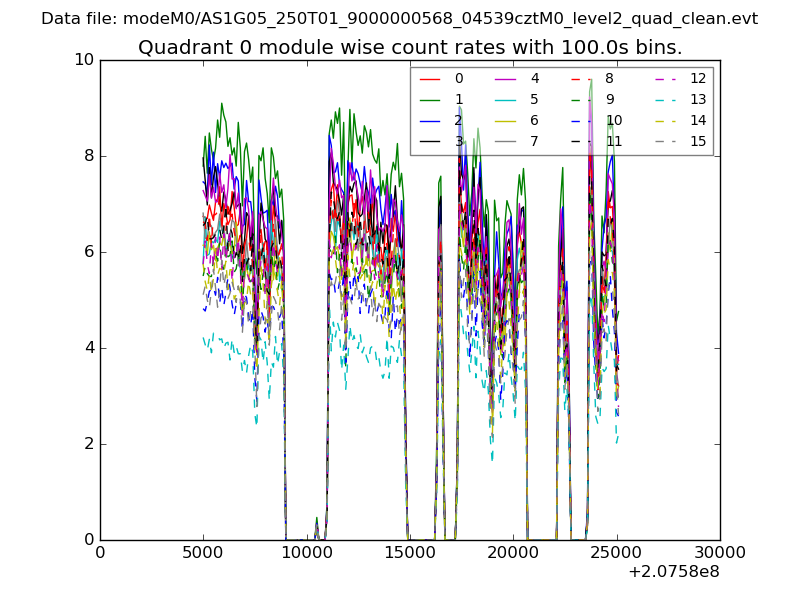 |
 |
| Module-wise count rates for Quadrant B Data is divided into 100 sec bins |
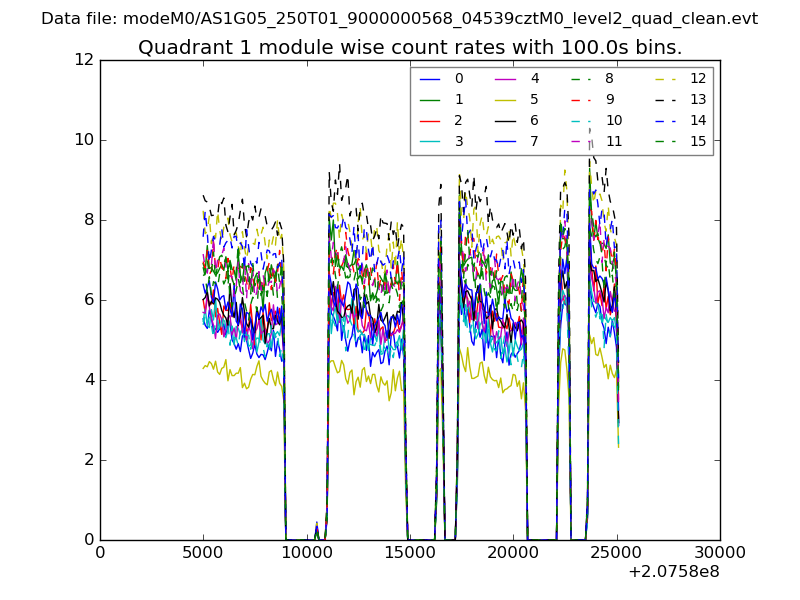 |
 |
| Module-wise count rates for Quadrant C Data is divided into 100 sec bins |
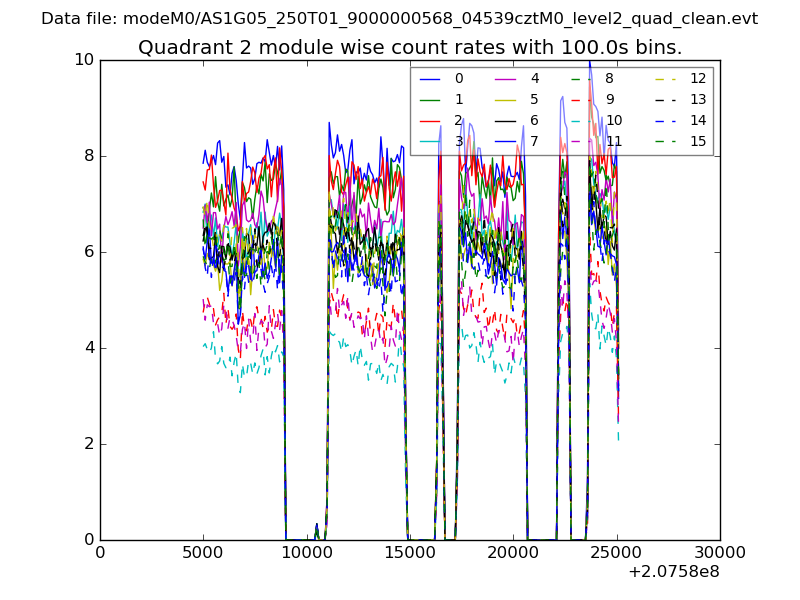 |
 |
| Module-wise count rates for Quadrant D Data is divided into 100 sec bins |
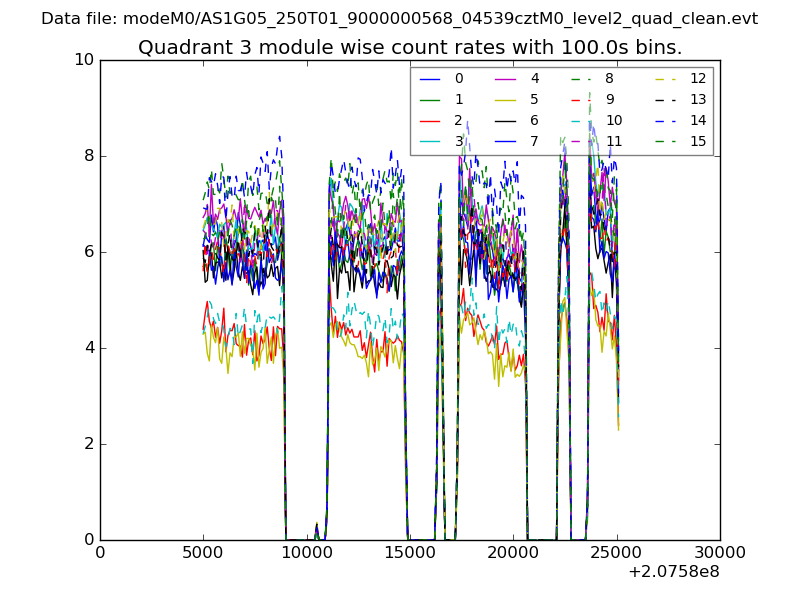 |
 |
| Parameter | Plot |
|---|---|
| CZT HV Monitor | 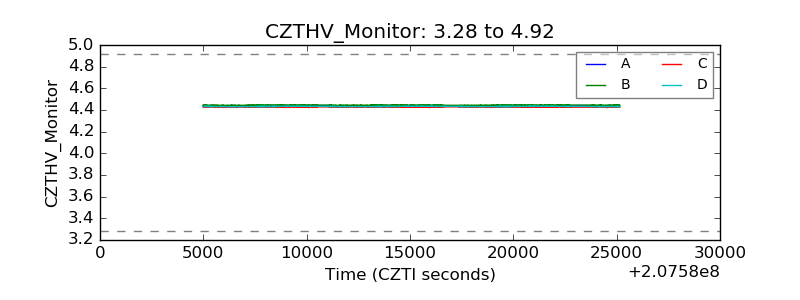 |
| D_VDD |  |
| Temperature 1 | 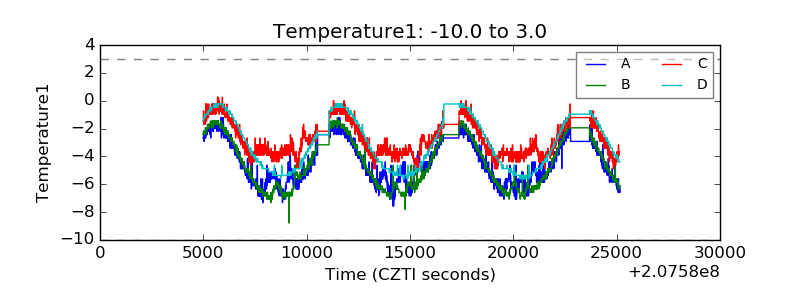 |
| Veto HV Monitor | 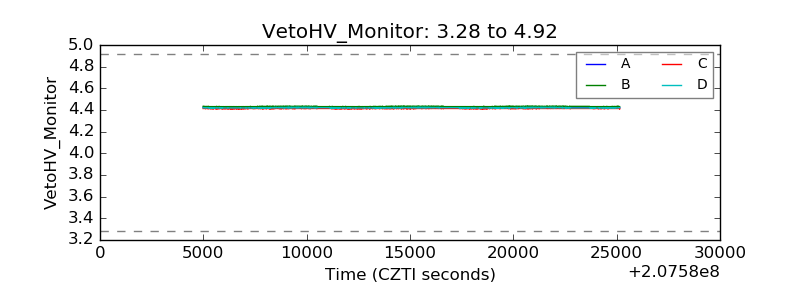 |
| Veto LLD | 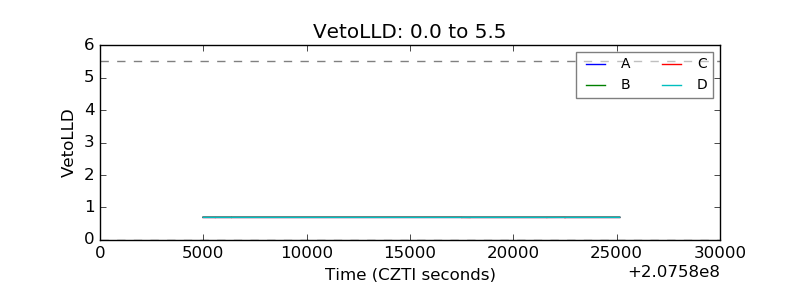 |
| Alpha Counter | 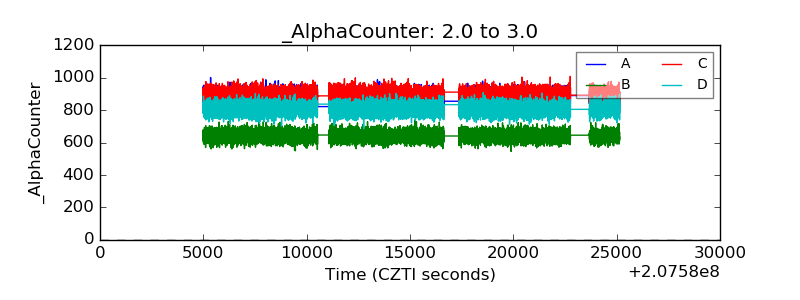 |
| _CPM_Rate | 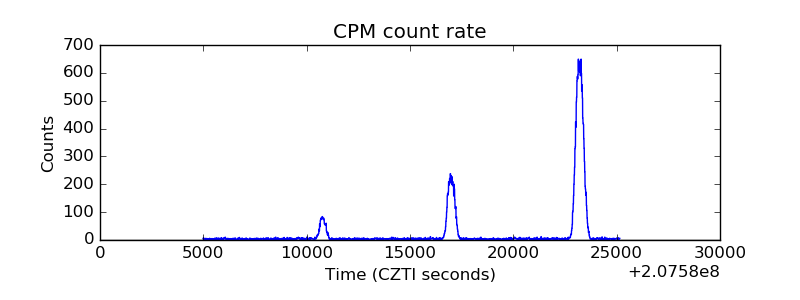 |
| CZT Counter |  |
| +2.5 Volts monitor |  |
| +5 Volts monitor |  |
| _ROLL_ROT | 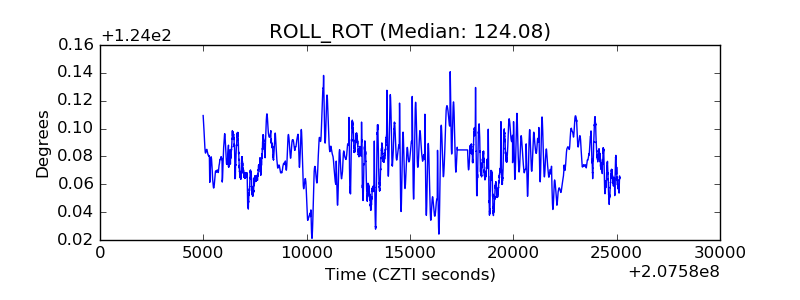 |
| _Roll_DEC | 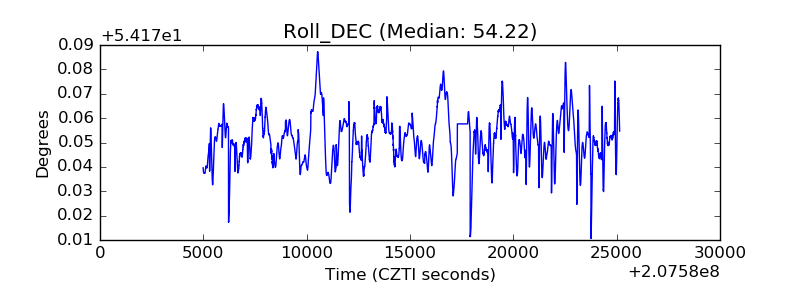 |
| _Roll_RA |  |
| Veto Counter | 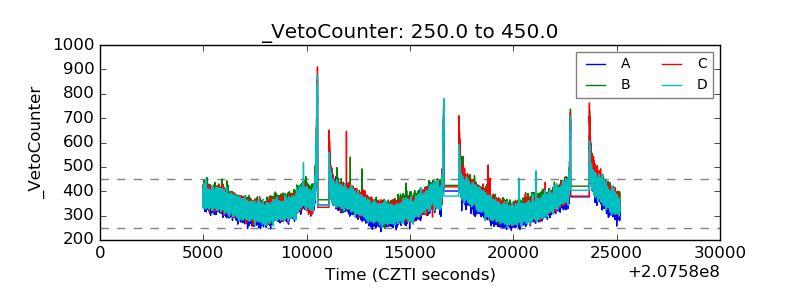 |