| Param | Original file | Final file |
|---|---|---|
| Filename | modeM0/AS1G05_250T01_9000000568_04543cztM0_level2.evt | modeM0/AS1G05_250T01_9000000568_04543cztM0_level2_quad_clean.evt |
| Size (bytes) | 527,163,840 | 84,107,520 |
| Size | 502.7 MB | 80.2 MB |
| Events in quadrant A | 6,014,640 | 499,278 |
| Events in quadrant B | 3,090,878 | 551,682 |
| Events in quadrant C | 3,324,538 | 535,662 |
| Events in quadrant D | 3,106,827 | 519,789 |
| Mode M0 | |||
|---|---|---|---|
| Quadrant | BADHDUFLAG | Total packets | Discarded packets |
| A | 0 | 22301 | 3 |
| B | 0 | 13422 | 2 |
| C | 0 | 14400 | 2 |
| D | 0 | 13870 | 2 |
| Mode SS | |||
|---|---|---|---|
| Quadrant | BADHDUFLAG | Total packets | Discarded packets |
| A | 0 | 130 | 0 |
| B | 0 | 130 | 0 |
| C | 0 | 130 | 0 |
| D | 0 | 130 | 0 |
| Mode M9 | |||
|---|---|---|---|
| Quadrant | BADHDUFLAG | Total packets | Discarded packets |
| A | 0 | 24 | 0 |
| B | 0 | 24 | 0 |
| C | 0 | 24 | 0 |
| D | 0 | 24 | 0 |
| Quadrant | Total seconds | Saturated seconds | Saturation percentage |
|---|---|---|---|
| A | 6309 | 1189 | 18.846093% |
| B | 6309 | 66 | 1.046125% |
| C | 6309 | 115 | 1.822793% |
| D | 6309 | 46 | 0.729117% |
Noise dominated data is calculated using 1-second bins in cleaned event files. If a bin has >2000 counts, and if more than 50% of those come from <1% of pixels, then it is considered to be noise-dominated and hence unusable.
| Quadrant | # 1 sec bins | Bins with >0 counts | Bins with >2000 counts | High rate bins dominated by noise | Noise dominated (total time) | Noise dominated (detector-on time) | Marked lightcurve |
|---|---|---|---|---|---|---|---|
| A | 8774 | 6310 | 657 | 657 | 7.49% | 10.41% |  |
| B | 8774 | 6310 | 9 | 9 | 0.10% | 0.14% | 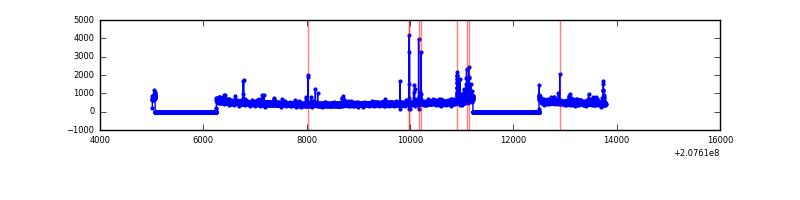 |
| C | 8774 | 6310 | 60 | 60 | 0.68% | 0.95% | 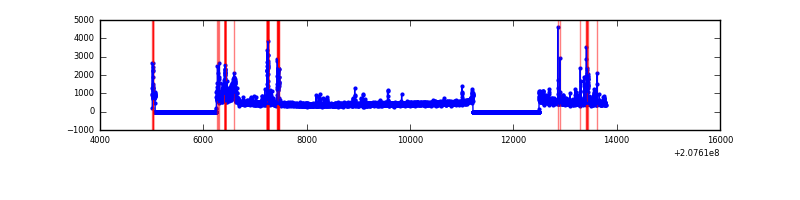 |
| D | 8774 | 6311 | 27 | 27 | 0.31% | 0.43% | 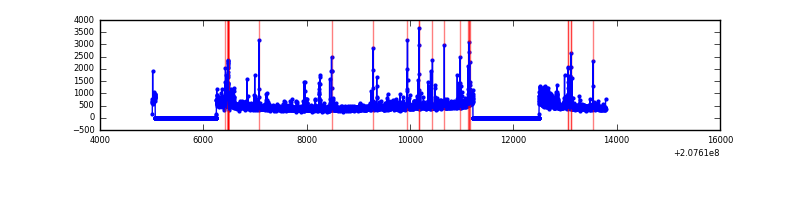 |
Top three noisy pixels from each quadrant. If the there are fewer than three noisy pixels in the level2.evt file, extra rows are filled as -1
| Pixel properties | Quadrant properties | ||||||
|---|---|---|---|---|---|---|---|
| Quadrant | DetID | PixID | Counts | Sigma | Mean | Median | Sigma |
| A | 0 | 13 | 3289486 | 24105.0 | 667 | 653 | 136.4 |
| A | 15 | 31 | 78595 | 571.26 | 667 | 653 | 136.4 |
| A | 0 | 118 | 51392 | 371.88 | 667 | 653 | 136.4 |
| B | 4 | 80 | 136006 | 961.13 | 746 | 730 | 140.7 |
| B | 4 | 48 | 29595 | 205.08 | 746 | 730 | 140.7 |
| B | 15 | 204 | 14785 | 99.86 | 746 | 730 | 140.7 |
| C | 14 | 48 | 504418 | 3071.54 | 712 | 716 | 164.0 |
| C | 1 | 16 | 16527 | 96.41 | 712 | 716 | 164.0 |
| C | 9 | 247 | 12860 | 74.05 | 712 | 716 | 164.0 |
| D | 1 | 20 | 159698 | 878.0 | 698 | 682 | 181.1 |
| D | 2 | 136 | 71181 | 389.26 | 698 | 682 | 181.1 |
| D | 13 | 235 | 70080 | 383.18 | 698 | 682 | 181.1 |
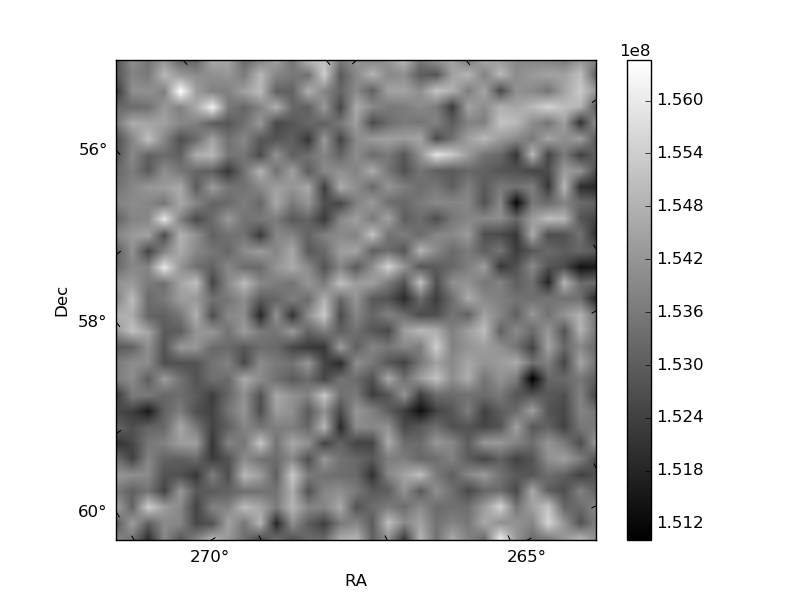
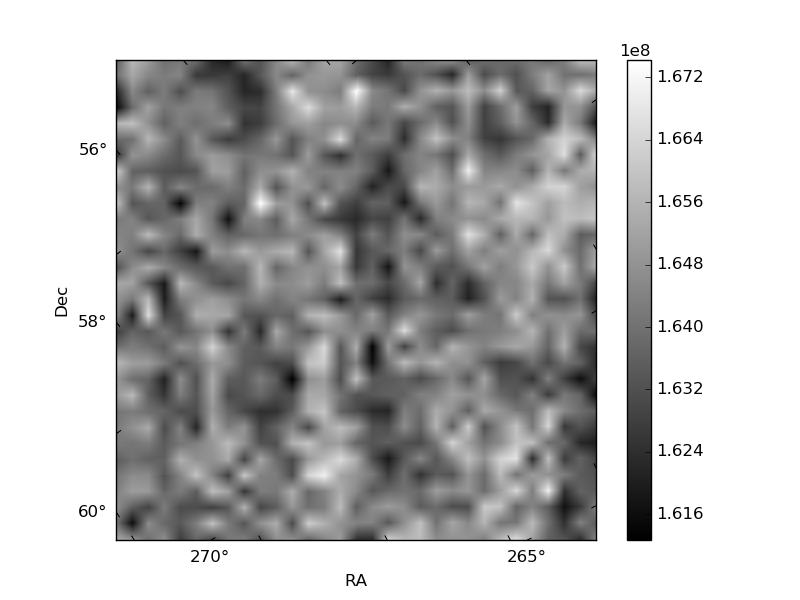
Histogram calculated using DETX and DETY for each event in the final _common_clean file
| Quadrant A |  |
 |
Quadrant B |
|---|---|---|---|
| Quadrant D | 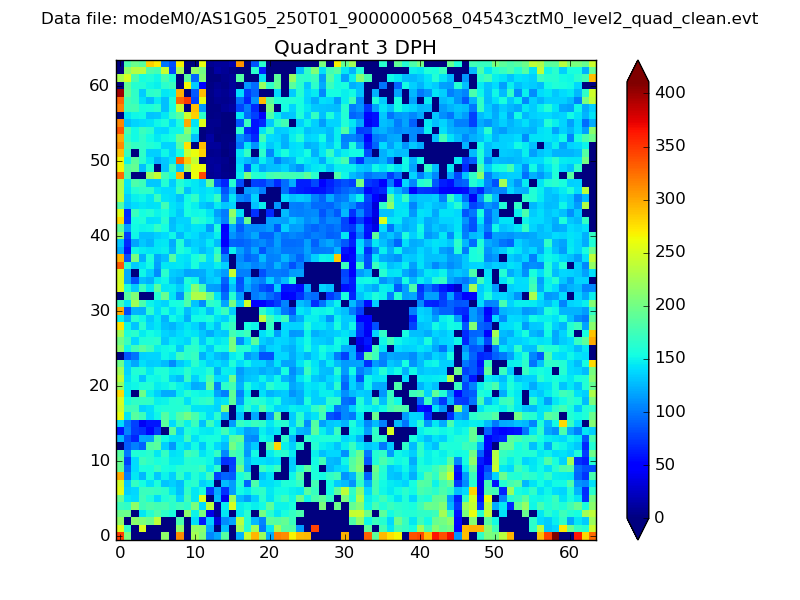 |
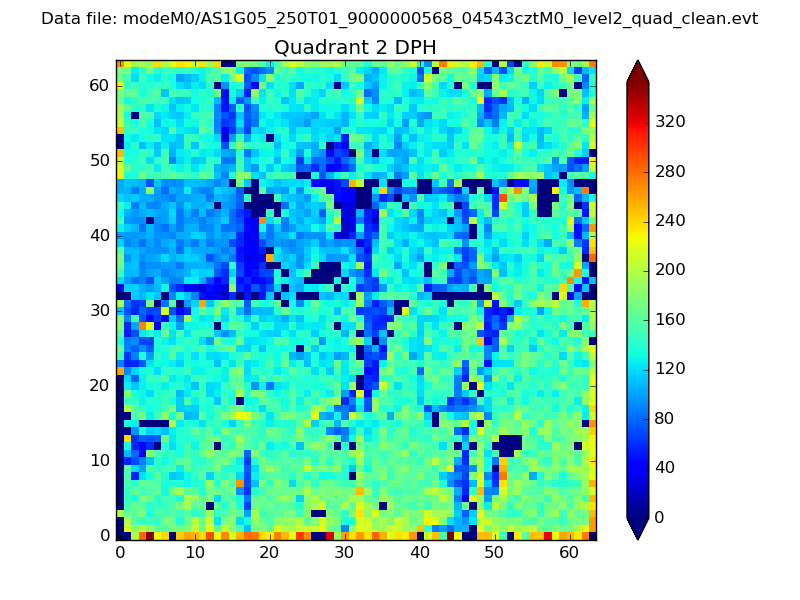 |
Quadrant C |
| Plot type | Count rate plots | Images |
|---|---|---|
| Comparison with Poisson distribution Blue bars denote a histogram of data divided into 1 sec bins. Red curve is a Poisson curve with rate = median count rate of data. |
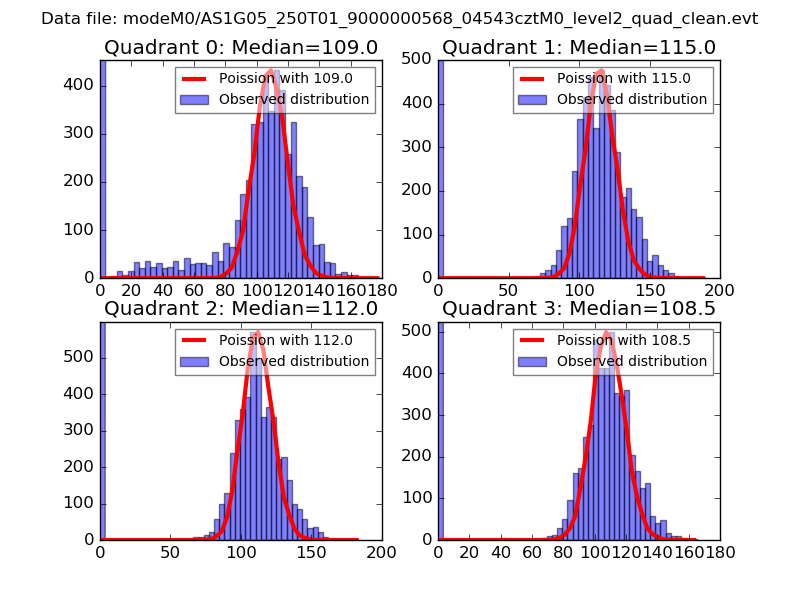 |
 |
| Quadrant-wise count rates Data is divided into 100 sec bins |
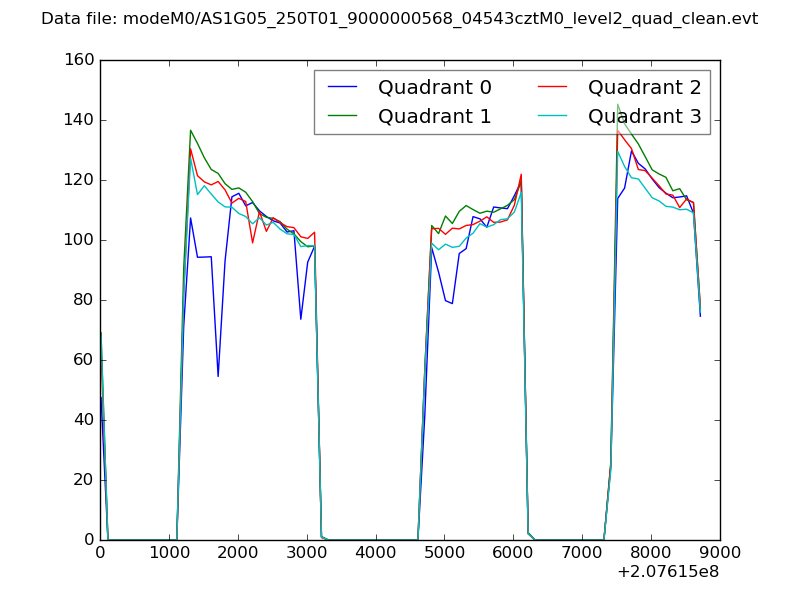 |
|
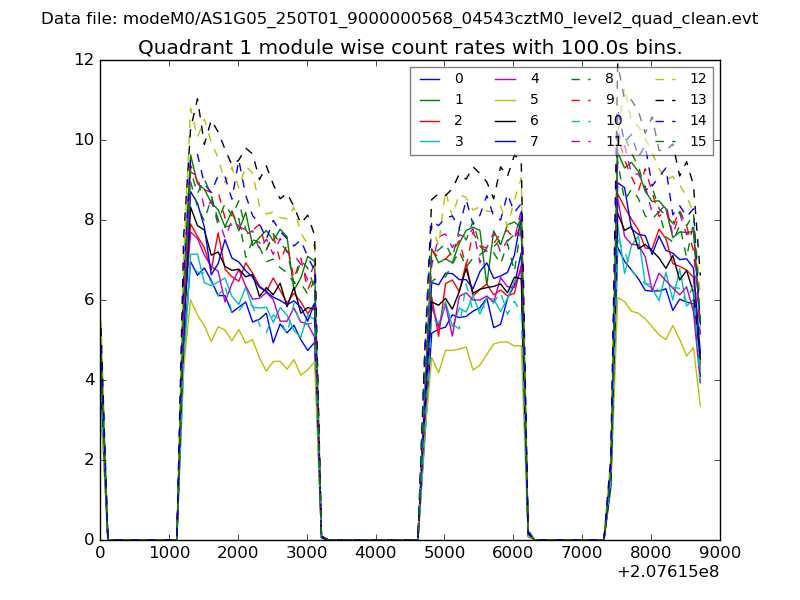
| Module-wise count rates for Quadrant A Data is divided into 100 sec bins |
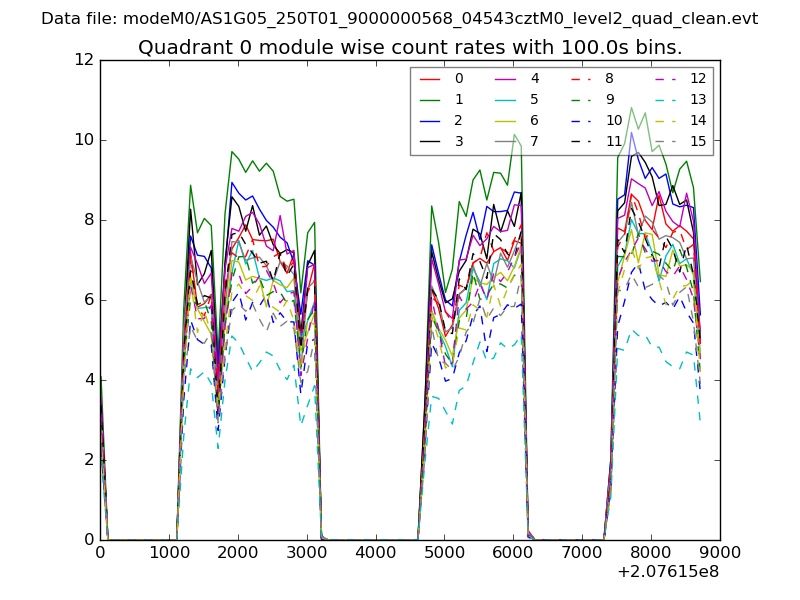 |
 |
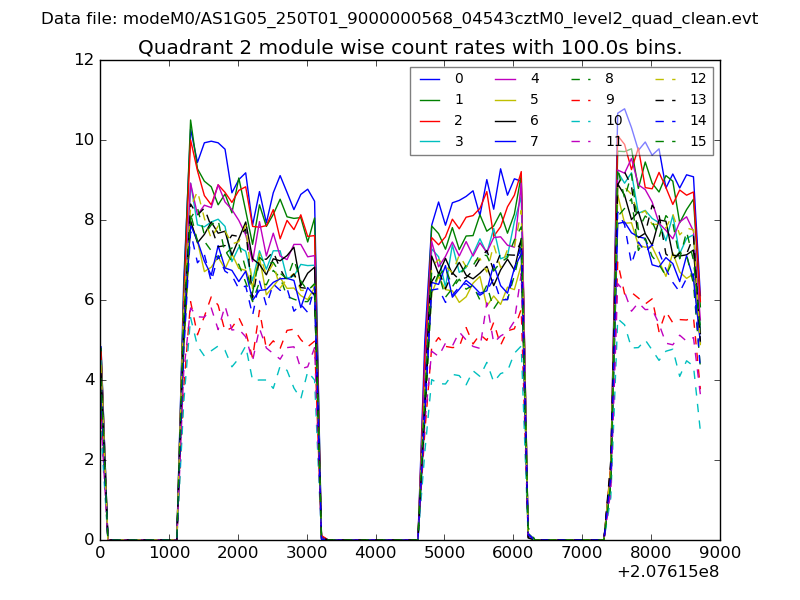
| Module-wise count rates for Quadrant B Data is divided into 100 sec bins |
 |
 |
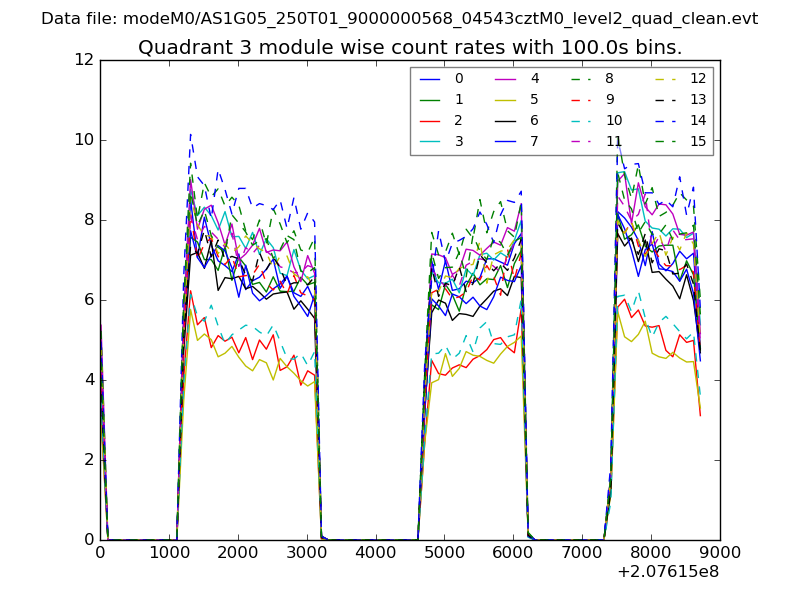
| Module-wise count rates for Quadrant C Data is divided into 100 sec bins |
 |
 |
| Module-wise count rates for Quadrant D Data is divided into 100 sec bins |
 |
 |
| Parameter | Plot |
|---|---|
| CZT HV Monitor | 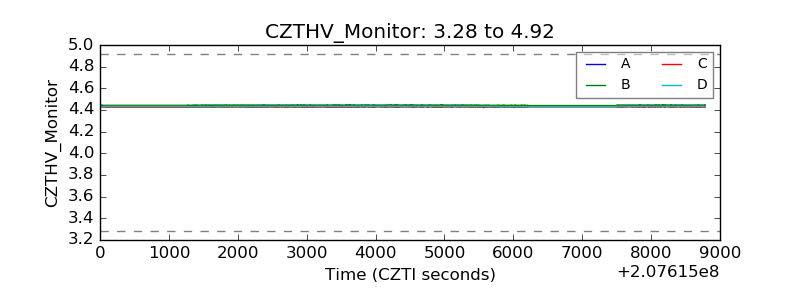 |
| D_VDD | 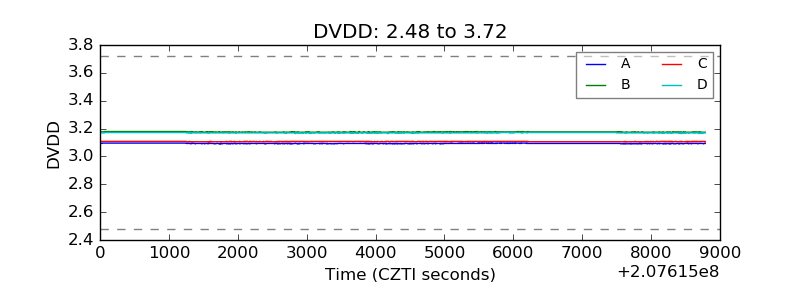 |
| Temperature 1 | 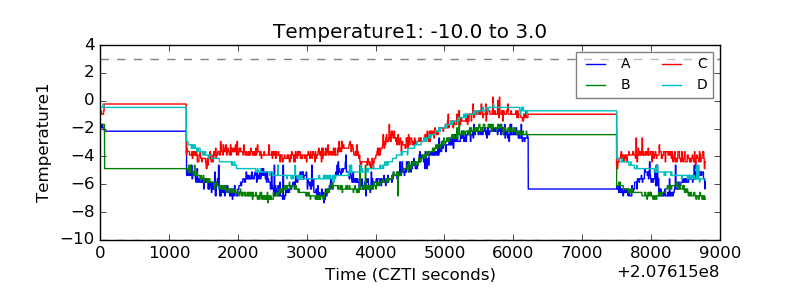 |
| Veto HV Monitor | 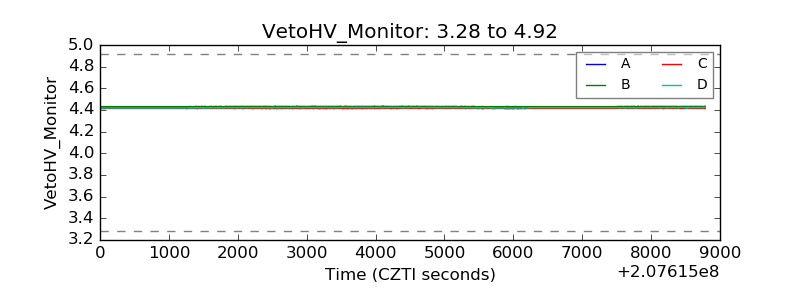 |
| Veto LLD | 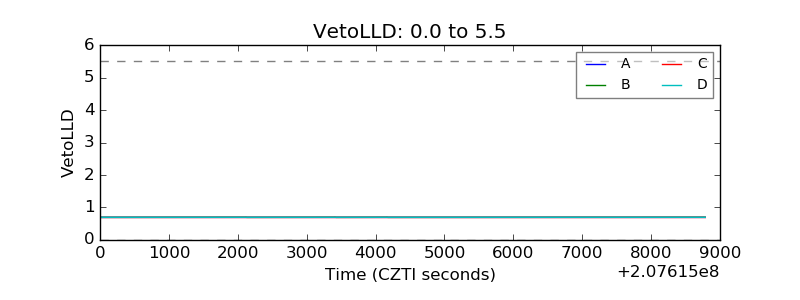 |
| Alpha Counter | 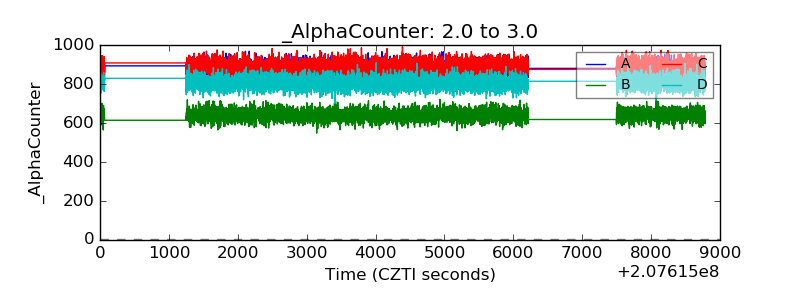 |
| _CPM_Rate | 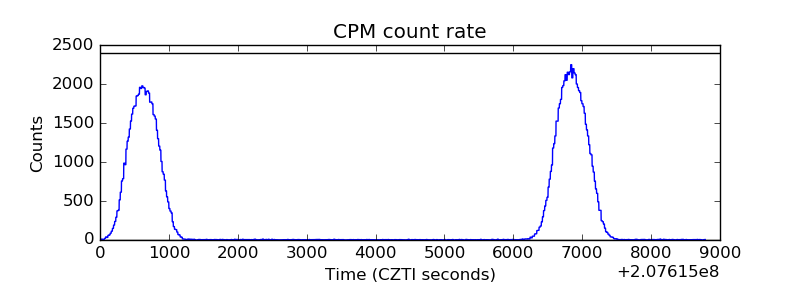 |
| CZT Counter | 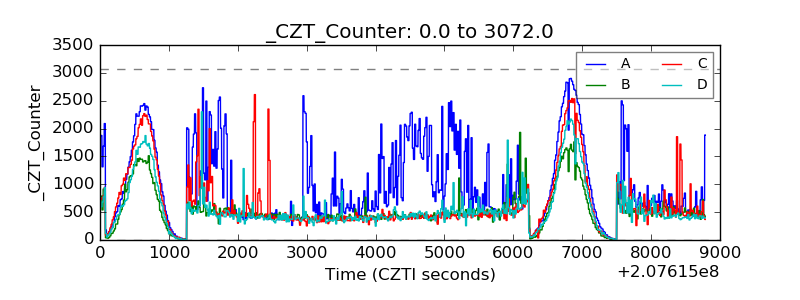 |
| +2.5 Volts monitor |  |
| +5 Volts monitor | 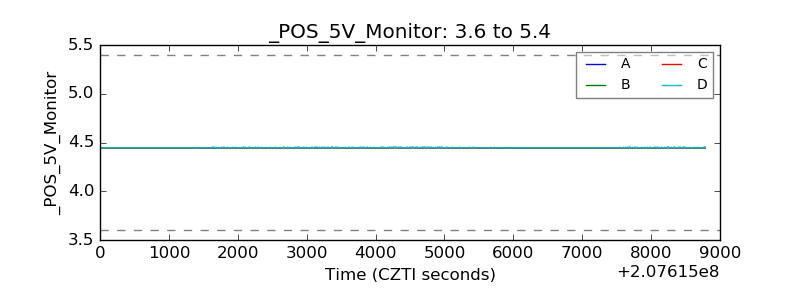 |
| _ROLL_ROT | 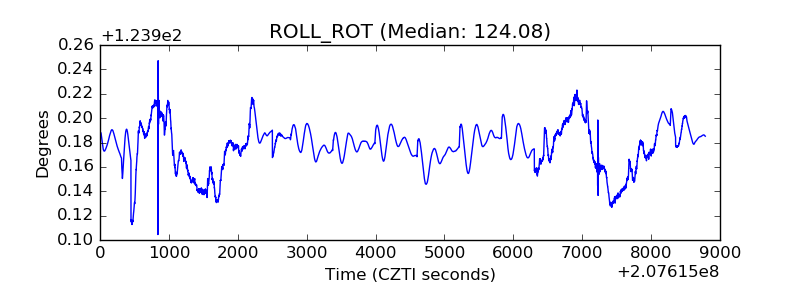 |
| _Roll_DEC | 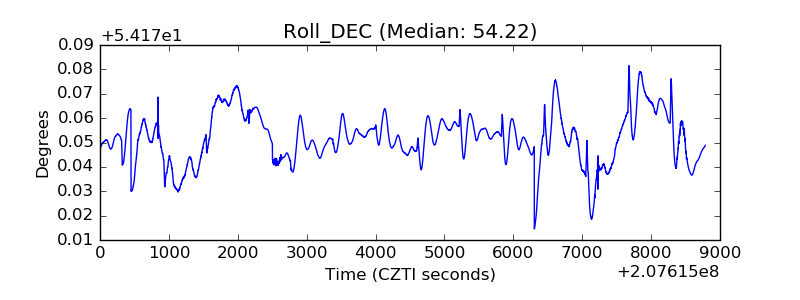 |
| _Roll_RA |  |
| Veto Counter | 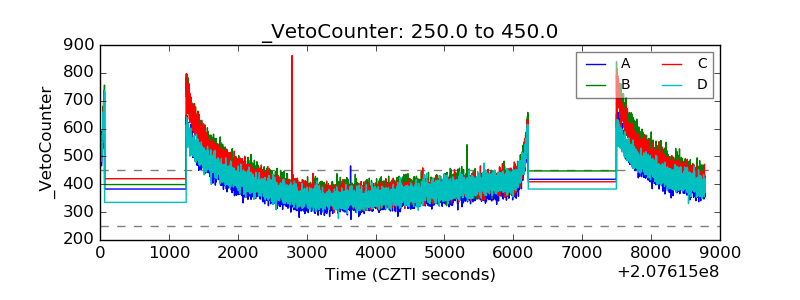 |