| Param | Original file | Final file |
|---|---|---|
| Filename | modeM0/AS1G05_250T01_9000000568_04544cztM0_level2.evt | modeM0/AS1G05_250T01_9000000568_04544cztM0_level2_quad_clean.evt |
| Size (bytes) | 300,931,200 | 41,474,880 |
| Size | 287.0 MB | 39.6 MB |
| Events in quadrant A | 3,417,053 | 237,345 |
| Events in quadrant B | 1,784,839 | 259,579 |
| Events in quadrant C | 1,928,424 | 251,419 |
| Events in quadrant D | 1,727,004 | 241,492 |
| Mode M0 | |||
|---|---|---|---|
| Quadrant | BADHDUFLAG | Total packets | Discarded packets |
| A | 0 | 12727 | 1 |
| B | 0 | 7778 | 1 |
| C | 0 | 8384 | 1 |
| D | 0 | 8057 | 1 |
| Mode SS | |||
|---|---|---|---|
| Quadrant | BADHDUFLAG | Total packets | Discarded packets |
| A | 0 | 76 | 0 |
| B | 0 | 76 | 0 |
| C | 0 | 76 | 0 |
| D | 0 | 76 | 0 |
| Mode M9 | |||
|---|---|---|---|
| Quadrant | BADHDUFLAG | Total packets | Discarded packets |
| A | 0 | 4 | 0 |
| B | 0 | 4 | 0 |
| C | 0 | 4 | 0 |
| D | 0 | 5 | 0 |
| Quadrant | Total seconds | Saturated seconds | Saturation percentage |
|---|---|---|---|
| A | 3752 | 367 | 9.781450% |
| B | 3752 | 9 | 0.239872% |
| C | 3752 | 17 | 0.453092% |
| D | 3752 | 14 | 0.373134% |
Noise dominated data is calculated using 1-second bins in cleaned event files. If a bin has >2000 counts, and if more than 50% of those come from <1% of pixels, then it is considered to be noise-dominated and hence unusable.
| Quadrant | # 1 sec bins | Bins with >0 counts | Bins with >2000 counts | High rate bins dominated by noise | Noise dominated (total time) | Noise dominated (detector-on time) | Marked lightcurve |
|---|---|---|---|---|---|---|---|
| A | 3752 | 3751 | 231 | 231 | 6.16% | 6.16% | 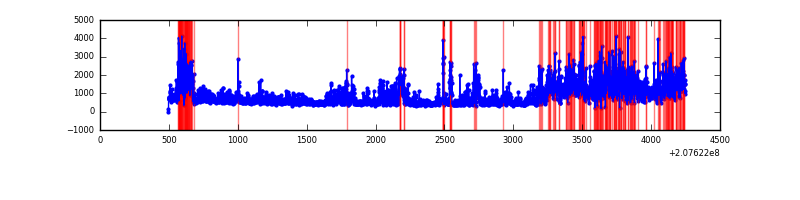 |
| B | 3752 | 3751 | 2 | 2 | 0.05% | 0.05% | 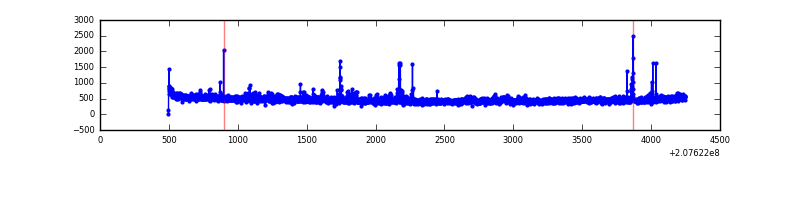 |
| C | 3752 | 3751 | 13 | 13 | 0.35% | 0.35% | 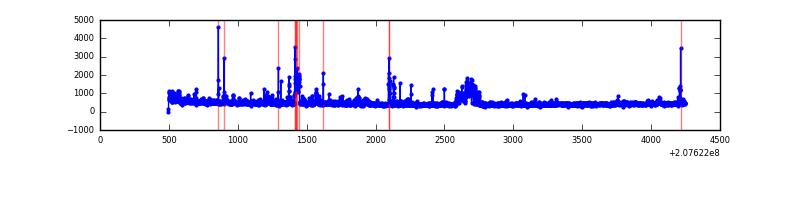 |
| D | 3752 | 3752 | 12 | 12 | 0.32% | 0.32% | 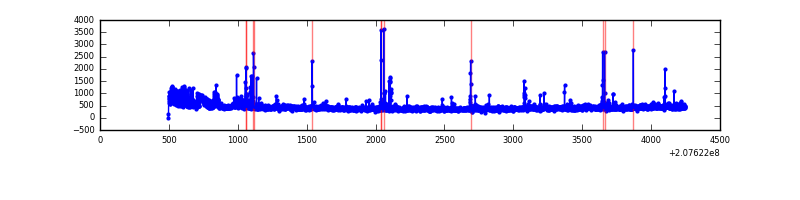 |
Top three noisy pixels from each quadrant. If the there are fewer than three noisy pixels in the level2.evt file, extra rows are filled as -1
| Pixel properties | Quadrant properties | ||||||
|---|---|---|---|---|---|---|---|
| Quadrant | DetID | PixID | Counts | Sigma | Mean | Median | Sigma |
| A | 0 | 13 | 1841016 | 21987.99 | 404 | 396 | 83.7 |
| A | 8 | 15 | 7080 | 79.85 | 404 | 396 | 83.7 |
| A | 0 | 118 | 5838 | 65.01 | 404 | 396 | 83.7 |
| B | 4 | 80 | 56372 | 681.6 | 429 | 420 | 82.1 |
| B | 14 | 167 | 22486 | 268.8 | 429 | 420 | 82.1 |
| B | 4 | 48 | 18029 | 214.51 | 429 | 420 | 82.1 |
| C | 14 | 48 | 306059 | 3196.74 | 408 | 412 | 95.6 |
| C | 1 | 16 | 16721 | 170.57 | 408 | 412 | 95.6 |
| C | 5 | 250 | 6081 | 59.29 | 408 | 412 | 95.6 |
| D | 1 | 20 | 84123 | 797.01 | 395 | 387 | 105.1 |
| D | 2 | 136 | 37866 | 356.73 | 395 | 387 | 105.1 |
| D | 13 | 235 | 34625 | 325.88 | 395 | 387 | 105.1 |
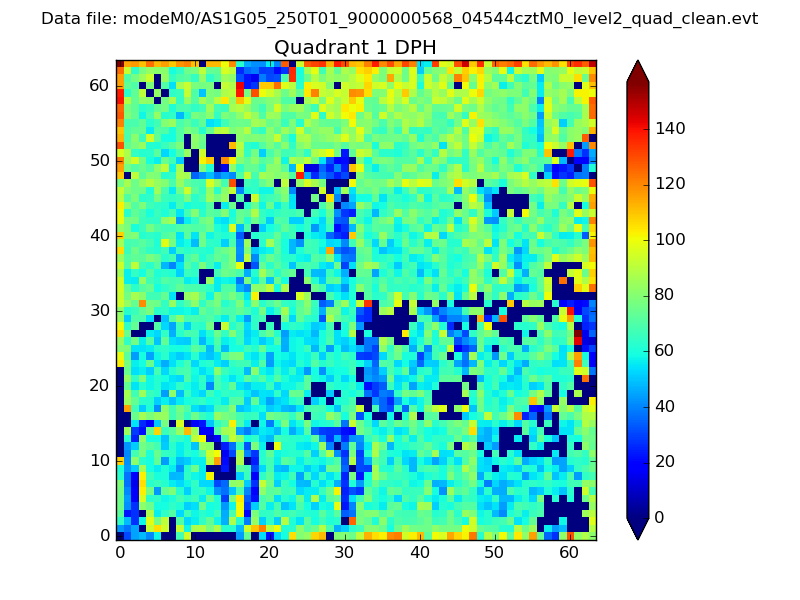
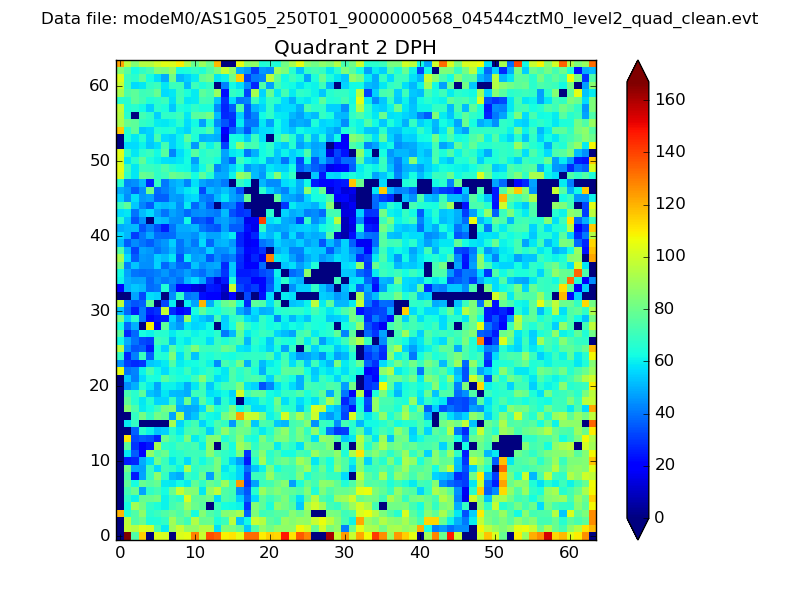
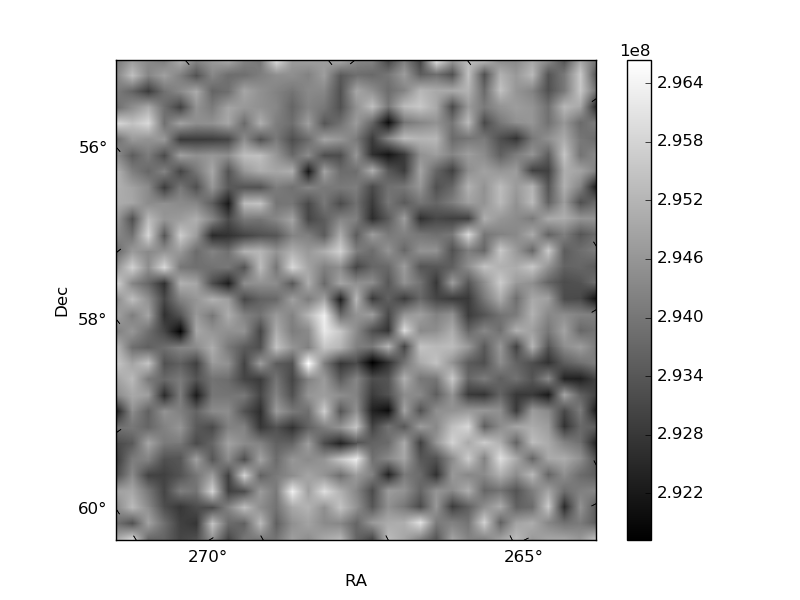
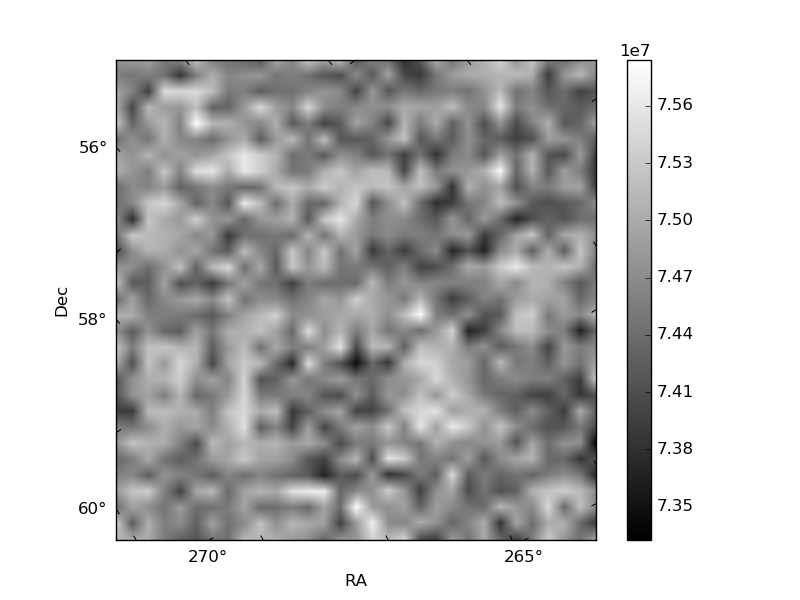
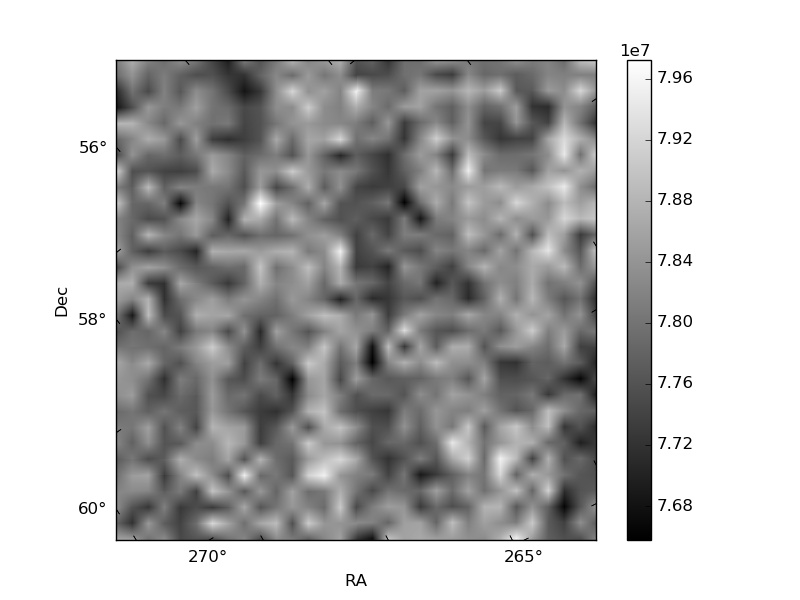
Histogram calculated using DETX and DETY for each event in the final _common_clean file
| Quadrant A |  |
 |
Quadrant B |
|---|---|---|---|
| Quadrant D | 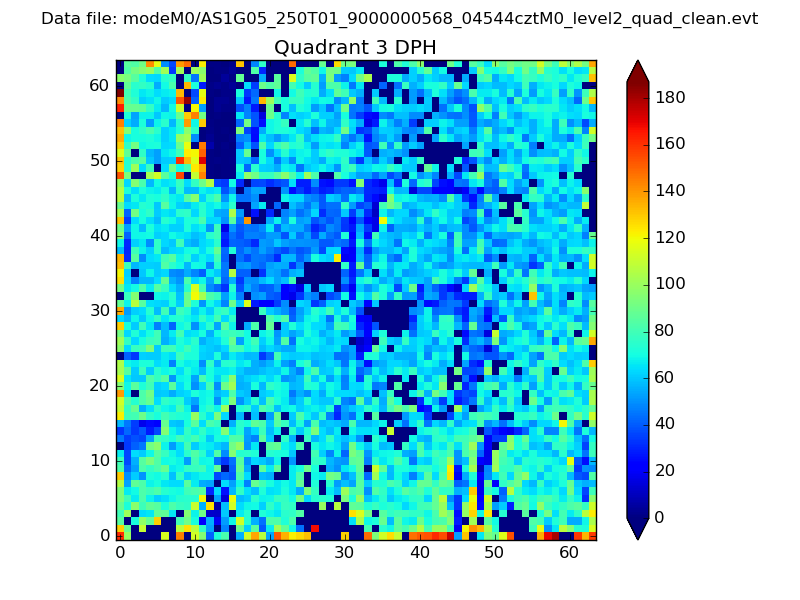 |
 |
Quadrant C |
| Plot type | Count rate plots | Images |
|---|---|---|
| Comparison with Poisson distribution Blue bars denote a histogram of data divided into 1 sec bins. Red curve is a Poisson curve with rate = median count rate of data. |
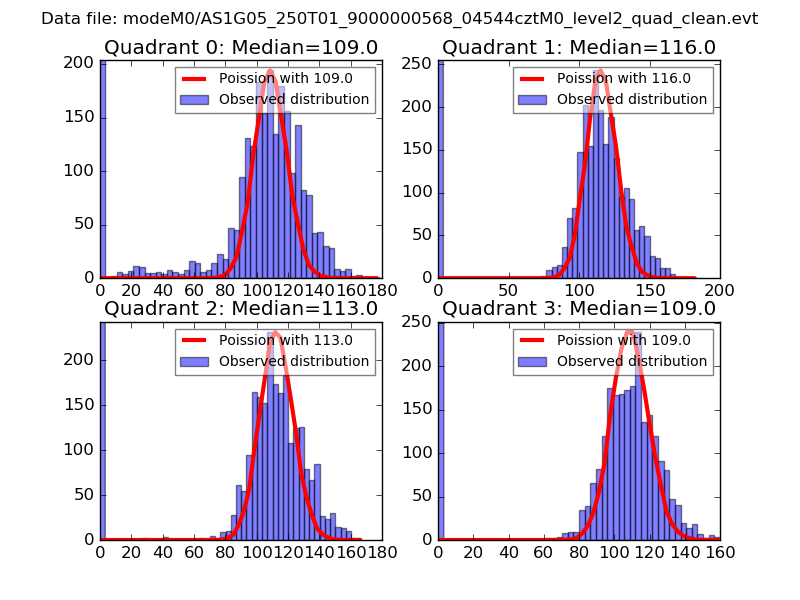 |
 |
| Quadrant-wise count rates Data is divided into 100 sec bins |
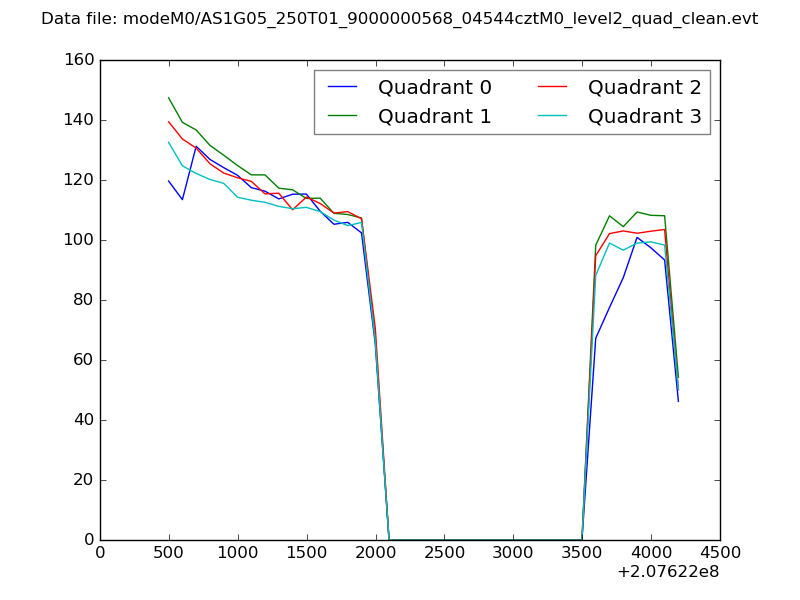 |
|
| Module-wise count rates for Quadrant A Data is divided into 100 sec bins |
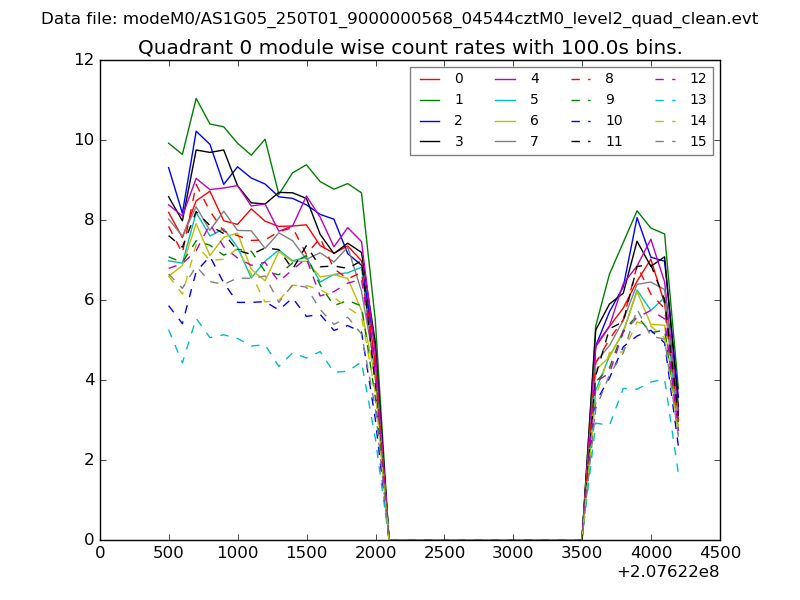 |
 |
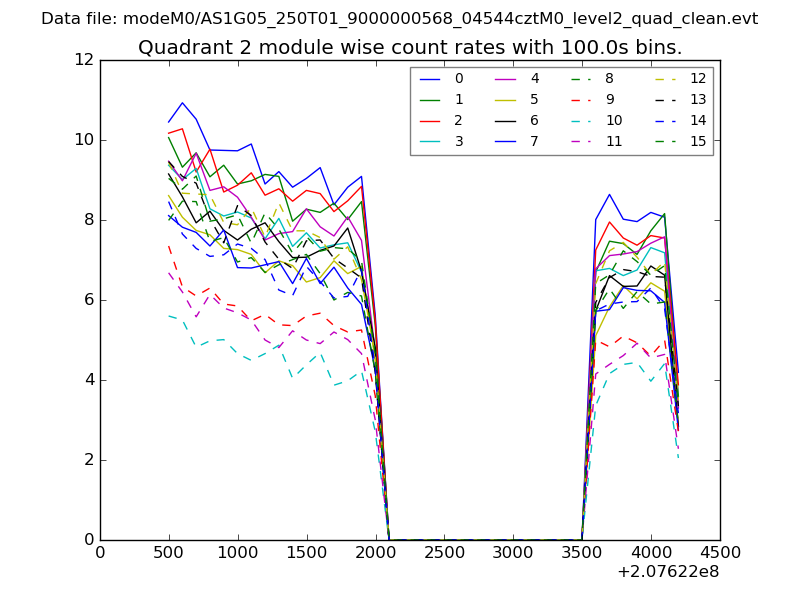
| Module-wise count rates for Quadrant B Data is divided into 100 sec bins |
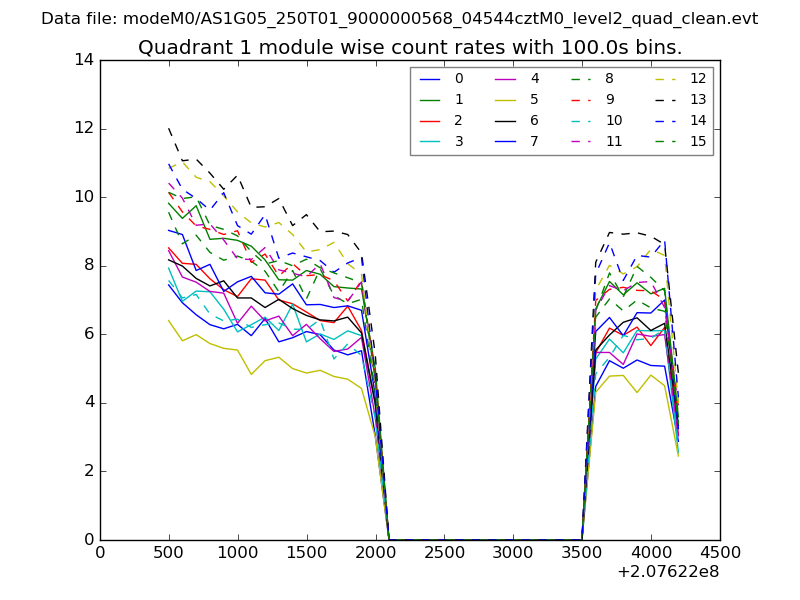 |
 |
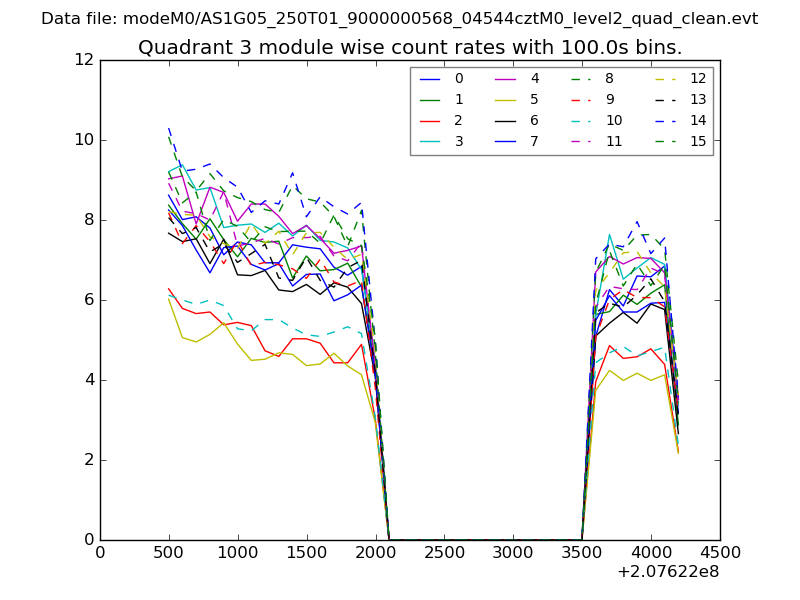
| Module-wise count rates for Quadrant C Data is divided into 100 sec bins |
 |
 |
| Module-wise count rates for Quadrant D Data is divided into 100 sec bins |
 |
 |
| Parameter | Plot |
|---|---|
| CZT HV Monitor | 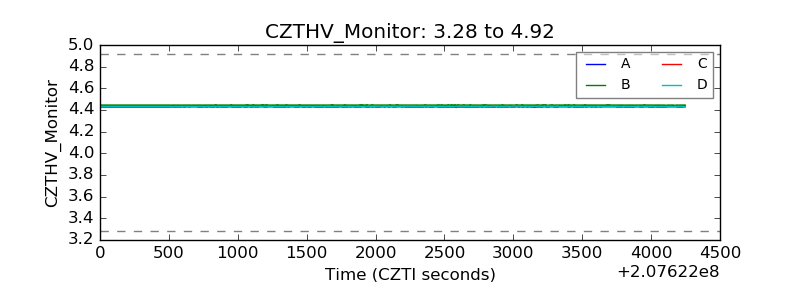 |
| D_VDD | 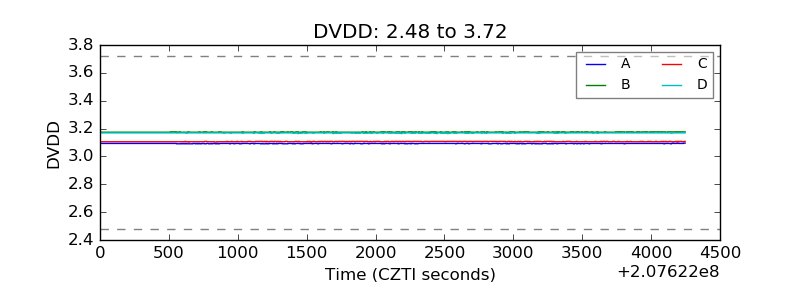 |
| Temperature 1 | 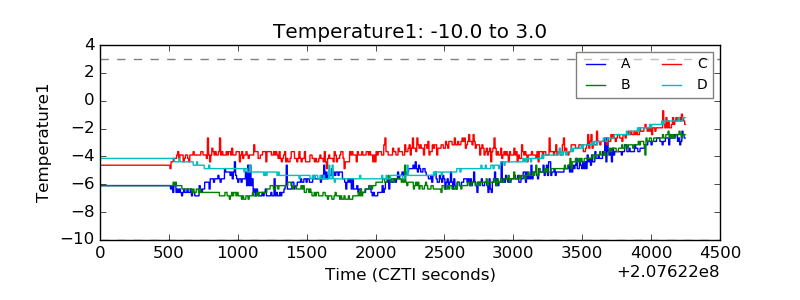 |
| Veto HV Monitor | 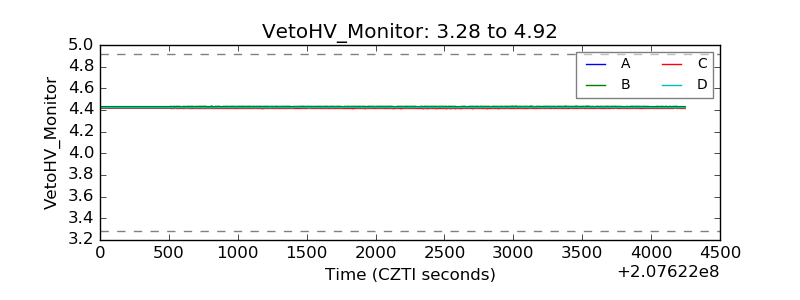 |
| Veto LLD | 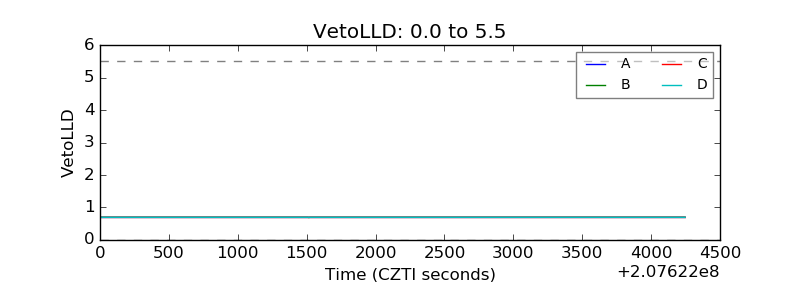 |
| Alpha Counter | 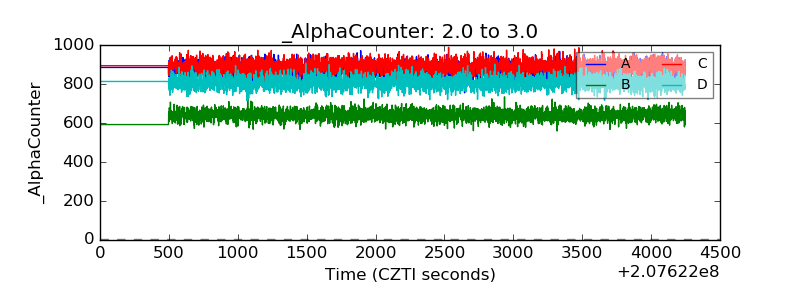 |
| _CPM_Rate | 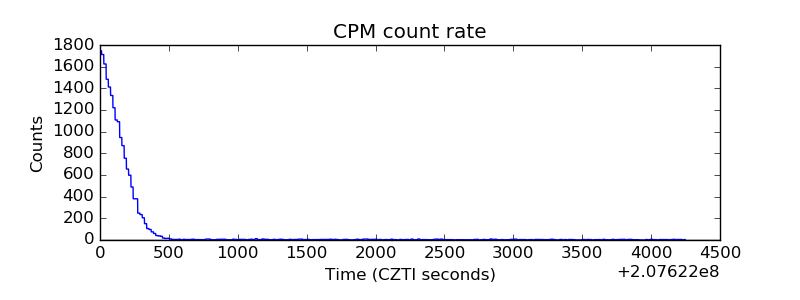 |
| CZT Counter | 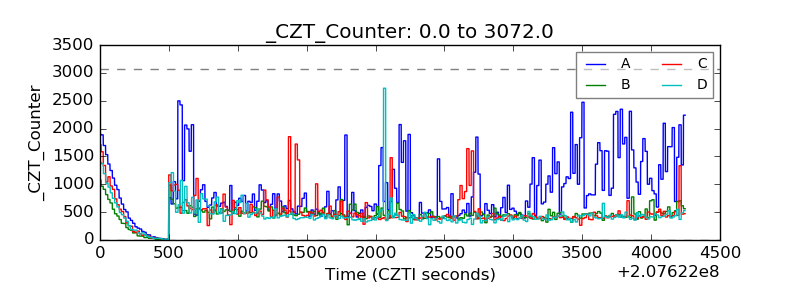 |
| +2.5 Volts monitor |  |
| +5 Volts monitor | 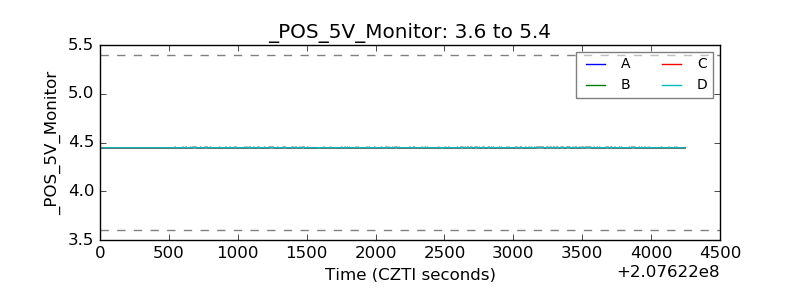 |
| _ROLL_ROT | 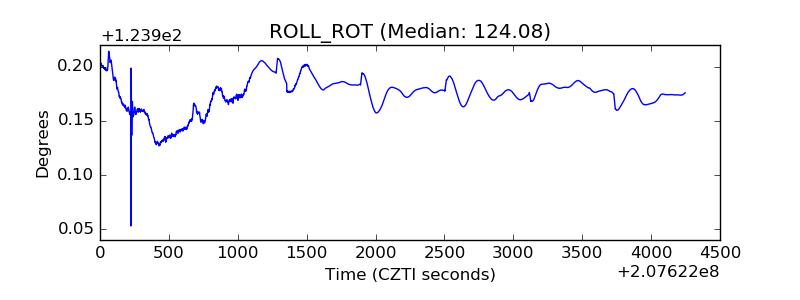 |
| _Roll_DEC | 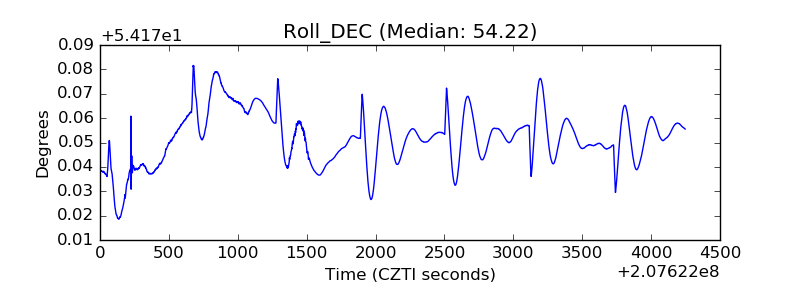 |
| _Roll_RA | 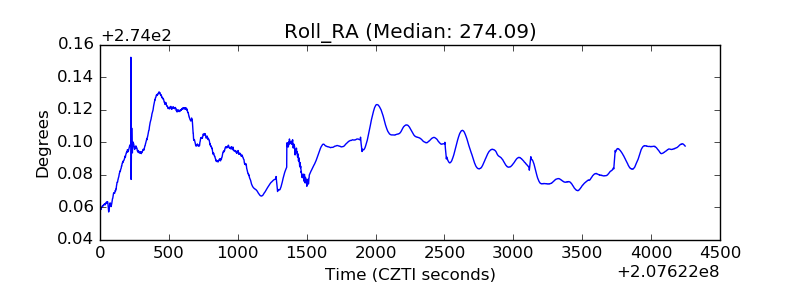 |
| Veto Counter | 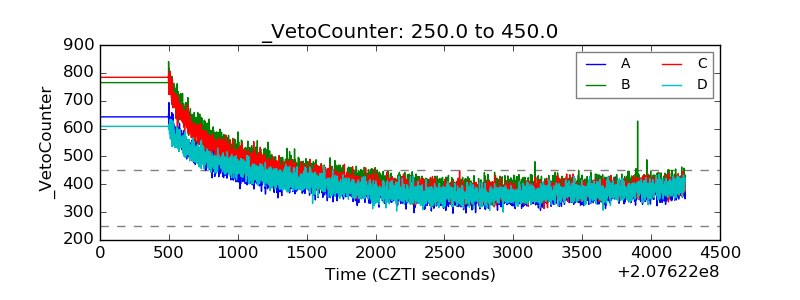 |