| Param | Original file | Final file |
|---|---|---|
| Filename | modeM0/AS1SLEW_01234_9000000565_04499cztM0_level2.evt | modeM0/AS1SLEW_01234_9000000565_04499cztM0_level2_quad_clean.evt |
| Size (bytes) | 80,864,640 | 3,804,480 |
| Size | 77.1 MB | 3.6 MB |
| Events in quadrant A | 561,476 | 5,826 |
| Events in quadrant B | 625,358 | 5,708 |
| Events in quadrant C | 535,151 | 5,826 |
| Events in quadrant D | 641,577 | 5,629 |
| Mode SS | |||
|---|---|---|---|
| Quadrant | BADHDUFLAG | Total packets | Discarded packets |
| A | 0 | 24 | 0 |
| B | 0 | 24 | 0 |
| C | 0 | 24 | 0 |
| D | 0 | 24 | 0 |
| Mode M0 | |||
|---|---|---|---|
| Quadrant | BADHDUFLAG | Total packets | Discarded packets |
| A | 0 | 2447 | 0 |
| B | 0 | 2681 | 0 |
| C | 0 | 2425 | 0 |
| D | 0 | 2765 | 0 |
| Quadrant | Total seconds | Saturated seconds | Saturation percentage |
|---|---|---|---|
| A | 1211 | 0 | 0.000000% |
| B | 1211 | 13 | 1.073493% |
| C | 1211 | 0 | 0.000000% |
| D | 1211 | 29 | 2.394715% |
Noise dominated data is calculated using 1-second bins in cleaned event files. If a bin has >2000 counts, and if more than 50% of those come from <1% of pixels, then it is considered to be noise-dominated and hence unusable.
| Quadrant | # 1 sec bins | Bins with >0 counts | Bins with >2000 counts | High rate bins dominated by noise | Noise dominated (total time) | Noise dominated (detector-on time) | Marked lightcurve |
|---|---|---|---|---|---|---|---|
| A | 1211 | 1211 | 0 | 0 | 0.00% | 0.00% | 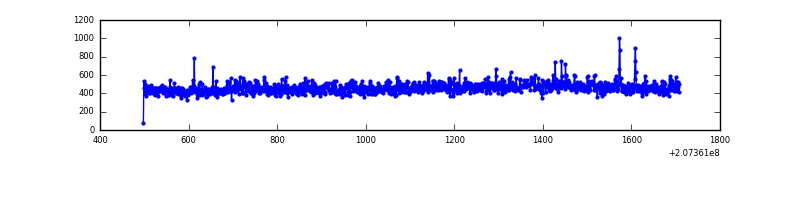 |
| B | 1211 | 1211 | 8 | 8 | 0.66% | 0.66% | 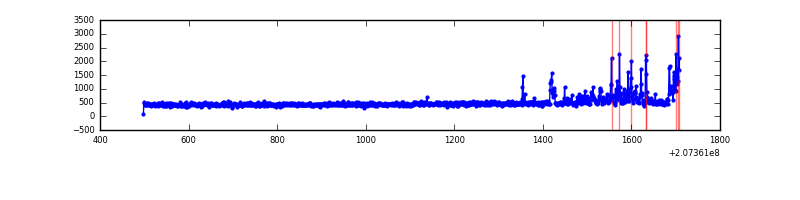 |
| C | 1211 | 1211 | 0 | 0 | 0.00% | 0.00% | 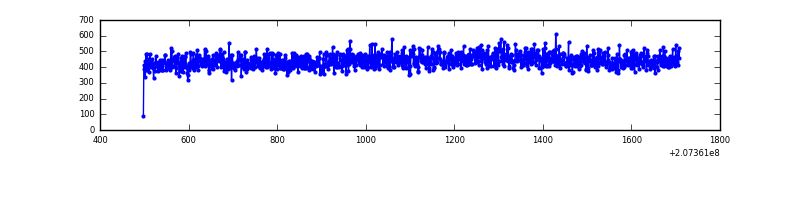 |
| D | 1211 | 1211 | 22 | 22 | 1.82% | 1.82% | 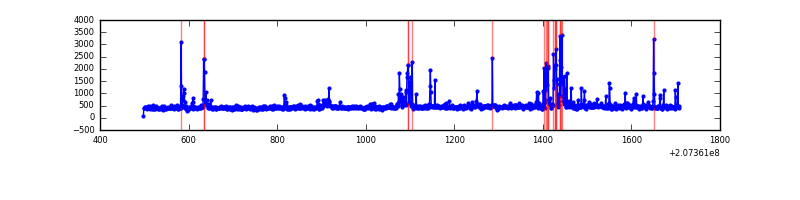 |
Top three noisy pixels from each quadrant. If the there are fewer than three noisy pixels in the level2.evt file, extra rows are filled as -1
| Pixel properties | Quadrant properties | ||||||
|---|---|---|---|---|---|---|---|
| Quadrant | DetID | PixID | Counts | Sigma | Mean | Median | Sigma |
| A | 0 | 13 | 17595 | 573.45 | 139 | 135 | 30.4 |
| A | 7 | 16 | 6754 | 217.39 | 139 | 135 | 30.4 |
| A | 0 | 226 | 1419 | 42.17 | 139 | 135 | 30.4 |
| B | 10 | 16 | 83968 | 2894.55 | 138 | 135 | 29.0 |
| B | 15 | 204 | 4029 | 134.45 | 138 | 135 | 29.0 |
| B | 12 | 111 | 2451 | 79.97 | 138 | 135 | 29.0 |
| C | 13 | 61 | 1148 | 30.24 | 136 | 137 | 33.4 |
| C | 9 | 221 | 662 | 15.7 | 136 | 137 | 33.4 |
| C | 9 | 54 | 649 | 15.31 | 136 | 137 | 33.4 |
| D | 13 | 235 | 110926 | 3244.22 | 135 | 131 | 34.2 |
| D | 13 | 239 | 7751 | 223.12 | 135 | 131 | 34.2 |
| D | 2 | 136 | 7068 | 203.12 | 135 | 131 | 34.2 |
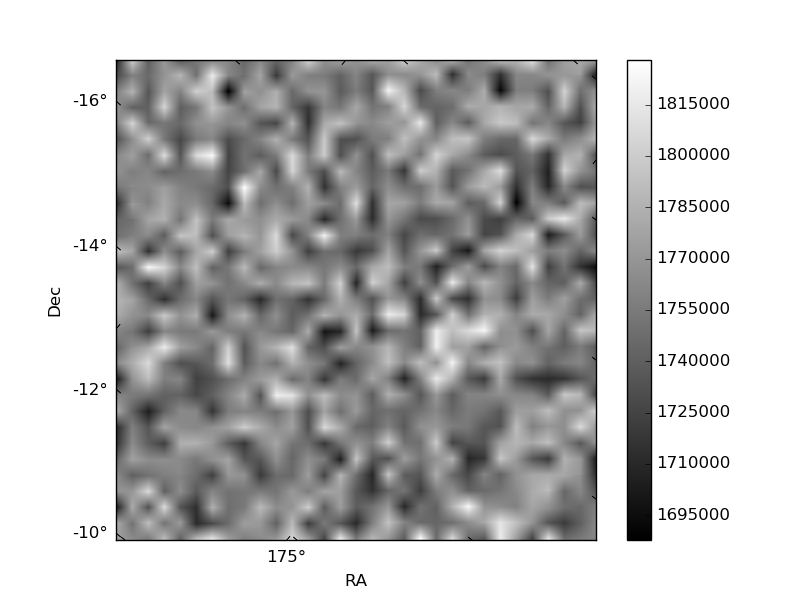
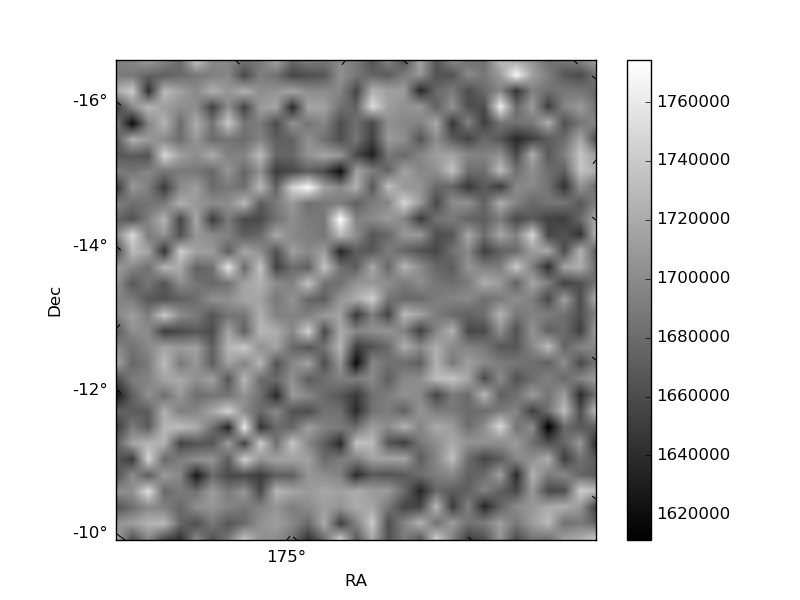
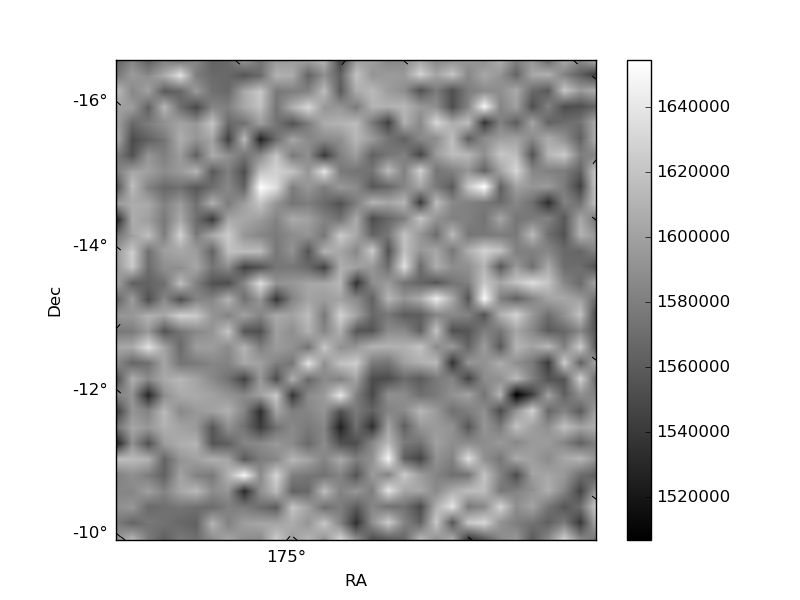
Histogram calculated using DETX and DETY for each event in the final _common_clean file
| Quadrant A | 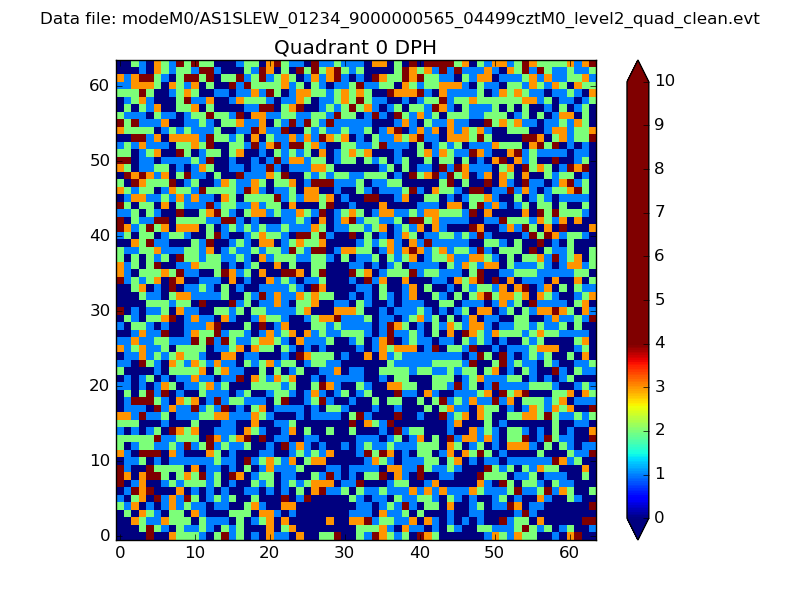 |
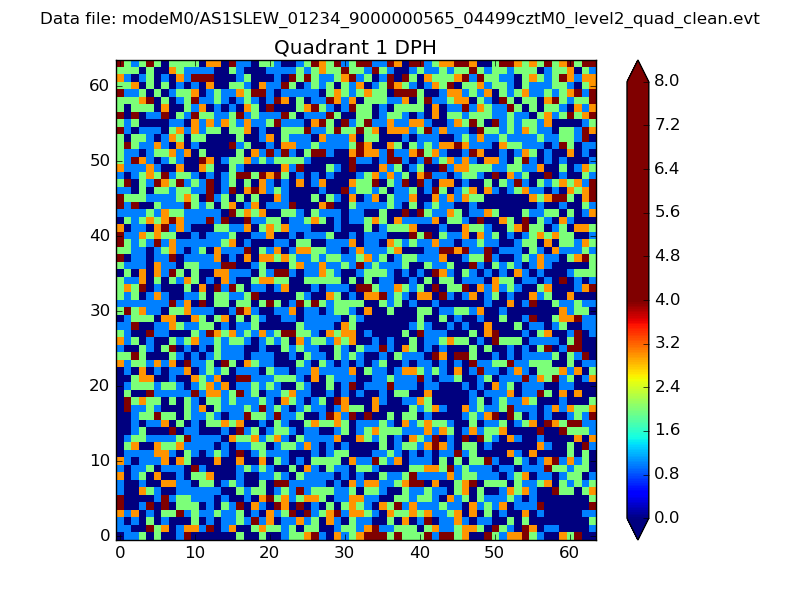 |
Quadrant B |
|---|---|---|---|
| Quadrant D | 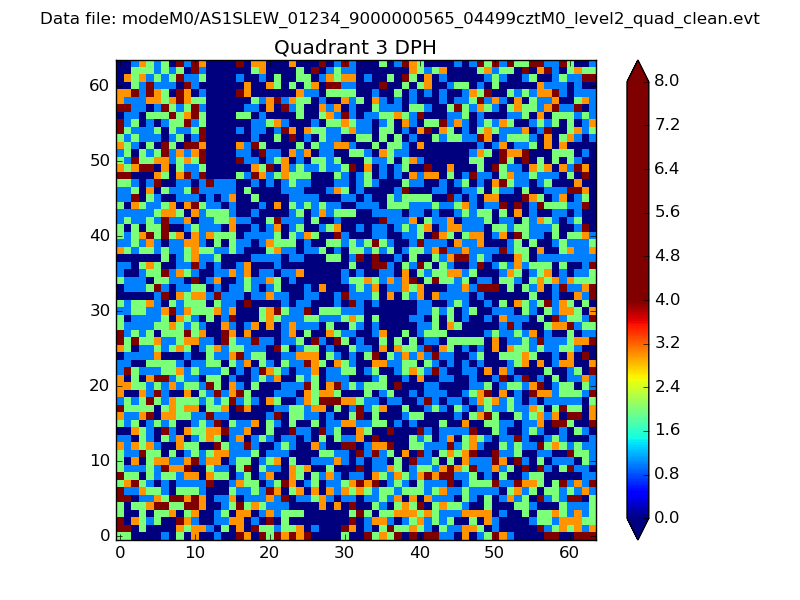 |
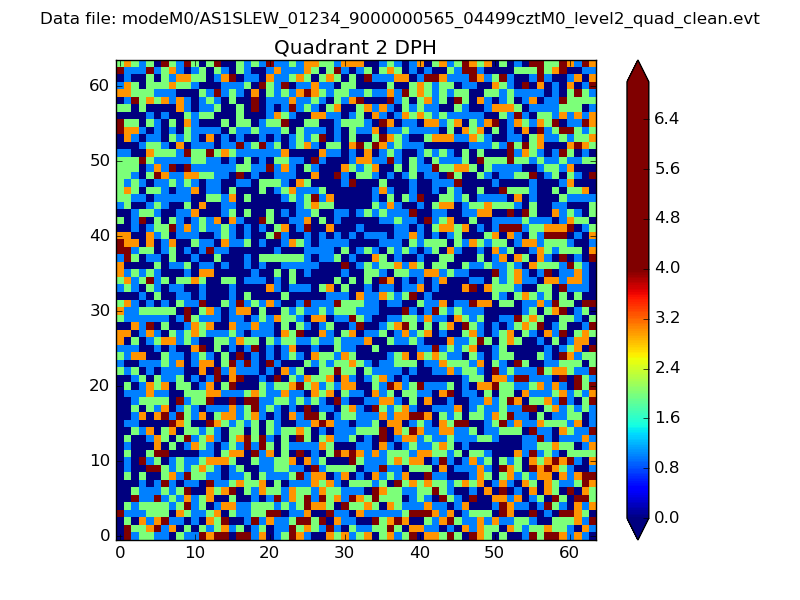 |
Quadrant C |
| Plot type | Count rate plots | Images |
|---|---|---|
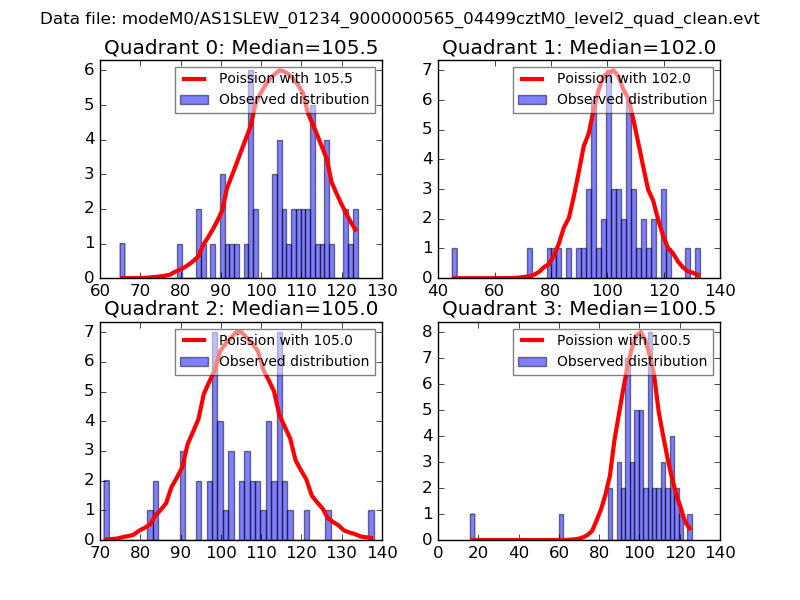
| Comparison with Poisson distribution Blue bars denote a histogram of data divided into 1 sec bins. Red curve is a Poisson curve with rate = median count rate of data. |
 |
 |
| Quadrant-wise count rates Data is divided into 100 sec bins |
 |
|
| Module-wise count rates for Quadrant A Data is divided into 100 sec bins |
 |
 |
| Module-wise count rates for Quadrant B Data is divided into 100 sec bins |
 |
 |
| Module-wise count rates for Quadrant C Data is divided into 100 sec bins |
 |
 |
| Module-wise count rates for Quadrant D Data is divided into 100 sec bins |
 |
 |
| Parameter | Plot |
|---|---|
| CZT HV Monitor | 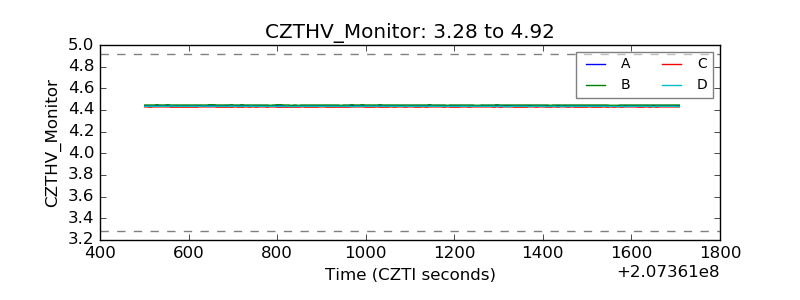 |
| D_VDD | 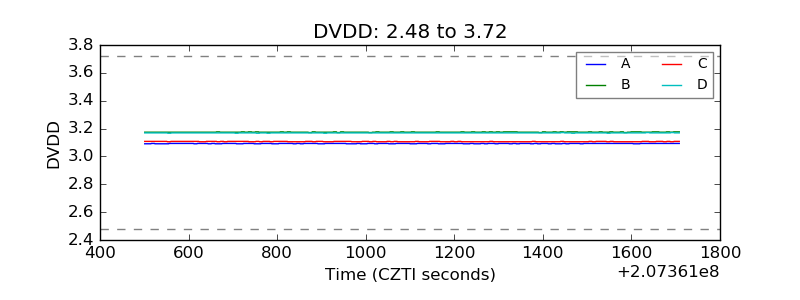 |
| Temperature 1 | 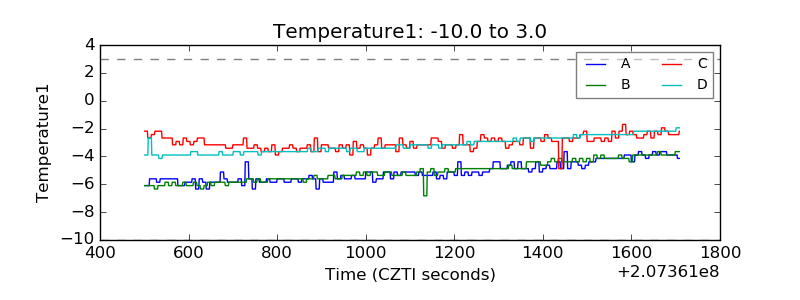 |
| Veto HV Monitor | 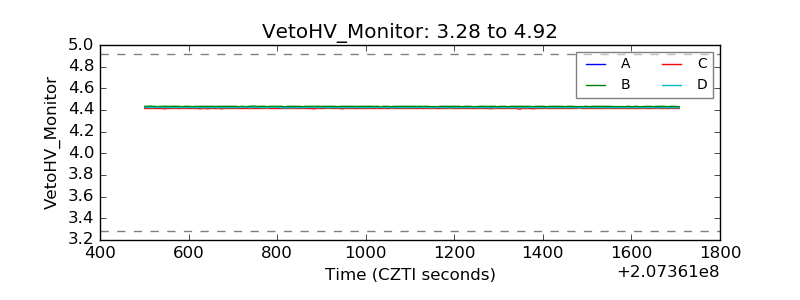 |
| Veto LLD | 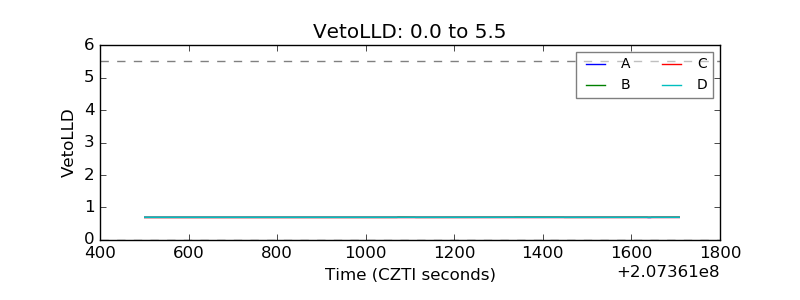 |
| Alpha Counter | 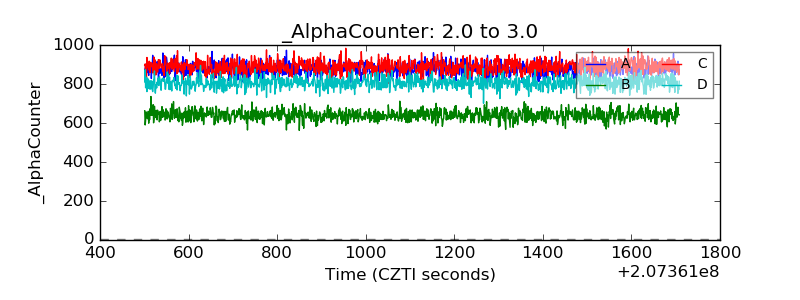 |
| _CPM_Rate | 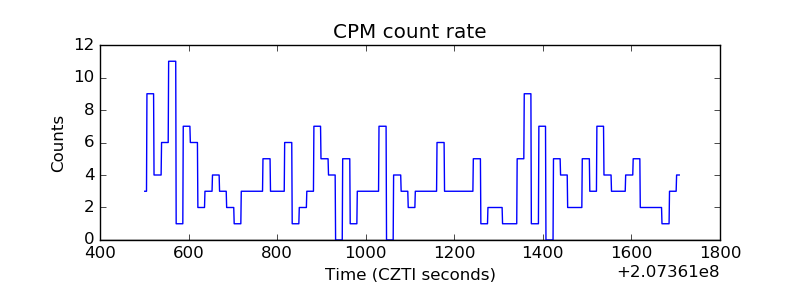 |
| CZT Counter | 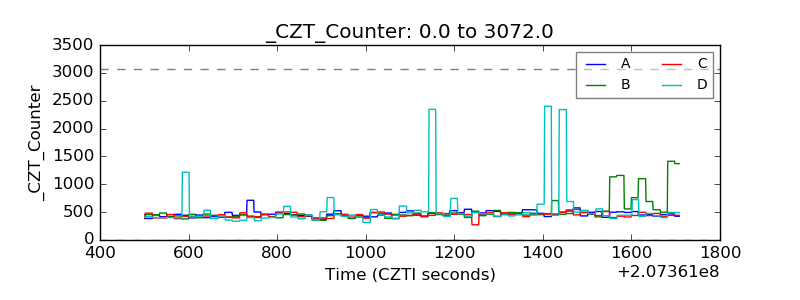 |
| +2.5 Volts monitor |  |
| +5 Volts monitor |  |
| _ROLL_ROT | 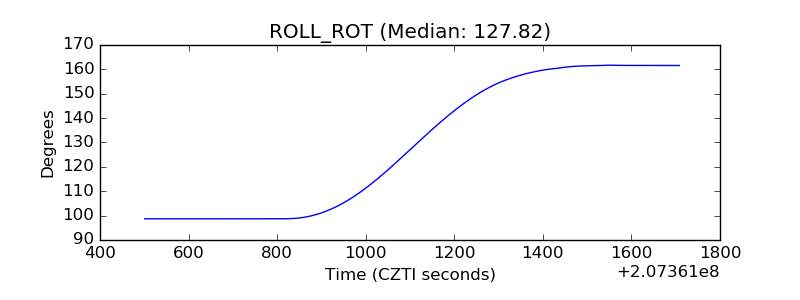 |
| _Roll_DEC | 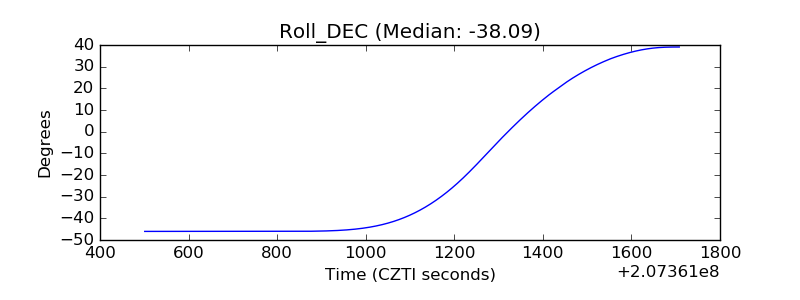 |
| _Roll_RA | 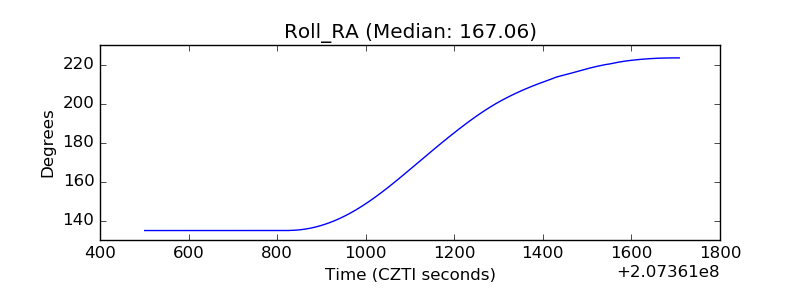 |
| Veto Counter | 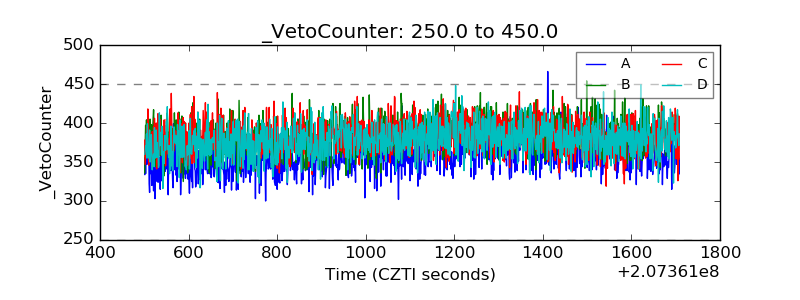 |