| Param | Original file | Final file |
|---|---|---|
| Filename | modeM0/AS1SLEW_01234_9000000567_04514cztM0_level2.evt | modeM0/AS1SLEW_01234_9000000567_04514cztM0_level2_quad_clean.evt |
| Size (bytes) | 33,514,560 | 1,874,880 |
| Size | 32.0 MB | 1.8 MB |
| Events in quadrant A | 270,000 | 1,988 |
| Events in quadrant B | 248,234 | 1,945 |
| Events in quadrant C | 216,660 | 2,093 |
| Events in quadrant D | 237,401 | 2,123 |
| Mode SS | |||
|---|---|---|---|
| Quadrant | BADHDUFLAG | Total packets | Discarded packets |
| A | 0 | 12 | 0 |
| B | 0 | 12 | 0 |
| C | 0 | 12 | 0 |
| D | 0 | 12 | 0 |
| Mode M0 | |||
|---|---|---|---|
| Quadrant | BADHDUFLAG | Total packets | Discarded packets |
| A | 0 | 1262 | 0 |
| B | 0 | 1196 | 0 |
| C | 0 | 1144 | 0 |
| D | 0 | 1181 | 0 |
| Quadrant | Total seconds | Saturated seconds | Saturation percentage |
|---|---|---|---|
| A | 572 | 3 | 0.524476% |
| B | 572 | 3 | 0.524476% |
| C | 572 | 0 | 0.000000% |
| D | 572 | 0 | 0.000000% |
Noise dominated data is calculated using 1-second bins in cleaned event files. If a bin has >2000 counts, and if more than 50% of those come from <1% of pixels, then it is considered to be noise-dominated and hence unusable.
| Quadrant | # 1 sec bins | Bins with >0 counts | Bins with >2000 counts | High rate bins dominated by noise | Noise dominated (total time) | Noise dominated (detector-on time) | Marked lightcurve |
|---|---|---|---|---|---|---|---|
| A | 572 | 572 | 3 | 3 | 0.52% | 0.52% | 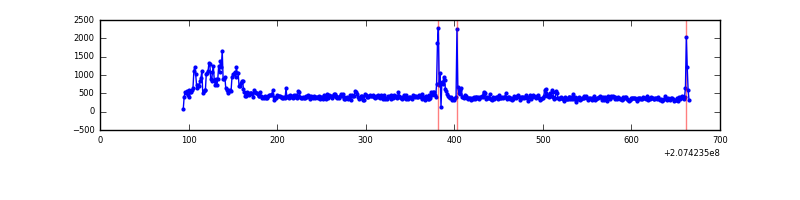 |
| B | 572 | 572 | 5 | 5 | 0.87% | 0.87% | 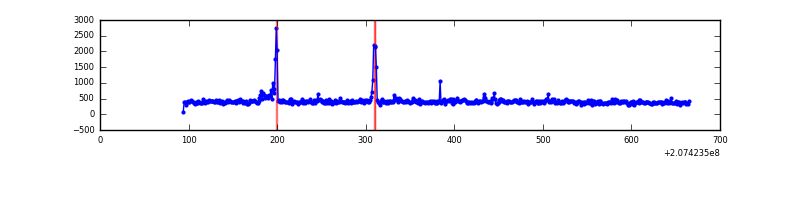 |
| C | 572 | 572 | 0 | 0 | 0.00% | 0.00% | 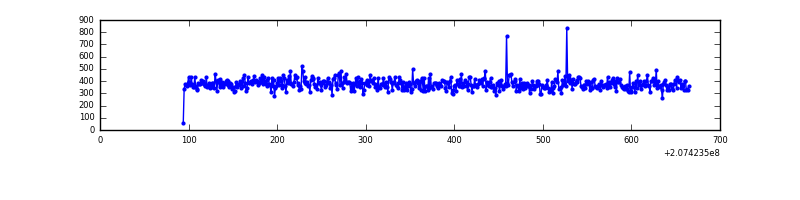 |
| D | 572 | 572 | 0 | 0 | 0.00% | 0.00% | 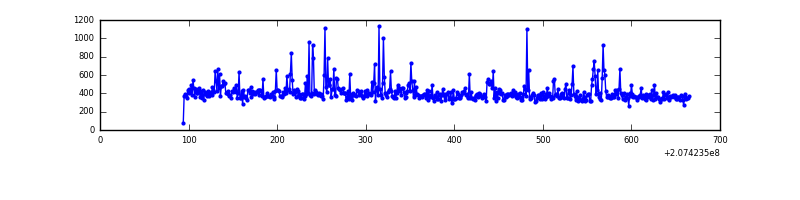 |
Top three noisy pixels from each quadrant. If the there are fewer than three noisy pixels in the level2.evt file, extra rows are filled as -1
| Pixel properties | Quadrant properties | ||||||
|---|---|---|---|---|---|---|---|
| Quadrant | DetID | PixID | Counts | Sigma | Mean | Median | Sigma |
| A | 0 | 118 | 41263 | 3034.51 | 55 | 54 | 13.6 |
| A | 0 | 50 | 6880 | 502.65 | 55 | 54 | 13.6 |
| A | 0 | 226 | 4617 | 336.01 | 55 | 54 | 13.6 |
| B | 5 | 70 | 17160 | 1304.54 | 56 | 54 | 13.1 |
| B | 15 | 204 | 7625 | 577.38 | 56 | 54 | 13.1 |
| B | 14 | 1 | 3614 | 271.49 | 56 | 54 | 13.1 |
| C | 9 | 16 | 838 | 53.13 | 54 | 54 | 14.8 |
| C | 9 | 54 | 519 | 31.51 | 54 | 54 | 14.8 |
| C | 13 | 61 | 467 | 27.99 | 54 | 54 | 14.8 |
| D | 11 | 132 | 7566 | 476.58 | 53 | 51 | 15.8 |
| D | 13 | 53 | 7458 | 469.74 | 53 | 51 | 15.8 |
| D | 14 | 34 | 7298 | 459.59 | 53 | 51 | 15.8 |
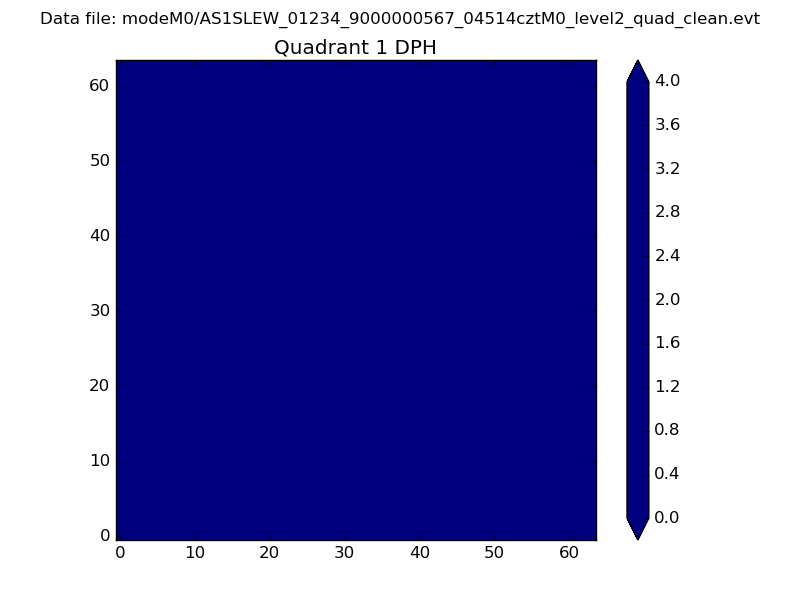
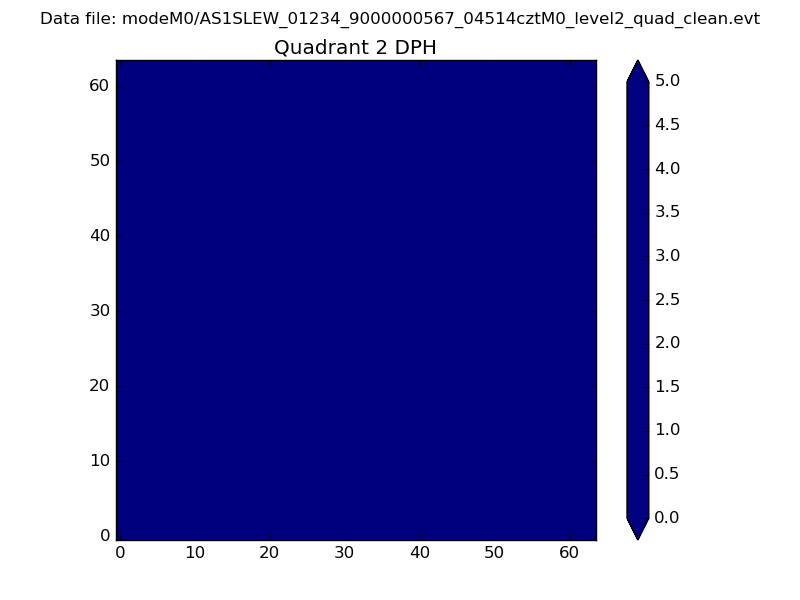
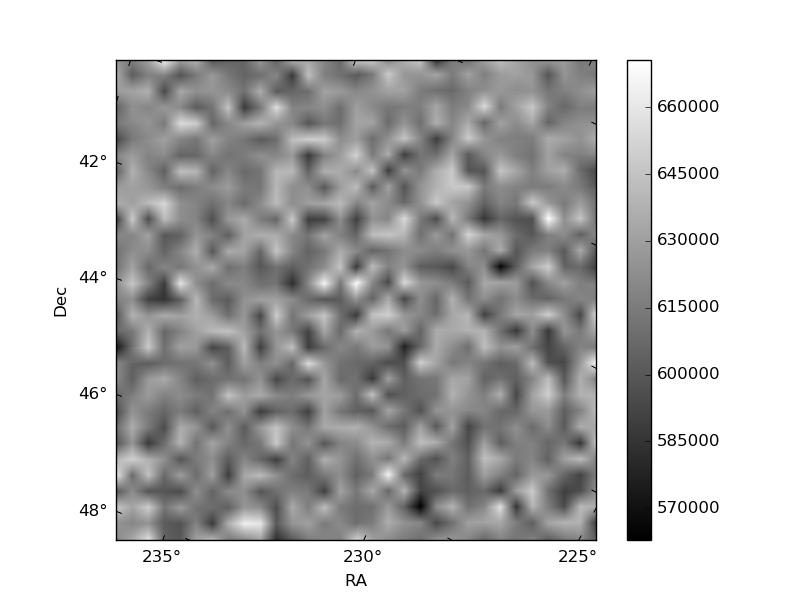
Histogram calculated using DETX and DETY for each event in the final _common_clean file
| Quadrant A |  |
 |
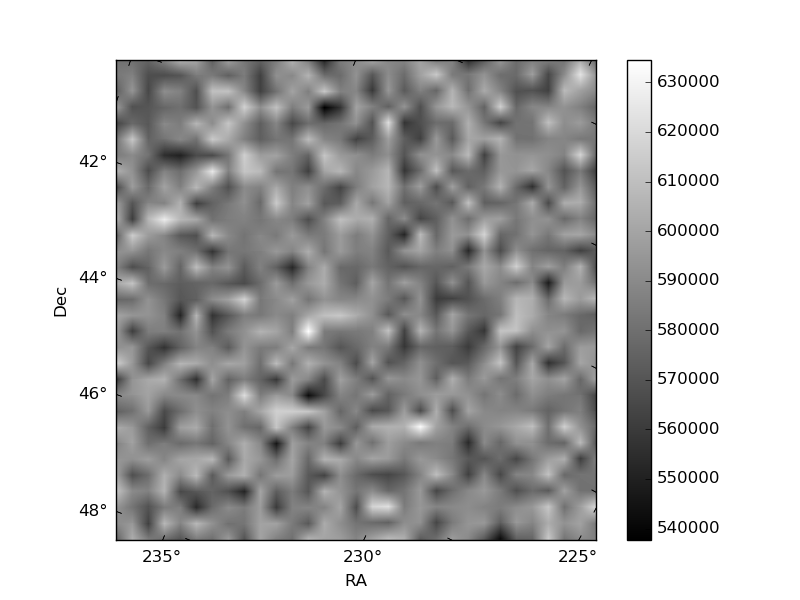
Quadrant B |
|---|---|---|---|
| Quadrant D |  |
 |
Quadrant C |
| Plot type | Count rate plots | Images |
|---|---|---|
| Comparison with Poisson distribution Blue bars denote a histogram of data divided into 1 sec bins. Red curve is a Poisson curve with rate = median count rate of data. |
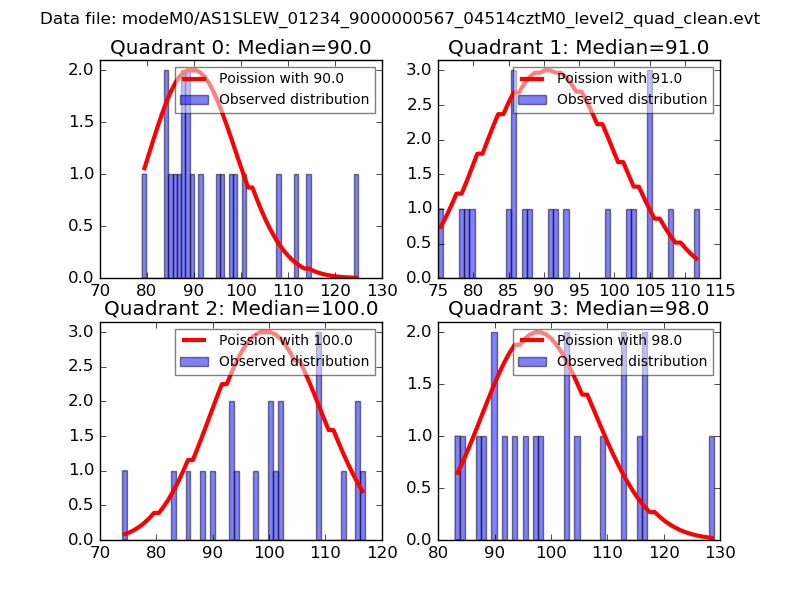 |
 |
| Quadrant-wise count rates Data is divided into 100 sec bins |
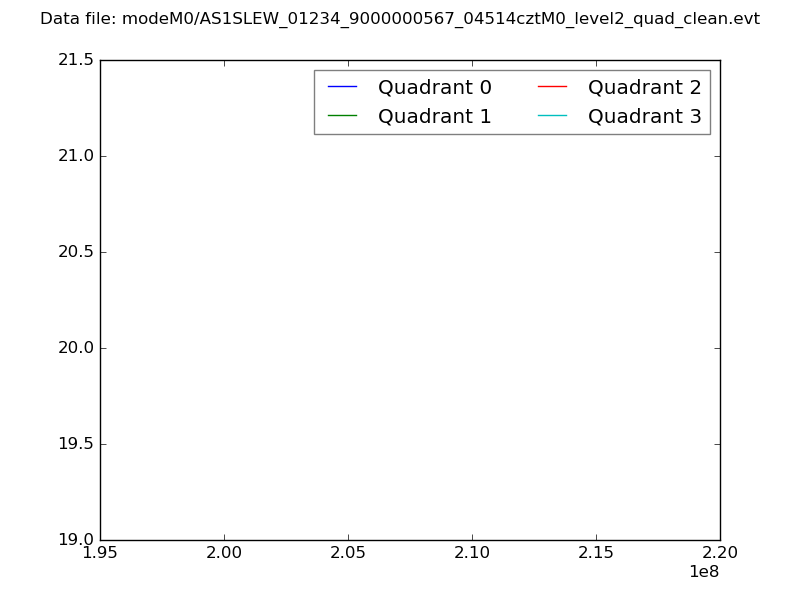 |
|
| Module-wise count rates for Quadrant A Data is divided into 100 sec bins |
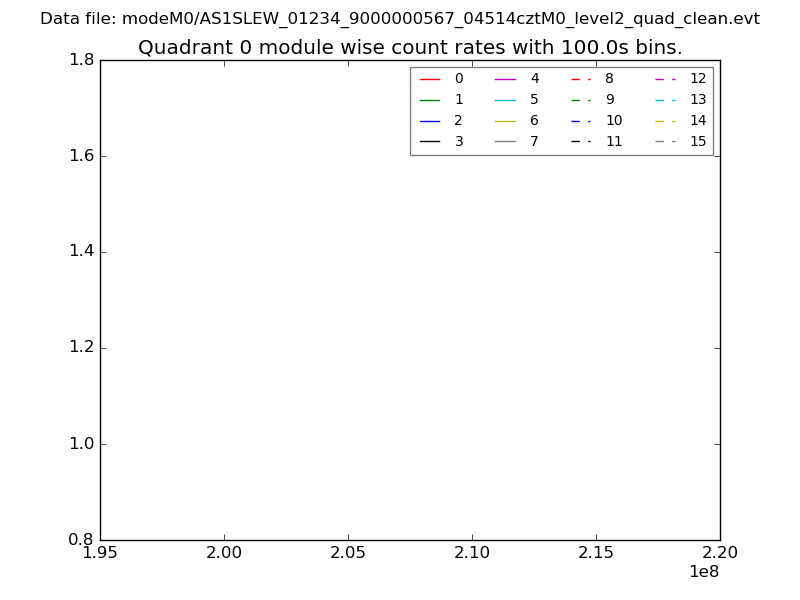 |
 |
| Module-wise count rates for Quadrant B Data is divided into 100 sec bins |
 |
 |
| Module-wise count rates for Quadrant C Data is divided into 100 sec bins |
 |
 |
| Module-wise count rates for Quadrant D Data is divided into 100 sec bins |
 |
 |
| Parameter | Plot |
|---|---|
| CZT HV Monitor | 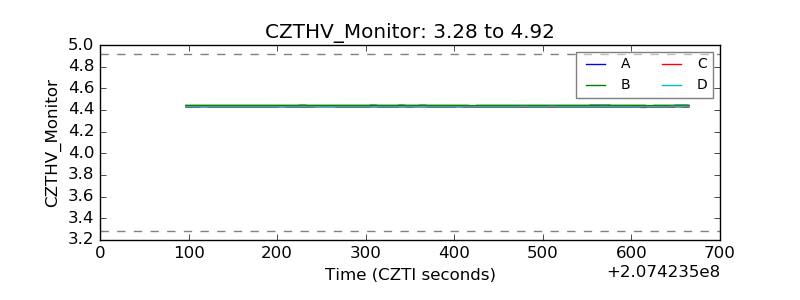 |
| D_VDD | 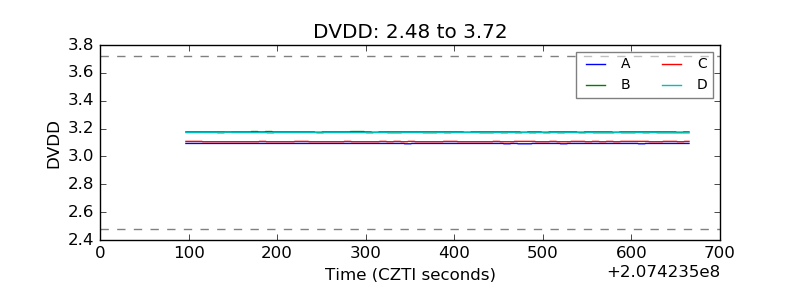 |
| Temperature 1 | 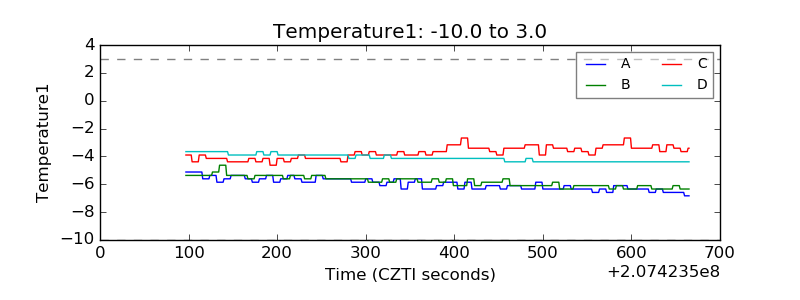 |
| Veto HV Monitor | 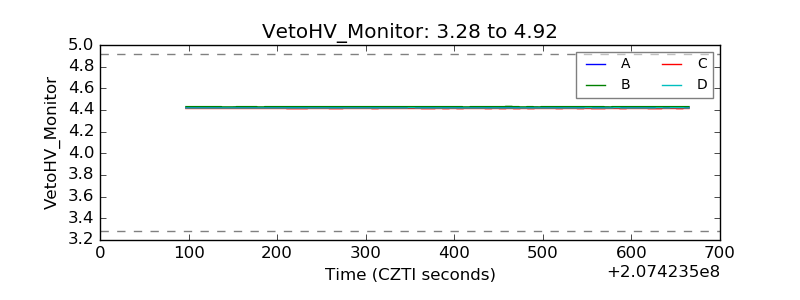 |
| Veto LLD | 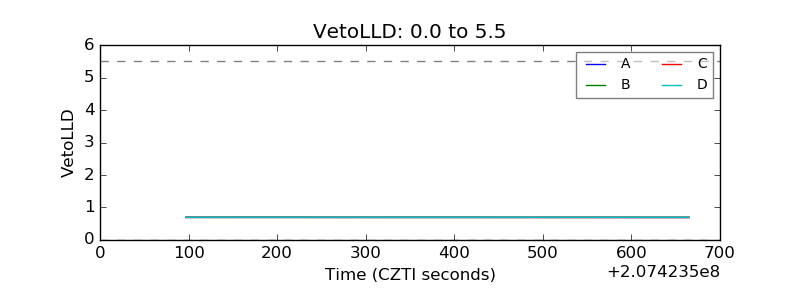 |
| Alpha Counter | 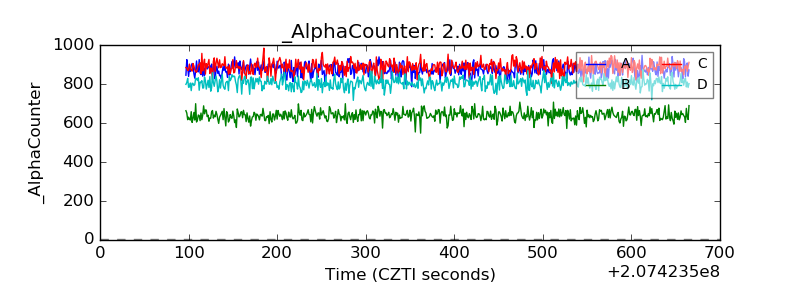 |
| _CPM_Rate |  |
| CZT Counter | 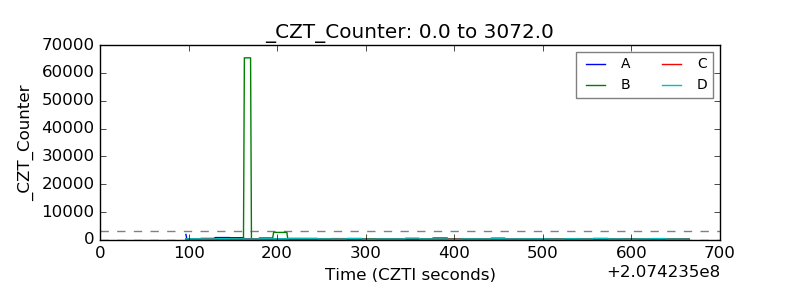 |
| +2.5 Volts monitor |  |
| +5 Volts monitor | 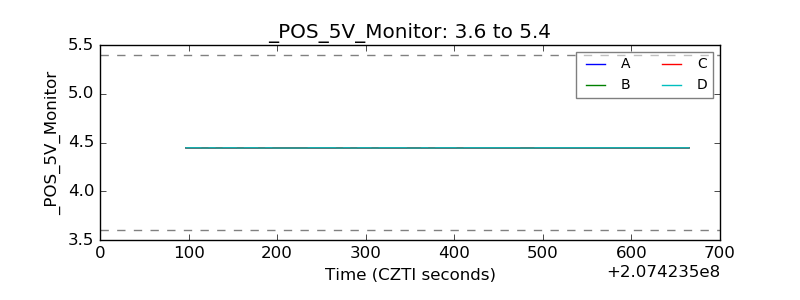 |
| _ROLL_ROT | 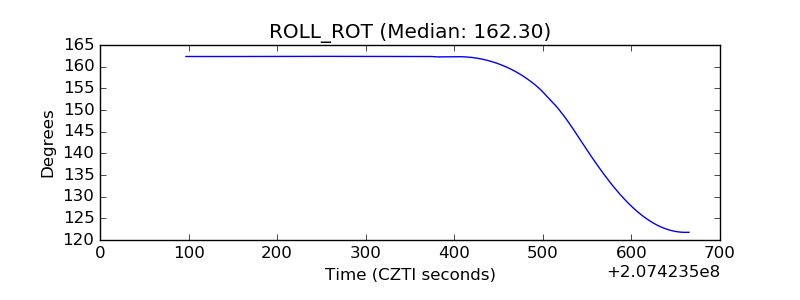 |
| _Roll_DEC | 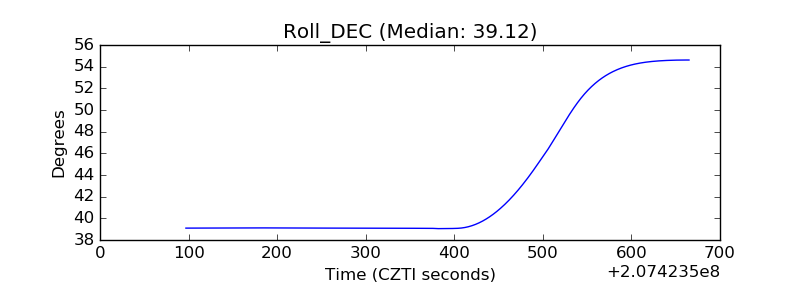 |
| _Roll_RA | 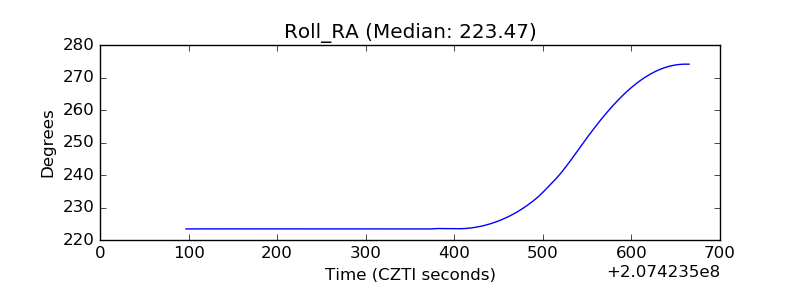 |
| Veto Counter | 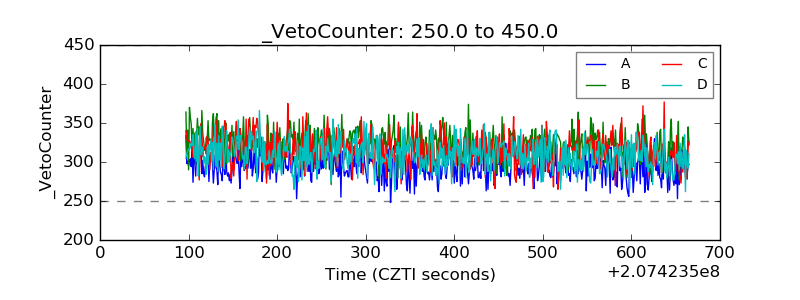 |