| Param | Original file | Final file |
|---|---|---|
| Filename | modeM0/AS1G05_233T10_9000000570cztM0_level2.fits | modeM0/AS1G05_233T10_9000000570cztM0_level2_quad_clean.evt |
| Size (bytes) | 2,712,130,560 | 2,145,401,280 |
| Size | 2.5 GB | 2.0 GB |
| Events in quadrant A | 10,316,358 | 11,126,329 |
| Events in quadrant B | 20,817,894 | 14,233,664 |
| Events in quadrant C | 20,059,258 | 13,851,833 |
| Events in quadrant D | 18,263,886 | 13,086,006 |
| Mode M9 | |||
|---|---|---|---|
| Quadrant | BADHDUFLAG | Total packets | Discarded packets |
| A | 0 | 318 | 0 |
| B | 0 | 321 | 0 |
| C | 0 | 318 | 0 |
| D | 0 | 323 | 0 |
| Mode M0 | |||
|---|---|---|---|
| Quadrant | BADHDUFLAG | Total packets | Discarded packets |
| A | 0 | 474751 | 0 |
| B | 0 | 425419 | 0 |
| C | 0 | 417610 | 0 |
| D | 0 | 496161 | 0 |
| Mode SS | |||
|---|---|---|---|
| Quadrant | BADHDUFLAG | Total packets | Discarded packets |
| A | 0 | 3878 | 0 |
| B | 0 | 3930 | 0 |
| C | 0 | 3941 | 0 |
| D | 0 | 3881 | 0 |
| Quadrant | Total seconds | Saturated seconds | Saturation percentage |
|---|---|---|---|
| A | 189927 | 12597 | 6.632548% |
| B | 189454 | 4179 | 2.205812% |
| C | 189718 | 3712 | 1.956588% |
| D | 189809 | 10925 | 5.755786% |
Noise dominated data is calculated using 1-second bins in cleaned event files. If a bin has >2000 counts, and if more than 50% of those come from <1% of pixels, then it is considered to be noise-dominated and hence unusable.
| Quadrant | # 1 sec bins | Bins with >0 counts | Bins with >2000 counts | High rate bins dominated by noise | Noise dominated (total time) | Noise dominated (detector-on time) | Marked lightcurve |
|---|---|---|---|---|---|---|---|
| A | 255609 | 190348 | 0 | 0 | 0.00% | 0.00% | 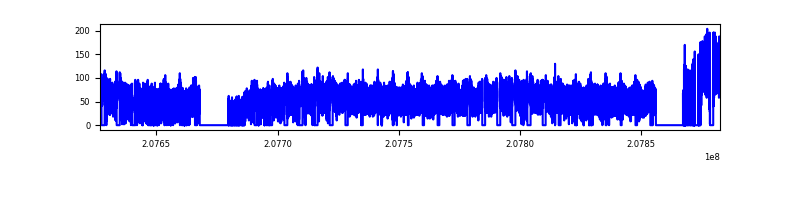 |
| B | 223777 | 178583 | 0 | 0 | 0.00% | 0.00% | 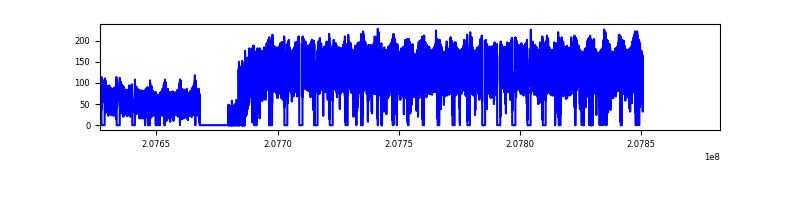 |
| C | 227742 | 181712 | 0 | 0 | 0.00% | 0.00% | 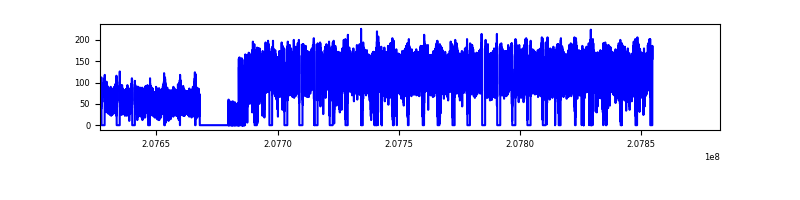 |
| D | 255609 | 190329 | 0 | 0 | 0.00% | 0.00% | 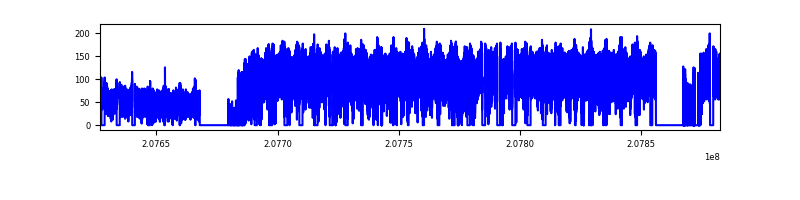 |
Top three noisy pixels from each quadrant. If the there are fewer than three noisy pixels in the level2.evt file, extra rows are filled as -1
| Pixel properties | Quadrant properties | ||||||
|---|---|---|---|---|---|---|---|
| Quadrant | DetID | PixID | Counts | Sigma | Mean | Median | Sigma |
| A | 0 | 29 | 8310 | 8.84 | 2698 | 2533 | 653.2 |
| A | 7 | 110 | 8273 | 8.79 | 2698 | 2533 | 653.2 |
| A | 0 | 30 | 7658 | 7.85 | 2698 | 2533 | 653.2 |
| B | 5 | 232 | 12018 | 5.81 | 5573 | 5354 | 1147.7 |
| B | 15 | 3 | 11330 | 5.21 | 5573 | 5354 | 1147.7 |
| B | -1 | -1 | -1 | -1.0 | 5573 | 5354 | 1147.7 |
| D | 6 | 60 | 11568 | 5.25 | 5289 | 4978 | 1255.0 |
| D | -1 | -1 | -1 | -1.0 | 5289 | 4978 | 1255.0 |
| D | -1 | -1 | -1 | -1.0 | 5289 | 4978 | 1255.0 |
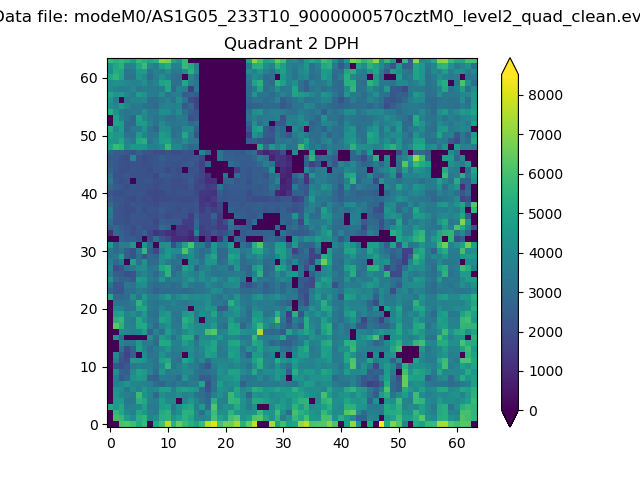
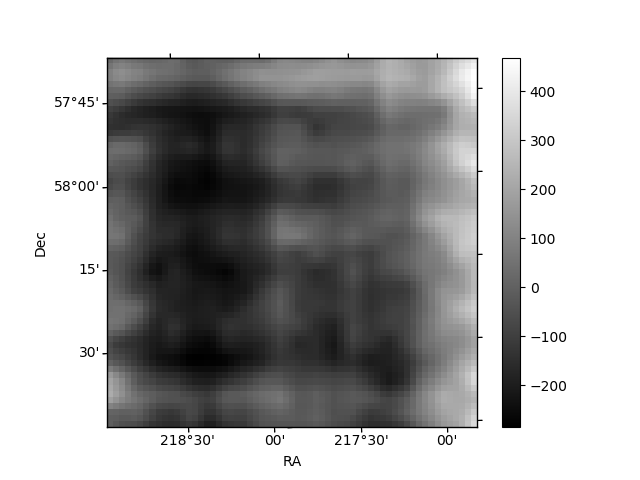
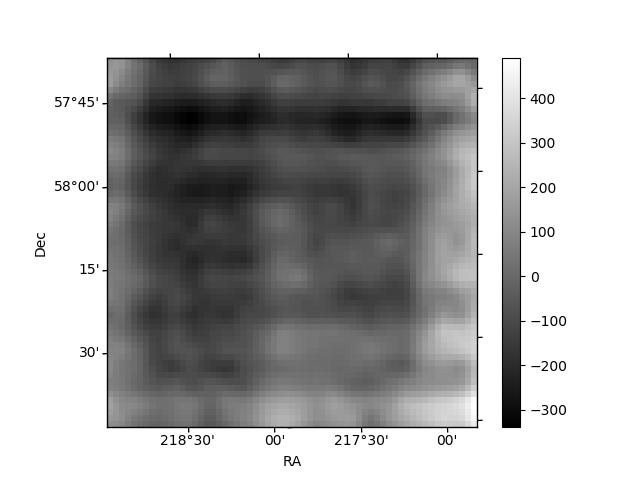
Histogram calculated using DETX and DETY for each event in the final _common_clean file
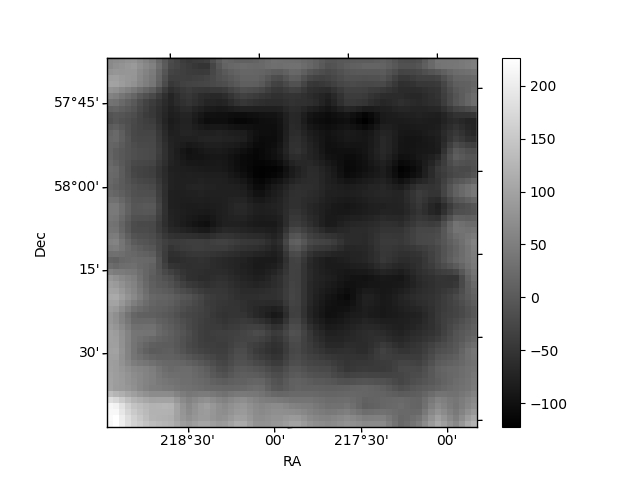
| Quadrant A | 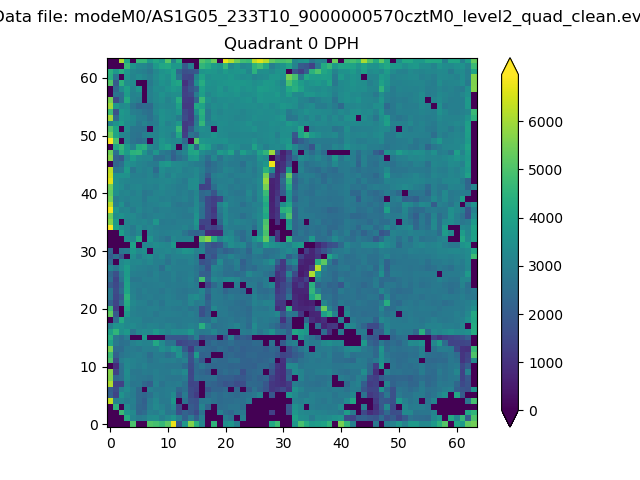 |
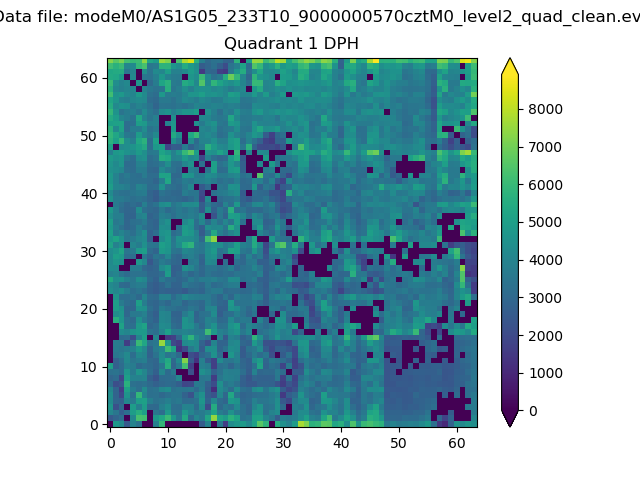 |
Quadrant B |
|---|---|---|---|
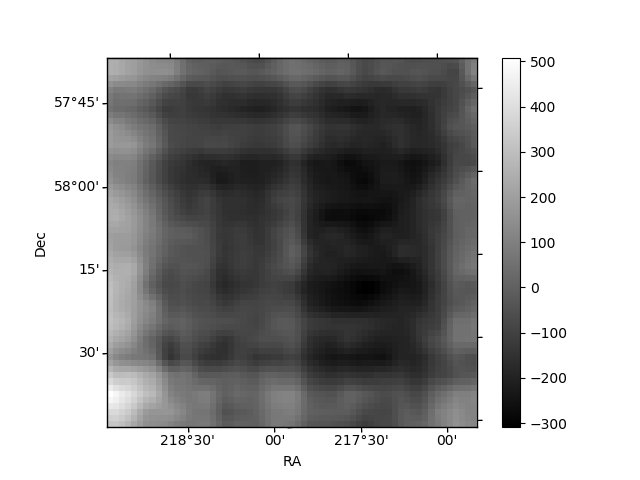
| Quadrant D | 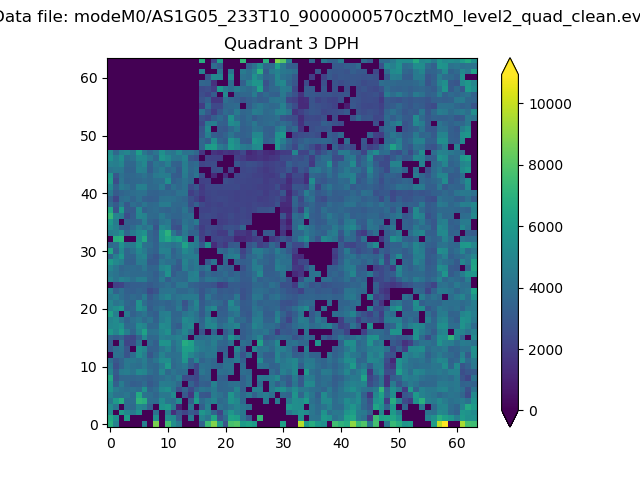 |
 |
Quadrant C |
| Plot type | Count rate plots | Images |
|---|---|---|
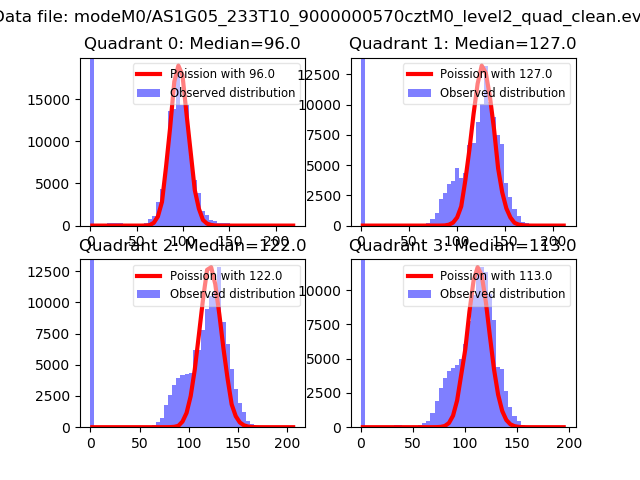
| Comparison with Poisson distribution Blue bars denote a histogram of data divided into 1 sec bins. Red curve is a Poisson curve with rate = median count rate of data. |
 |
 |
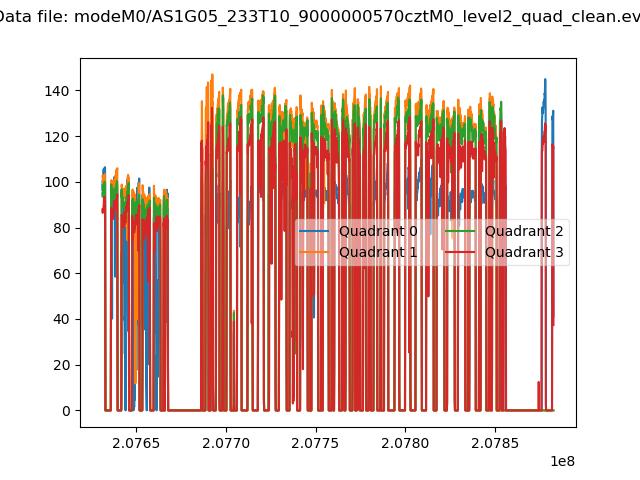
| Quadrant-wise count rates Data is divided into 100 sec bins |
 |
|
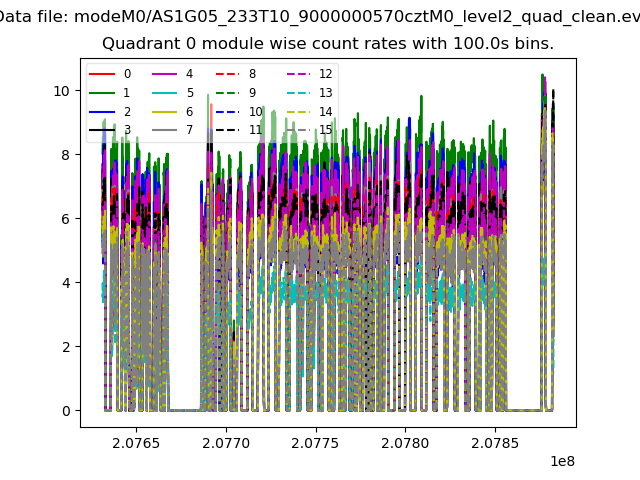
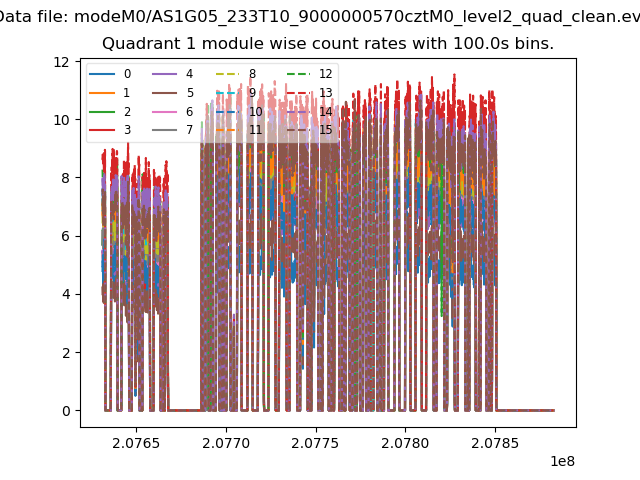
| Module-wise count rates for Quadrant A Data is divided into 100 sec bins |
 |
 |
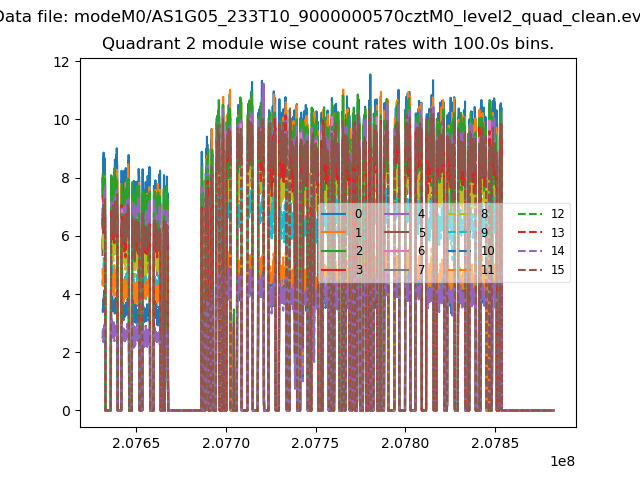
| Module-wise count rates for Quadrant B Data is divided into 100 sec bins |
 |
 |
| Module-wise count rates for Quadrant C Data is divided into 100 sec bins |
 |
 |
| Module-wise count rates for Quadrant D Data is divided into 100 sec bins |
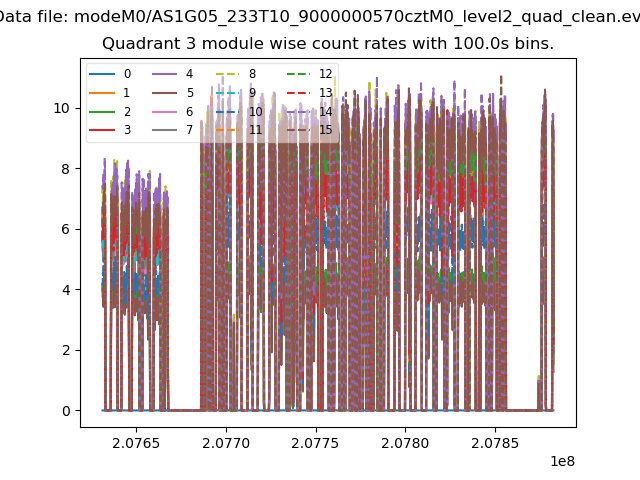 |
 |
| Parameter | Plot |
|---|---|
| CZT HV Monitor | 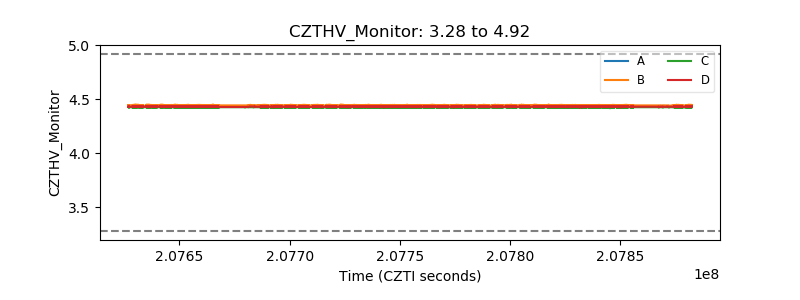 |
| D_VDD | 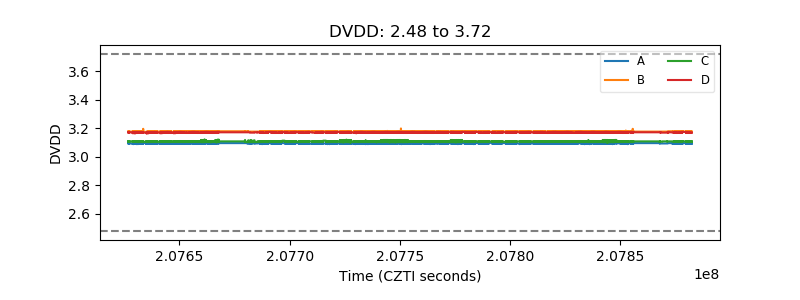 |
| Temperature 1 | 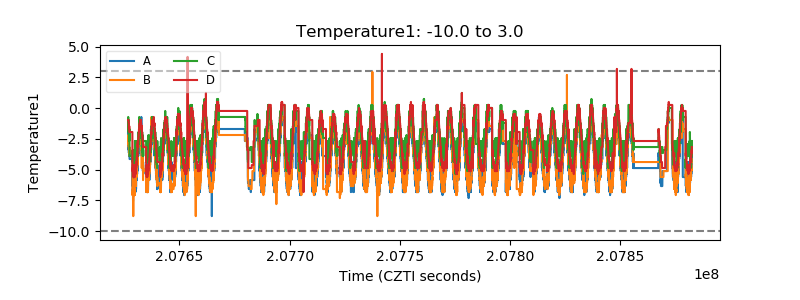 |
| Veto HV Monitor | 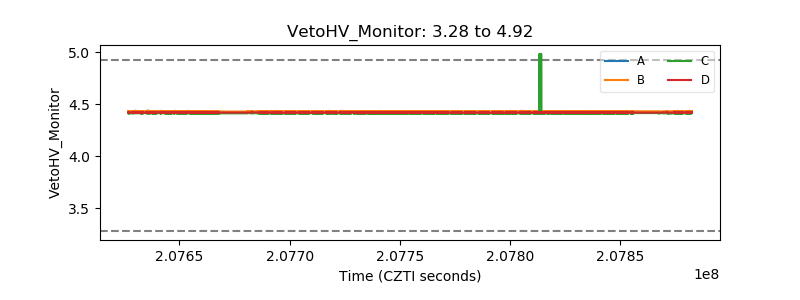 |
| Veto LLD | 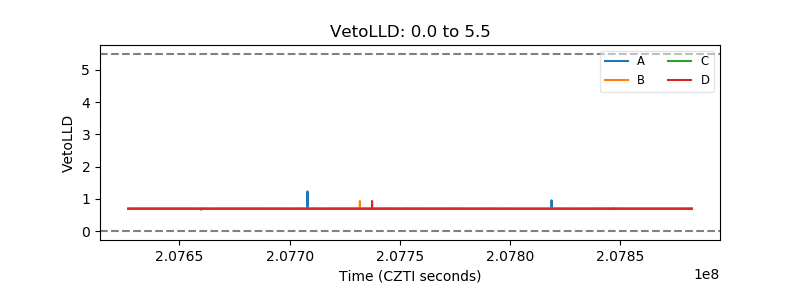 |
| Alpha Counter | 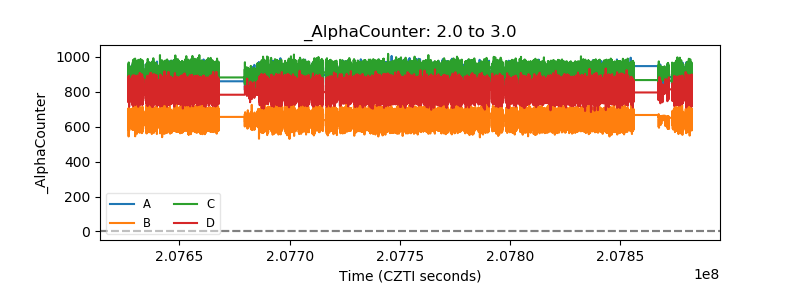 |
| _CPM_Rate | 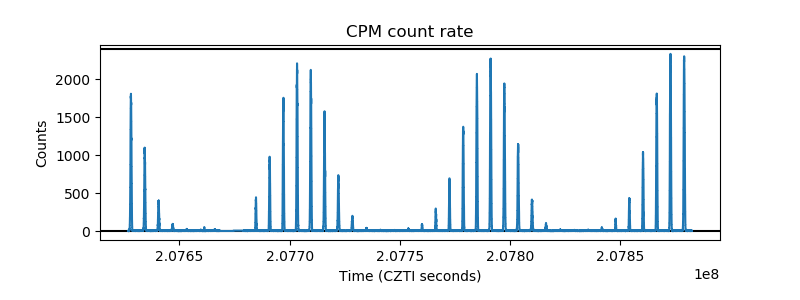 |
| CZT Counter | 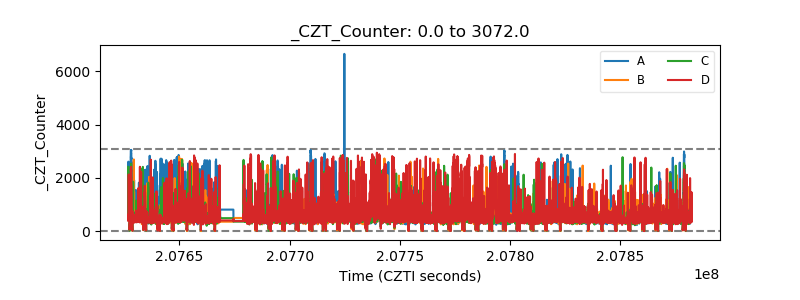 |
| +2.5 Volts monitor | 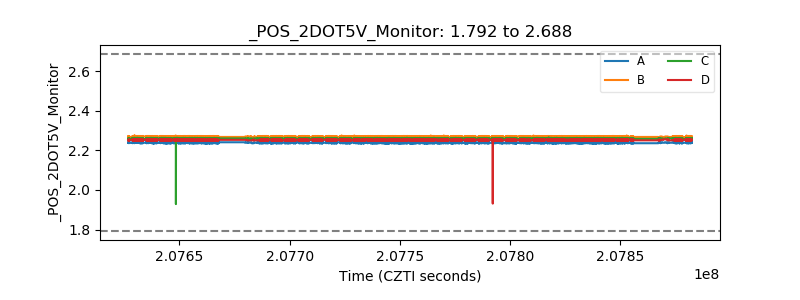 |
| +5 Volts monitor | 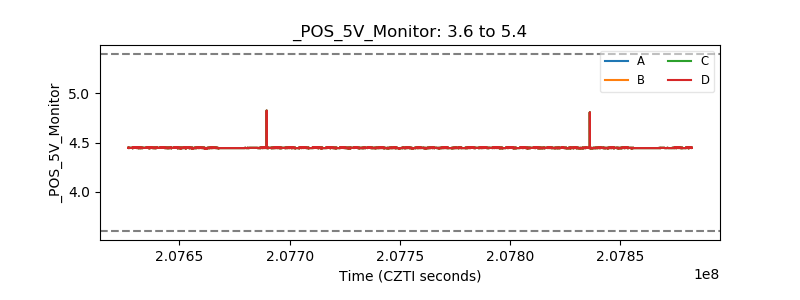 |
| _ROLL_ROT | 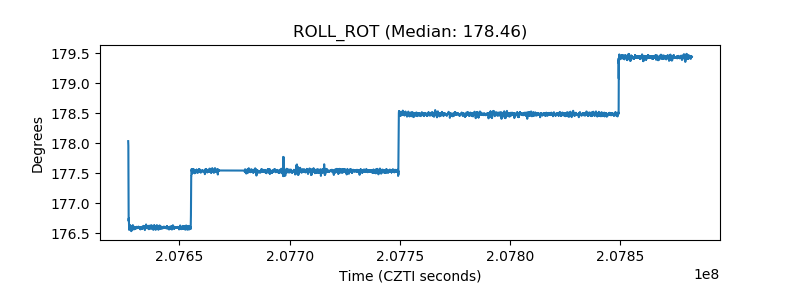 |
| _Roll_DEC | 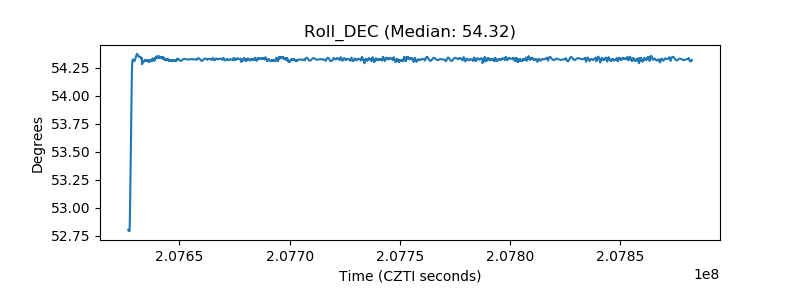 |
| _Roll_RA | 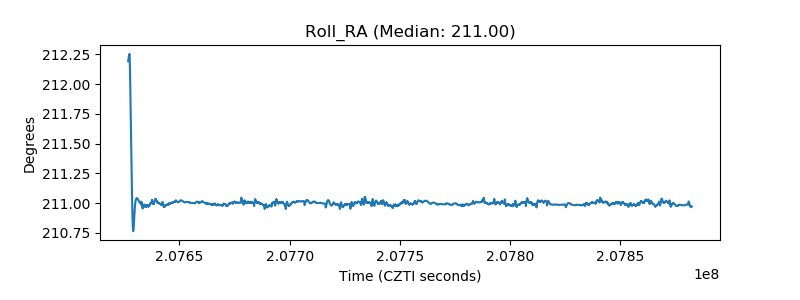 |
| Veto Counter | 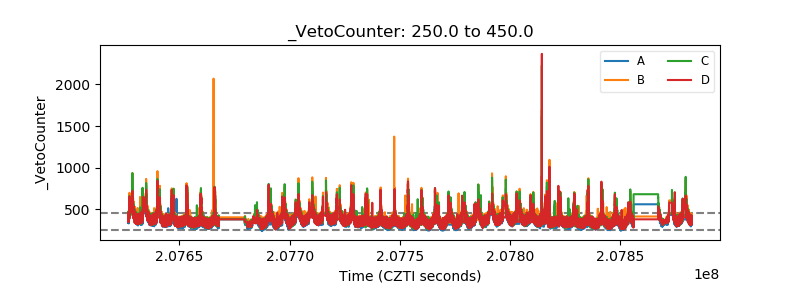 |