| Param | Original file | Final file |
|---|---|---|
| Filename | modeM0/AS1G05_233T10_9000000570_04544cztM0_level2.evt | modeM0/AS1G05_233T10_9000000570_04544cztM0_level2_quad_clean.evt |
| Size (bytes) | 174,291,840 | 11,436,480 |
| Size | 166.2 MB | 10.9 MB |
| Events in quadrant A | 1,596,240 | 47,204 |
| Events in quadrant B | 1,180,496 | 48,207 |
| Events in quadrant C | 1,290,330 | 47,051 |
| Events in quadrant D | 1,062,446 | 46,713 |
| Mode M9 | |||
|---|---|---|---|
| Quadrant | BADHDUFLAG | Total packets | Discarded packets |
| A | 0 | 13 | 0 |
| B | 0 | 13 | 0 |
| C | 0 | 13 | 0 |
| D | 0 | 13 | 0 |
| Mode M0 | |||
|---|---|---|---|
| Quadrant | BADHDUFLAG | Total packets | Discarded packets |
| A | 0 | 6189 | 2 |
| B | 0 | 4832 | 1 |
| C | 0 | 5261 | 1 |
| D | 0 | 4634 | 1 |
| Mode SS | |||
|---|---|---|---|
| Quadrant | BADHDUFLAG | Total packets | Discarded packets |
| A | 0 | 44 | 0 |
| B | 0 | 44 | 0 |
| C | 0 | 44 | 0 |
| D | 0 | 44 | 0 |
| Quadrant | Total seconds | Saturated seconds | Saturation percentage |
|---|---|---|---|
| A | 2162 | 124 | 5.735430% |
| B | 2162 | 62 | 2.867715% |
| C | 2162 | 67 | 3.098982% |
| D | 2162 | 10 | 0.462535% |
Noise dominated data is calculated using 1-second bins in cleaned event files. If a bin has >2000 counts, and if more than 50% of those come from <1% of pixels, then it is considered to be noise-dominated and hence unusable.
| Quadrant | # 1 sec bins | Bins with >0 counts | Bins with >2000 counts | High rate bins dominated by noise | Noise dominated (total time) | Noise dominated (detector-on time) | Marked lightcurve |
|---|---|---|---|---|---|---|---|
| A | 3477 | 2163 | 66 | 66 | 1.90% | 3.05% | 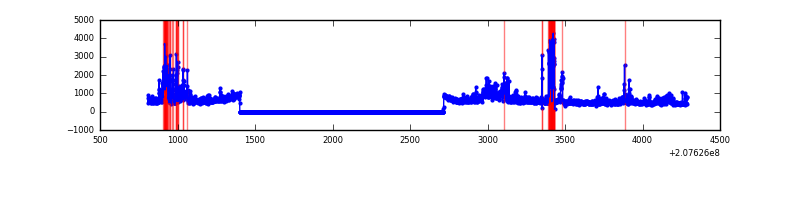 |
| B | 3477 | 2163 | 4 | 4 | 0.12% | 0.18% | 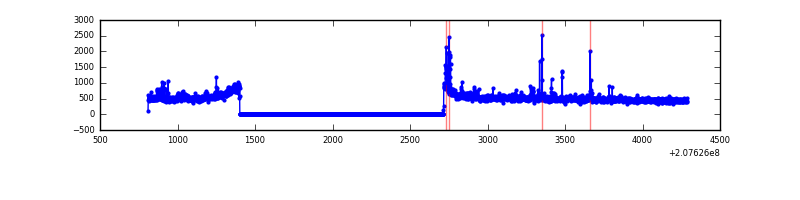 |
| C | 3477 | 2163 | 43 | 43 | 1.24% | 1.99% | 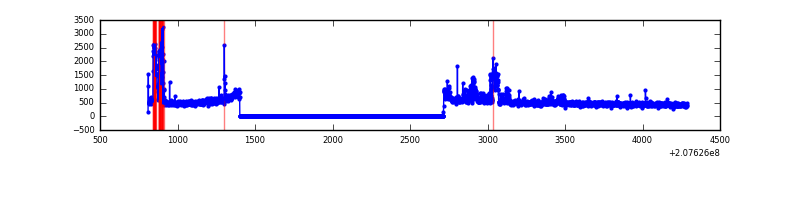 |
| D | 3477 | 2163 | 2 | 2 | 0.06% | 0.09% | 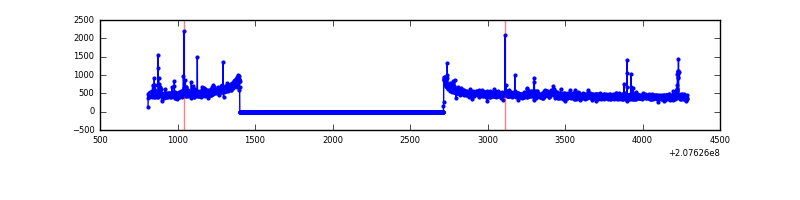 |
Top three noisy pixels from each quadrant. If the there are fewer than three noisy pixels in the level2.evt file, extra rows are filled as -1
| Pixel properties | Quadrant properties | ||||||
|---|---|---|---|---|---|---|---|
| Quadrant | DetID | PixID | Counts | Sigma | Mean | Median | Sigma |
| A | 0 | 13 | 525247 | 9069.81 | 274 | 267 | 57.9 |
| A | 13 | 14 | 5915 | 97.58 | 274 | 267 | 57.9 |
| A | 0 | 226 | 2948 | 46.32 | 274 | 267 | 57.9 |
| B | 4 | 80 | 45100 | 812.37 | 283 | 276 | 55.2 |
| B | 8 | 3 | 9429 | 165.88 | 283 | 276 | 55.2 |
| B | 12 | 18 | 6400 | 110.99 | 283 | 276 | 55.2 |
| C | 14 | 48 | 222448 | 3469.89 | 270 | 270 | 64.0 |
| C | 1 | 16 | 6247 | 93.35 | 270 | 270 | 64.0 |
| C | 9 | 247 | 5461 | 81.07 | 270 | 270 | 64.0 |
| D | 2 | 136 | 25747 | 356.08 | 265 | 258 | 71.6 |
| D | 13 | 235 | 13527 | 185.37 | 265 | 258 | 71.6 |
| D | 2 | 14 | 6673 | 89.61 | 265 | 258 | 71.6 |
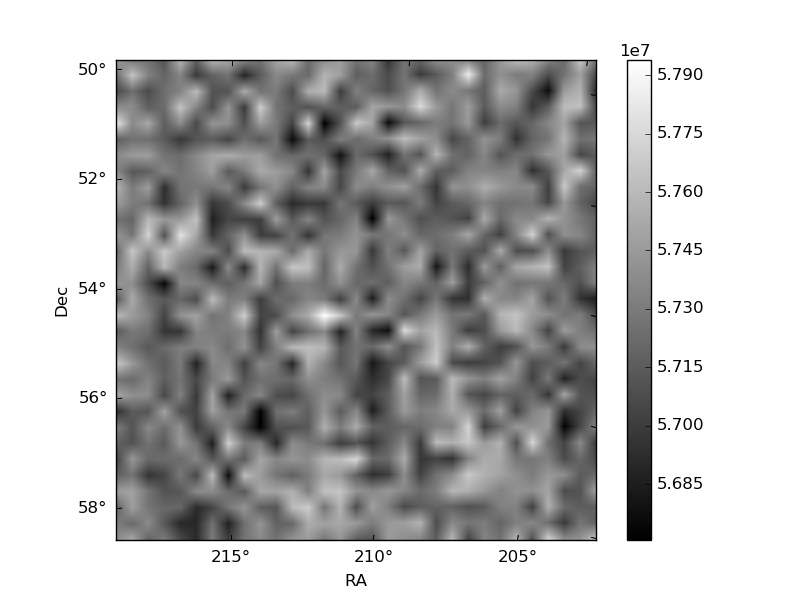
Histogram calculated using DETX and DETY for each event in the final _common_clean file
| Quadrant A | 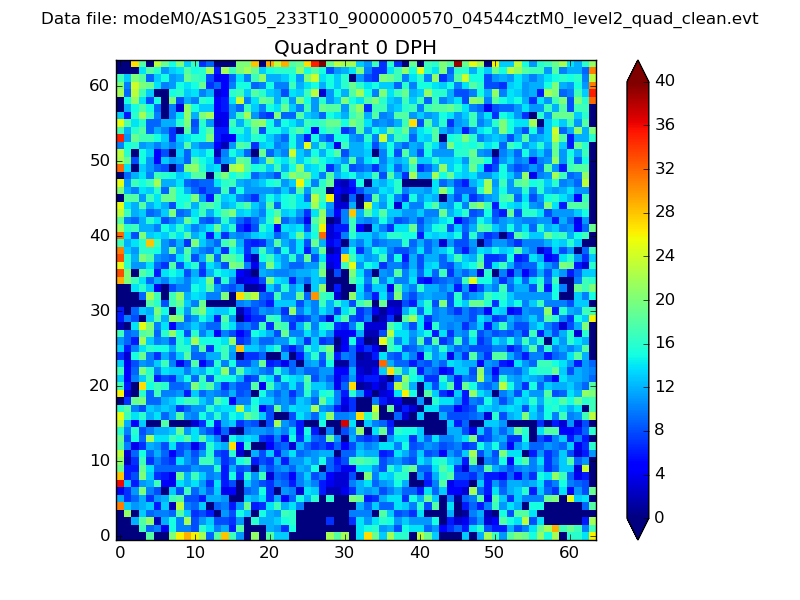 |
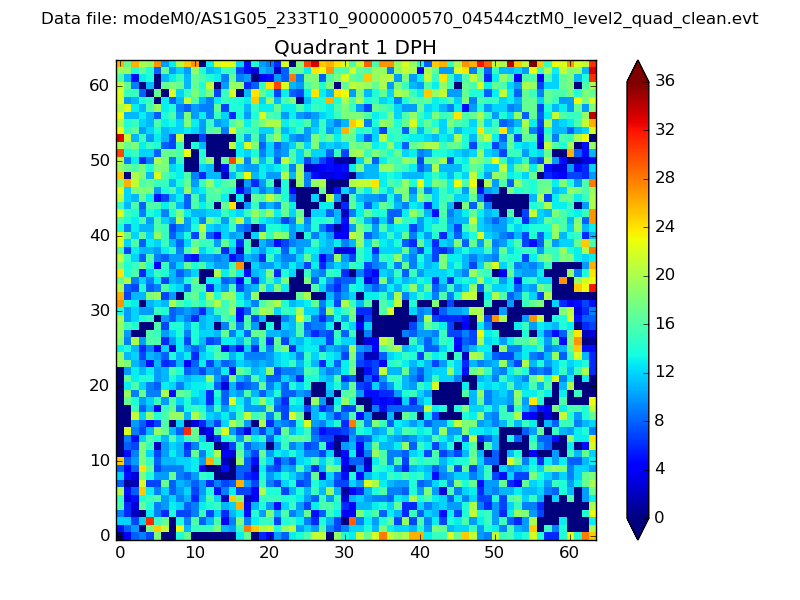 |
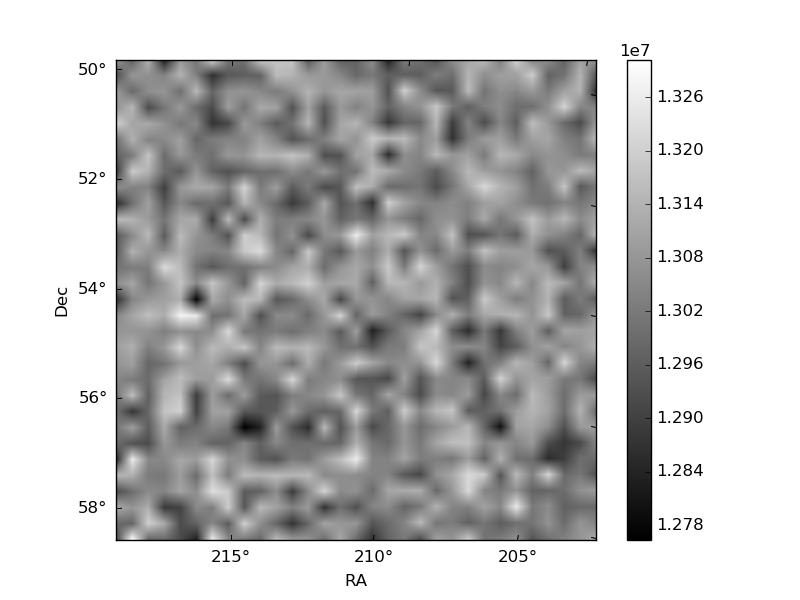
Quadrant B |
|---|---|---|---|
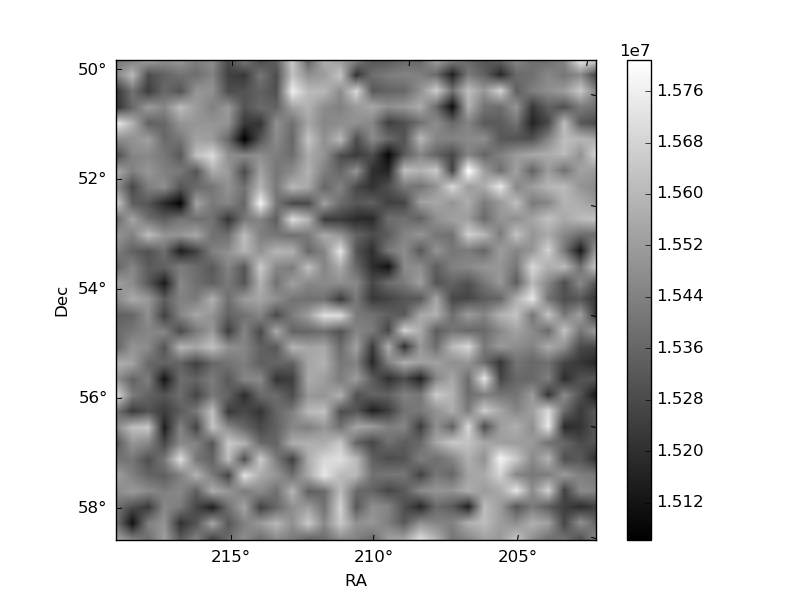
| Quadrant D | 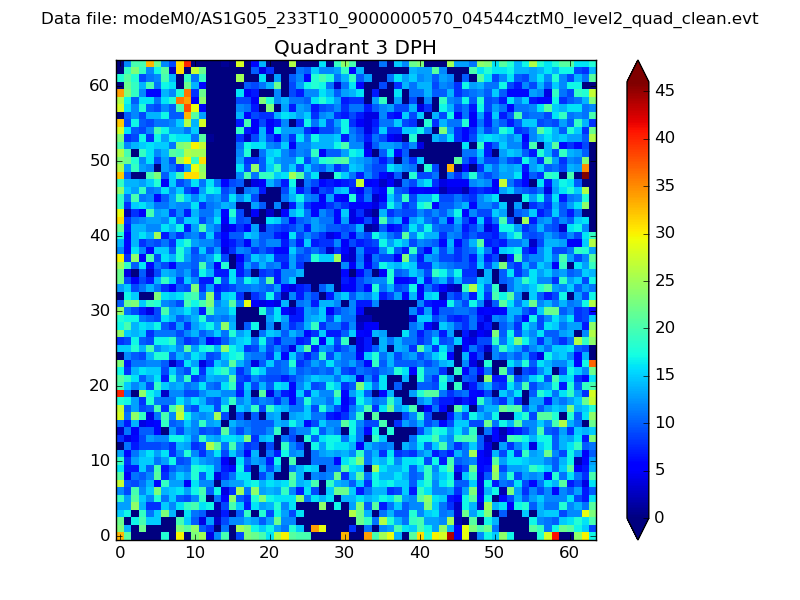 |
 |
Quadrant C |
| Plot type | Count rate plots | Images |
|---|---|---|
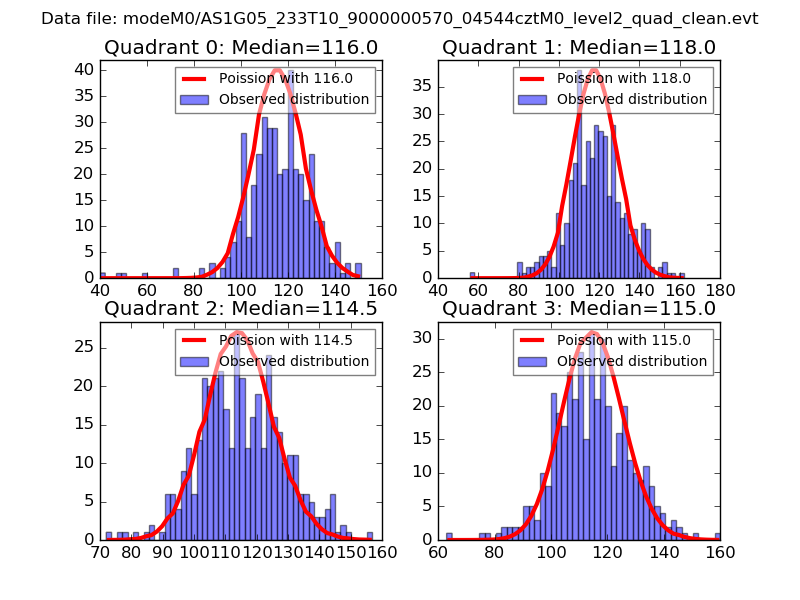
| Comparison with Poisson distribution Blue bars denote a histogram of data divided into 1 sec bins. Red curve is a Poisson curve with rate = median count rate of data. |
 |
 |
| Quadrant-wise count rates Data is divided into 100 sec bins |
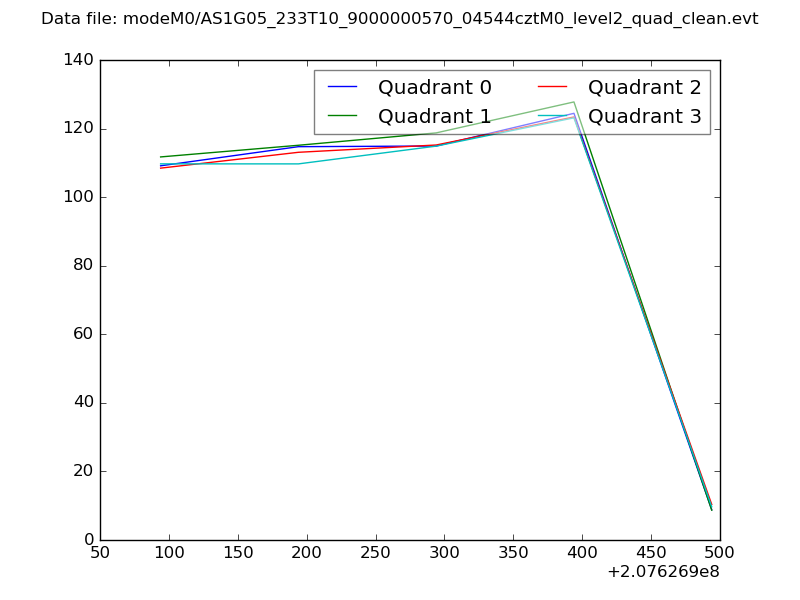 |
|
| Module-wise count rates for Quadrant A Data is divided into 100 sec bins |
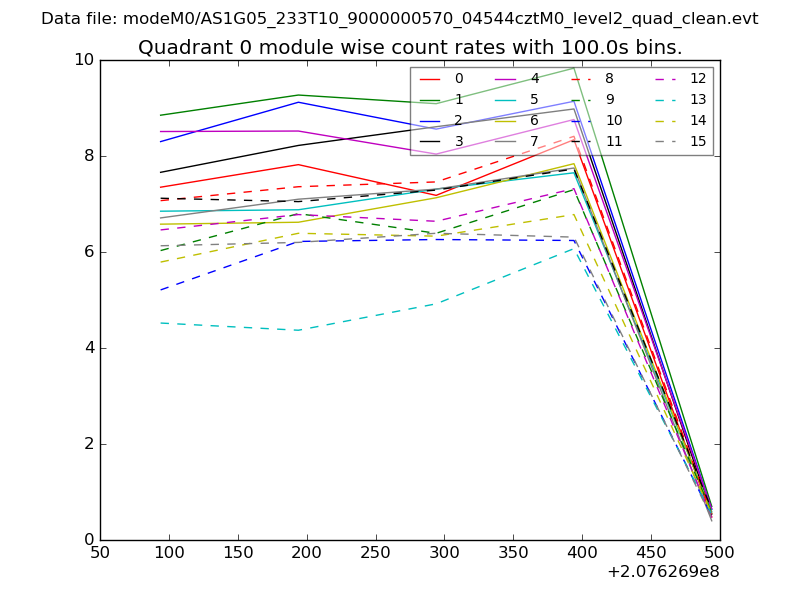 |
 |
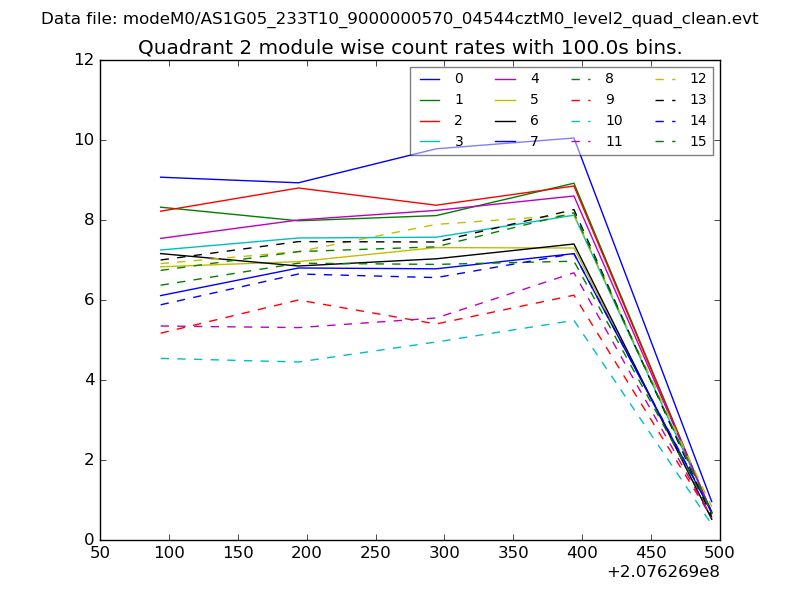
| Module-wise count rates for Quadrant B Data is divided into 100 sec bins |
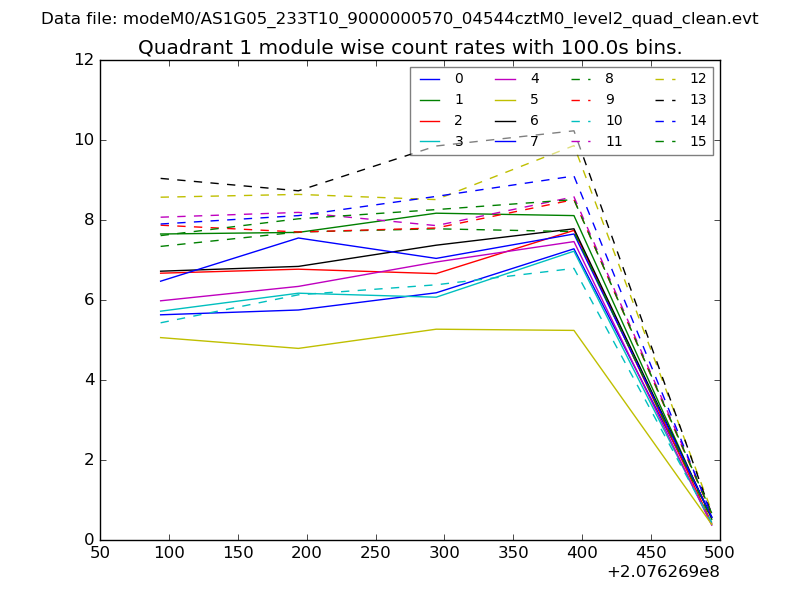 |
 |
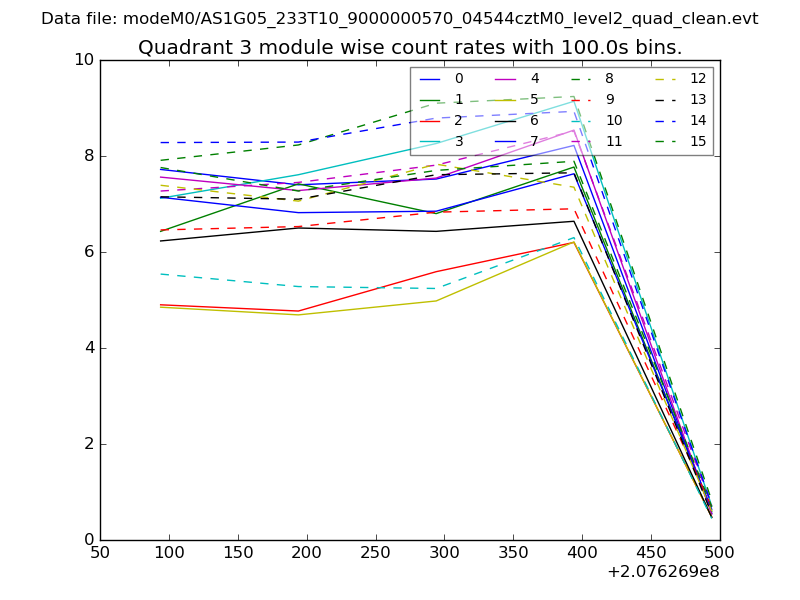
| Module-wise count rates for Quadrant C Data is divided into 100 sec bins |
 |
 |
| Module-wise count rates for Quadrant D Data is divided into 100 sec bins |
 |
 |
| Parameter | Plot |
|---|---|
| CZT HV Monitor | 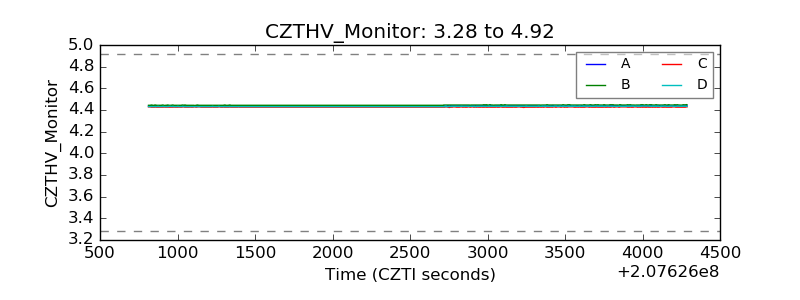 |
| D_VDD | 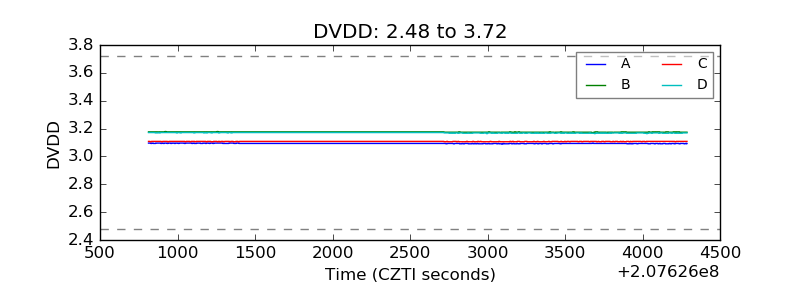 |
| Temperature 1 | 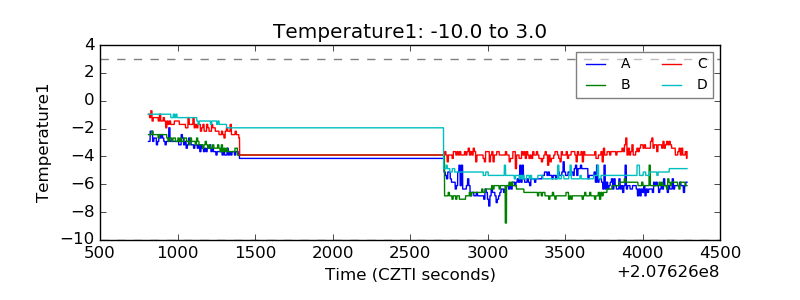 |
| Veto HV Monitor | 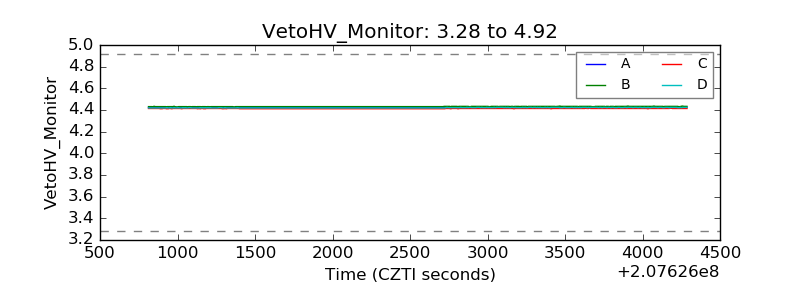 |
| Veto LLD | 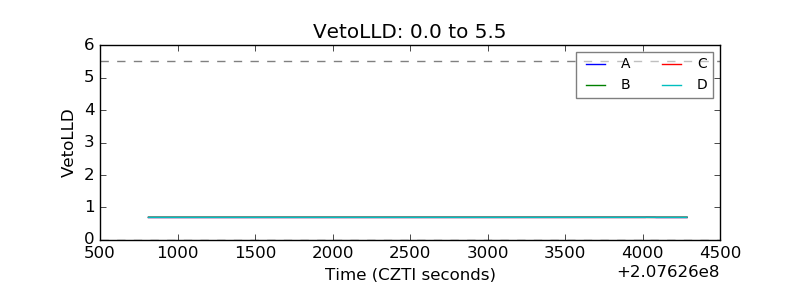 |
| Alpha Counter | 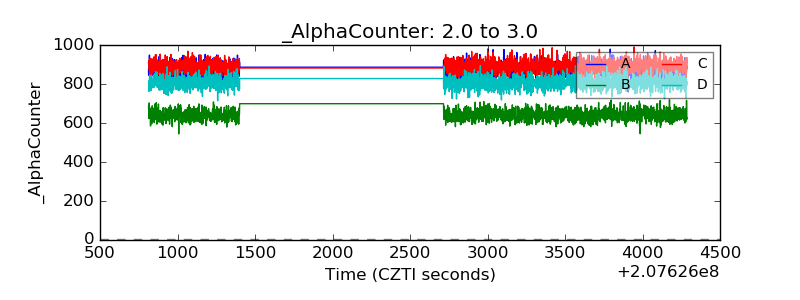 |
| _CPM_Rate | 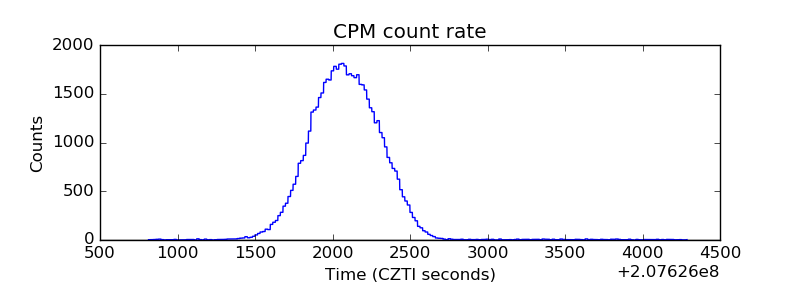 |
| CZT Counter | 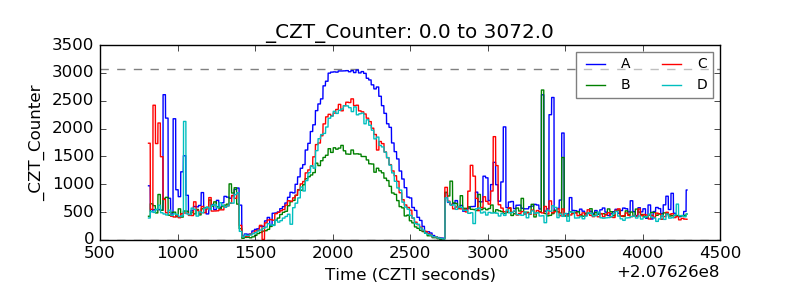 |
| +2.5 Volts monitor |  |
| +5 Volts monitor |  |
| _ROLL_ROT | 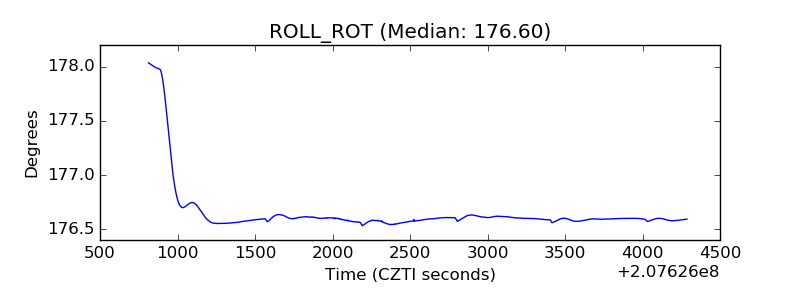 |
| _Roll_DEC | 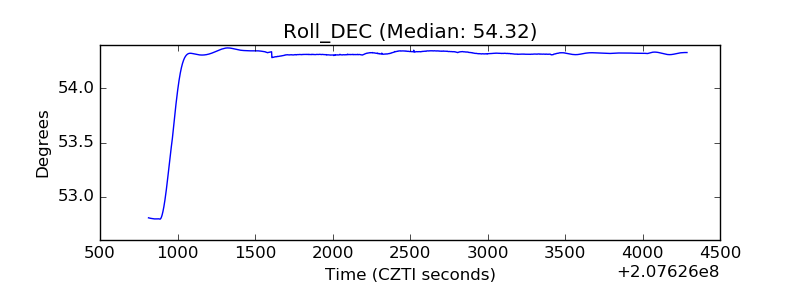 |
| _Roll_RA | 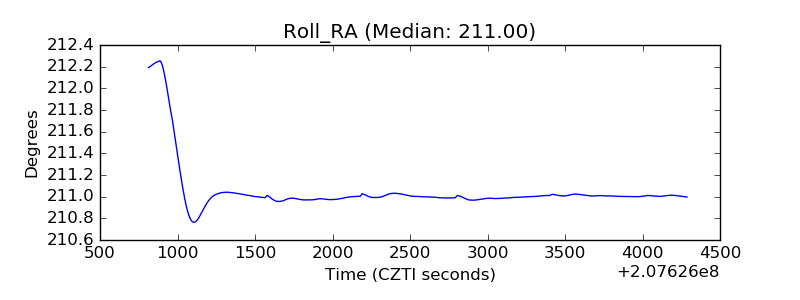 |
| Veto Counter | 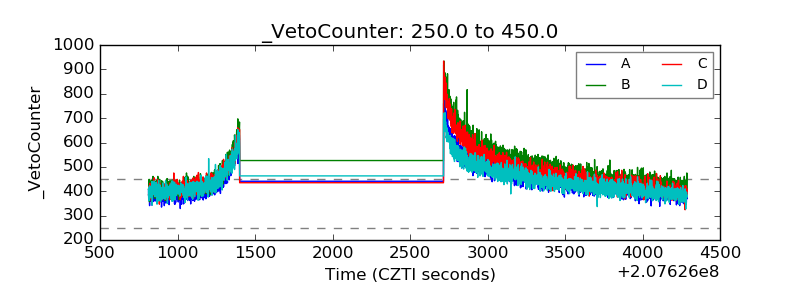 |