| Param | Original file | Final file |
|---|---|---|
| Filename | modeM0/AS1G05_233T10_9000000570_04545cztM0_level2.evt | modeM0/AS1G05_233T10_9000000570_04545cztM0_level2_quad_clean.evt |
| Size (bytes) | 432,011,520 | 61,721,280 |
| Size | 412.0 MB | 58.9 MB |
| Events in quadrant A | 4,224,717 | 368,942 |
| Events in quadrant B | 2,937,344 | 371,724 |
| Events in quadrant C | 2,799,114 | 367,187 |
| Events in quadrant D | 2,728,342 | 355,794 |
| Mode M9 | |||
|---|---|---|---|
| Quadrant | BADHDUFLAG | Total packets | Discarded packets |
| A | 0 | 13 | 0 |
| B | 0 | 13 | 0 |
| C | 0 | 13 | 0 |
| D | 0 | 13 | 0 |
| Mode M0 | |||
|---|---|---|---|
| Quadrant | BADHDUFLAG | Total packets | Discarded packets |
| A | 0 | 16292 | 2 |
| B | 0 | 12442 | 1 |
| C | 0 | 12375 | 1 |
| D | 0 | 12281 | 1 |
| Mode SS | |||
|---|---|---|---|
| Quadrant | BADHDUFLAG | Total packets | Discarded packets |
| A | 0 | 118 | 0 |
| B | 0 | 118 | 0 |
| C | 0 | 118 | 0 |
| D | 0 | 118 | 0 |
| Quadrant | Total seconds | Saturated seconds | Saturation percentage |
|---|---|---|---|
| A | 5794 | 392 | 6.765620% |
| B | 5794 | 83 | 1.432516% |
| C | 5794 | 64 | 1.104591% |
| D | 5794 | 37 | 0.638592% |
Noise dominated data is calculated using 1-second bins in cleaned event files. If a bin has >2000 counts, and if more than 50% of those come from <1% of pixels, then it is considered to be noise-dominated and hence unusable.
| Quadrant | # 1 sec bins | Bins with >0 counts | Bins with >2000 counts | High rate bins dominated by noise | Noise dominated (total time) | Noise dominated (detector-on time) | Marked lightcurve |
|---|---|---|---|---|---|---|---|
| A | 7099 | 5795 | 244 | 244 | 3.44% | 4.21% | 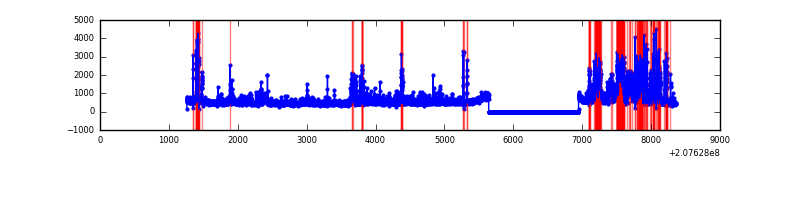 |
| B | 7099 | 5795 | 9 | 9 | 0.13% | 0.16% | 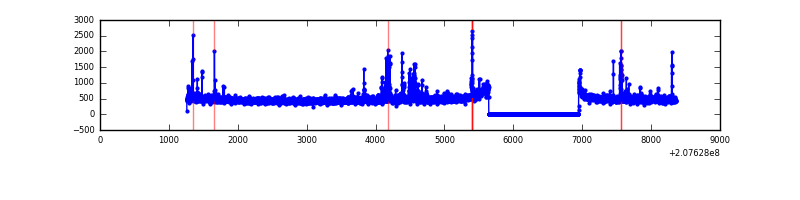 |
| C | 7099 | 5795 | 19 | 19 | 0.27% | 0.33% | 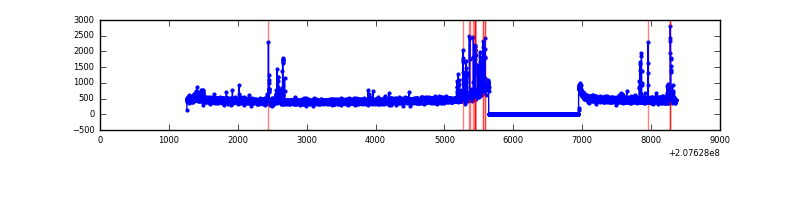 |
| D | 7099 | 5795 | 8 | 8 | 0.11% | 0.14% | 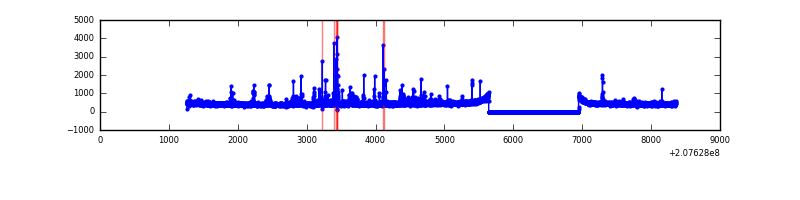 |
Top three noisy pixels from each quadrant. If the there are fewer than three noisy pixels in the level2.evt file, extra rows are filled as -1
| Pixel properties | Quadrant properties | ||||||
|---|---|---|---|---|---|---|---|
| Quadrant | DetID | PixID | Counts | Sigma | Mean | Median | Sigma |
| A | 0 | 13 | 1443191 | 10488.08 | 680 | 664 | 137.5 |
| A | 8 | 15 | 89882 | 648.67 | 680 | 664 | 137.5 |
| A | 15 | 31 | 37764 | 269.74 | 680 | 664 | 137.5 |
| B | 4 | 80 | 76283 | 569.24 | 699 | 682 | 132.8 |
| B | 15 | 54 | 35694 | 263.62 | 699 | 682 | 132.8 |
| B | 12 | 18 | 24178 | 176.91 | 699 | 682 | 132.8 |
| C | 9 | 247 | 116447 | 752.27 | 667 | 669 | 153.9 |
| C | 14 | 48 | 61061 | 392.4 | 667 | 669 | 153.9 |
| C | 1 | 16 | 15581 | 96.89 | 667 | 669 | 153.9 |
| D | 13 | 235 | 106262 | 609.24 | 658 | 645 | 173.4 |
| D | 2 | 136 | 30518 | 172.32 | 658 | 645 | 173.4 |
| D | 7 | 67 | 28221 | 159.07 | 658 | 645 | 173.4 |
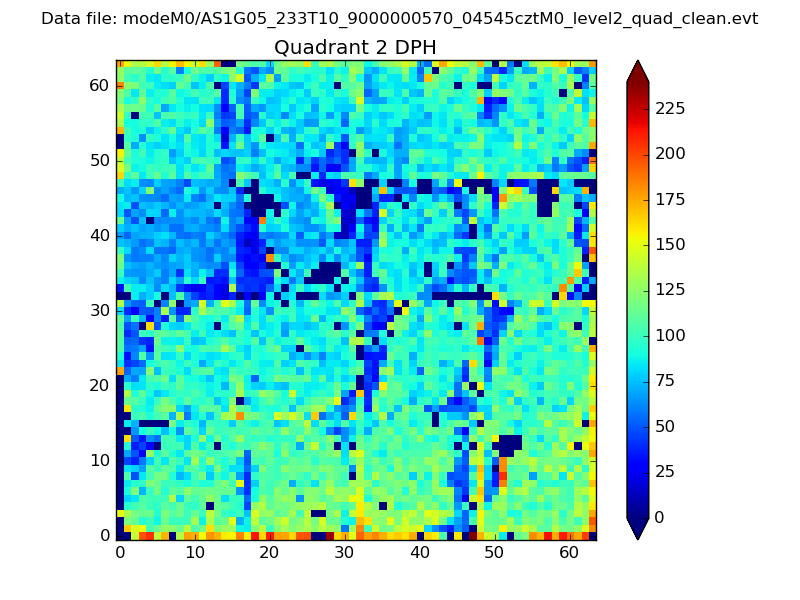
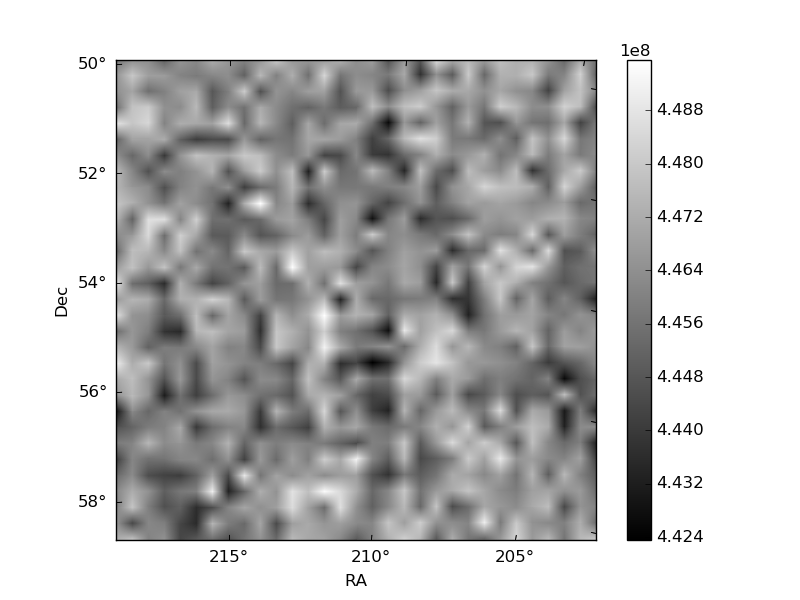
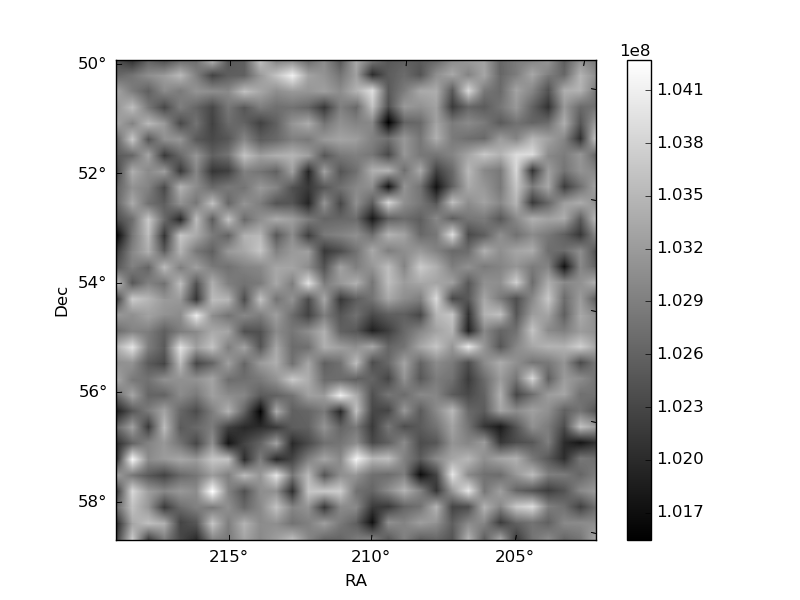
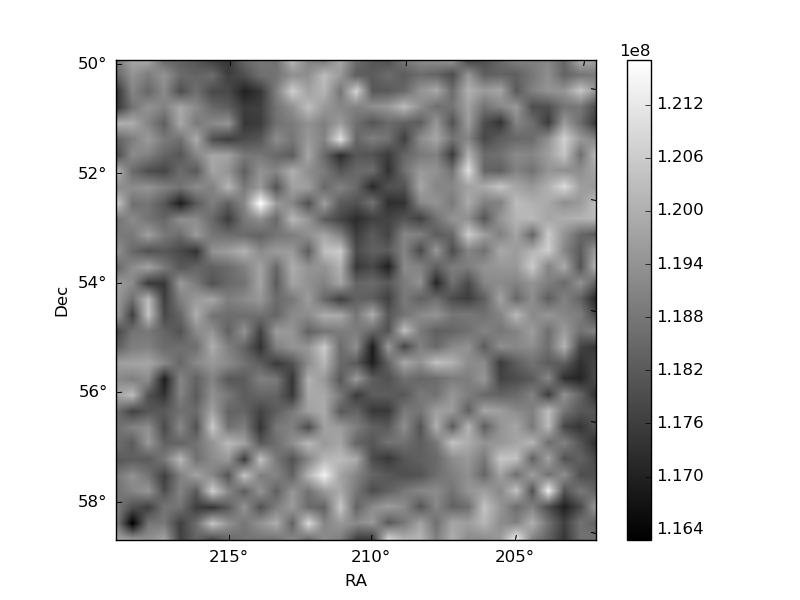
Histogram calculated using DETX and DETY for each event in the final _common_clean file
| Quadrant A | 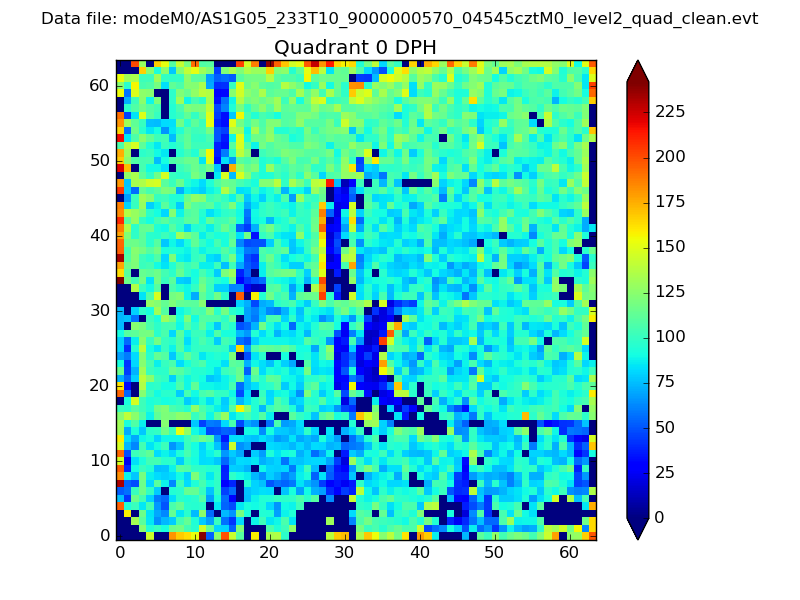 |
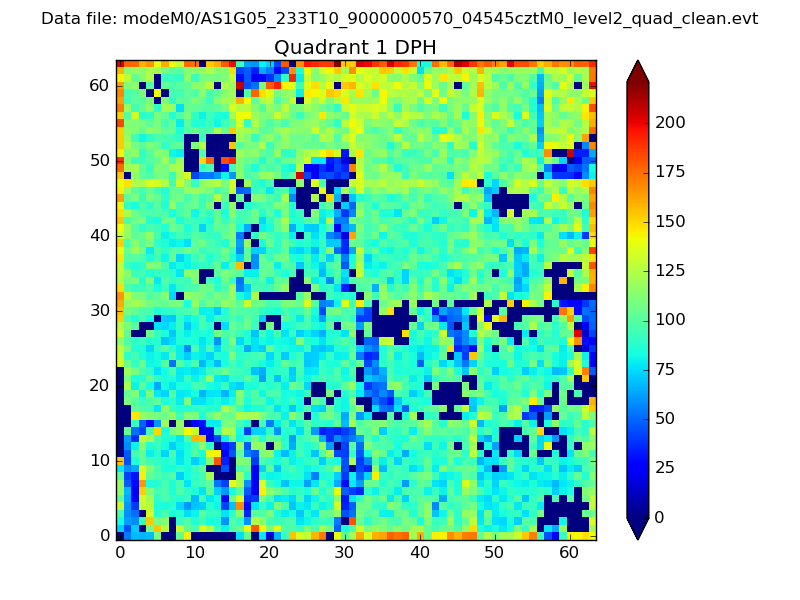 |
Quadrant B |
|---|---|---|---|
| Quadrant D | 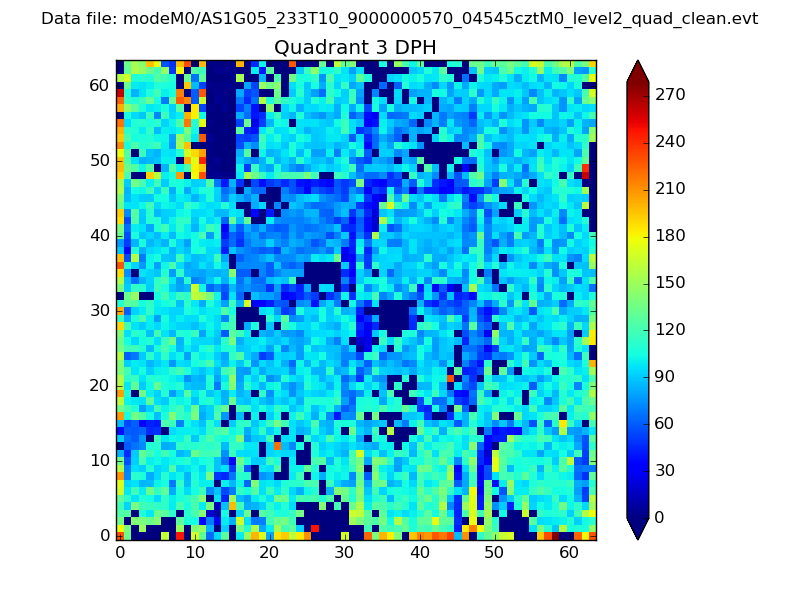 |
 |
Quadrant C |
| Plot type | Count rate plots | Images |
|---|---|---|
| Comparison with Poisson distribution Blue bars denote a histogram of data divided into 1 sec bins. Red curve is a Poisson curve with rate = median count rate of data. |
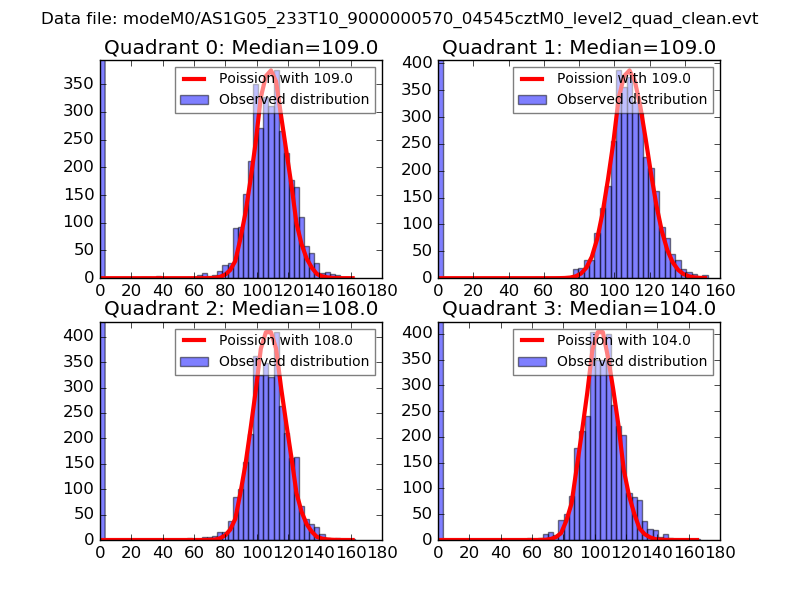 |
 |
| Quadrant-wise count rates Data is divided into 100 sec bins |
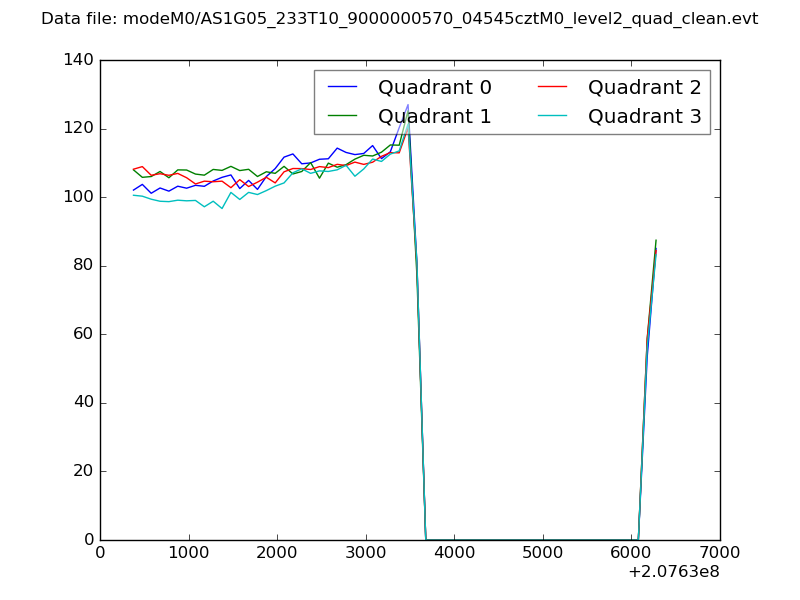 |
|
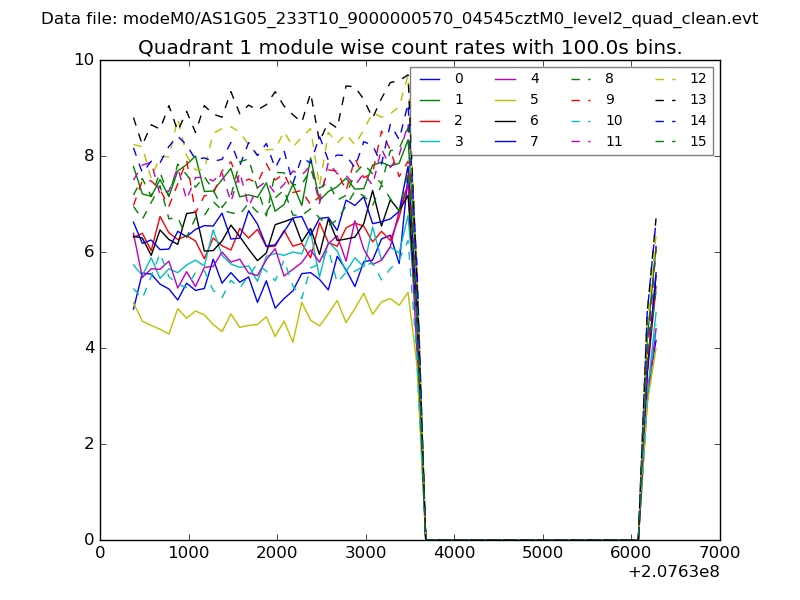
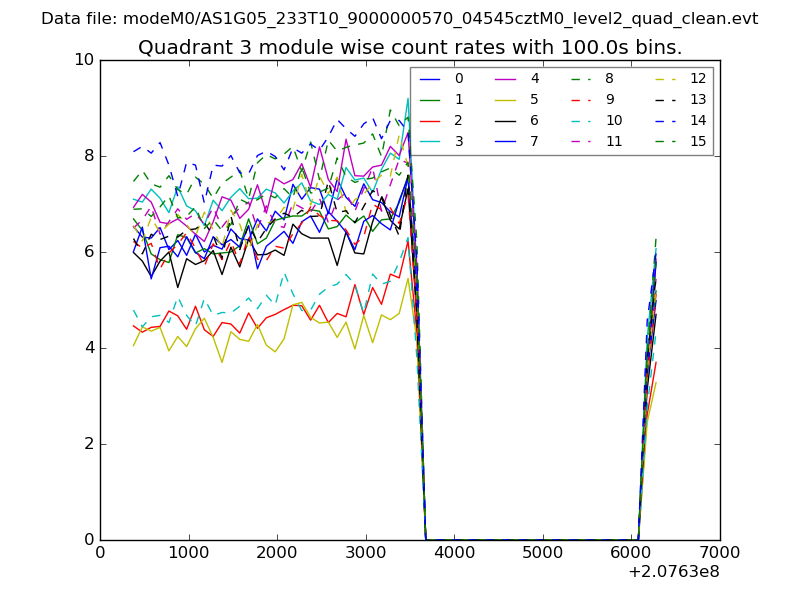
| Module-wise count rates for Quadrant A Data is divided into 100 sec bins |
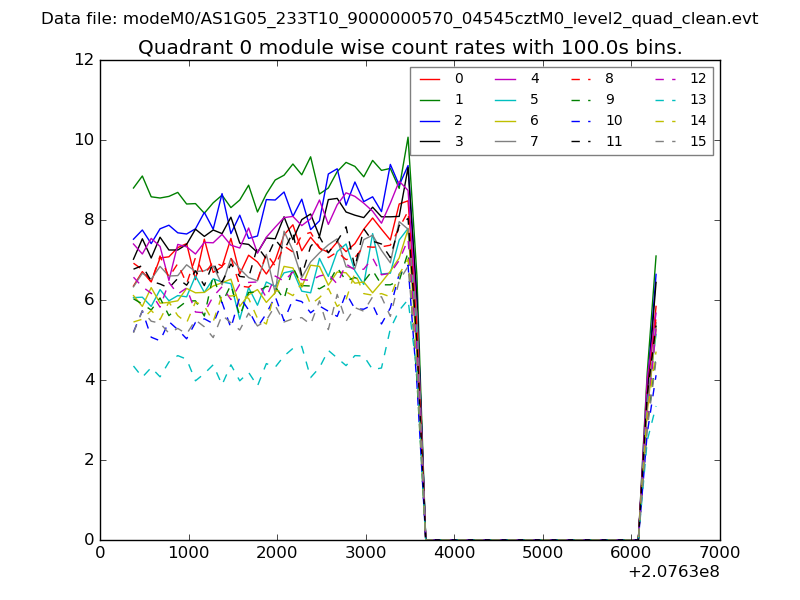 |
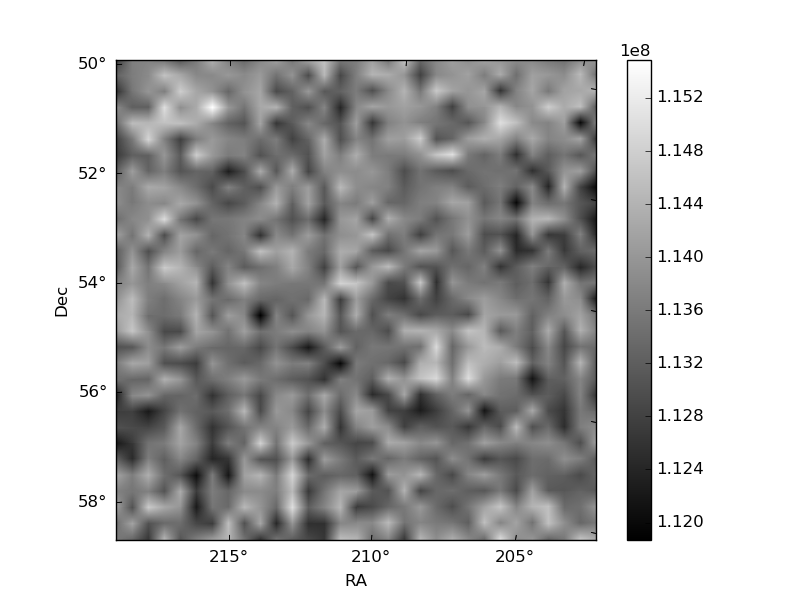 |
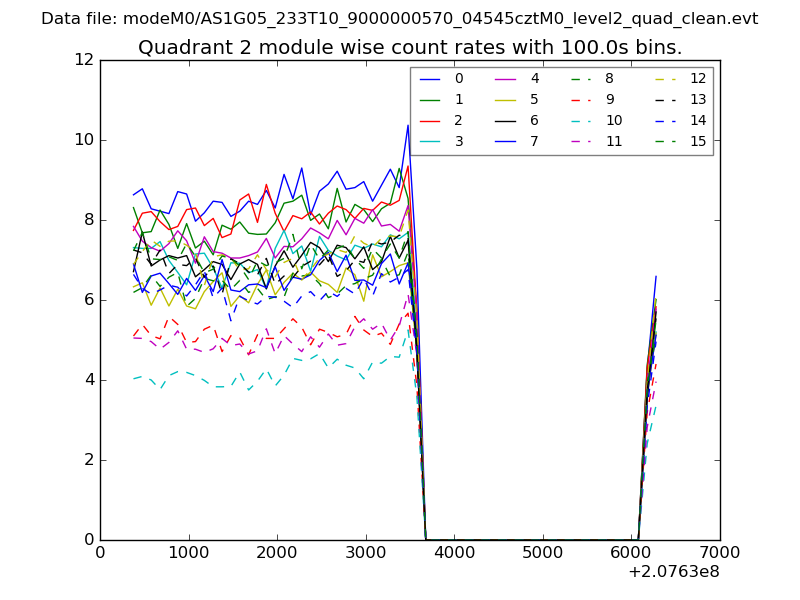
| Module-wise count rates for Quadrant B Data is divided into 100 sec bins |
 |
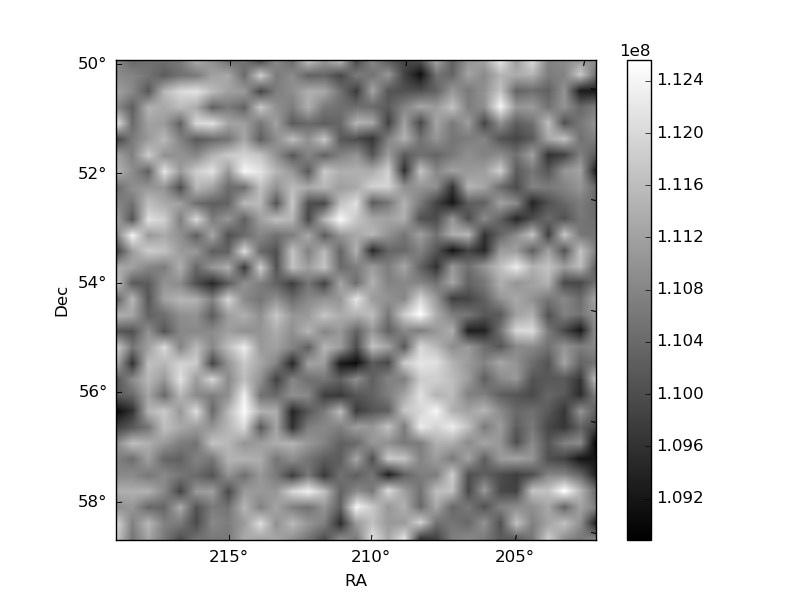 |
| Module-wise count rates for Quadrant C Data is divided into 100 sec bins |
 |
 |
| Module-wise count rates for Quadrant D Data is divided into 100 sec bins |
 |
 |
| Parameter | Plot |
|---|---|
| CZT HV Monitor | 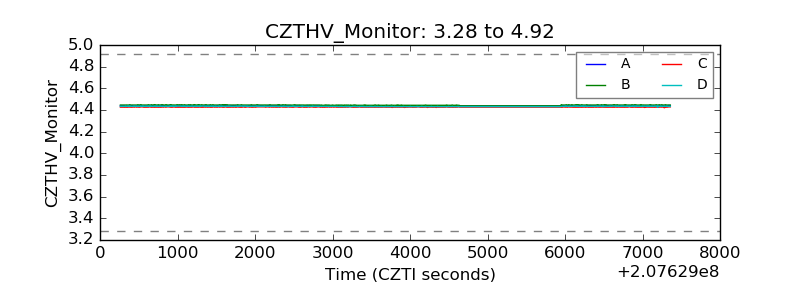 |
| D_VDD | 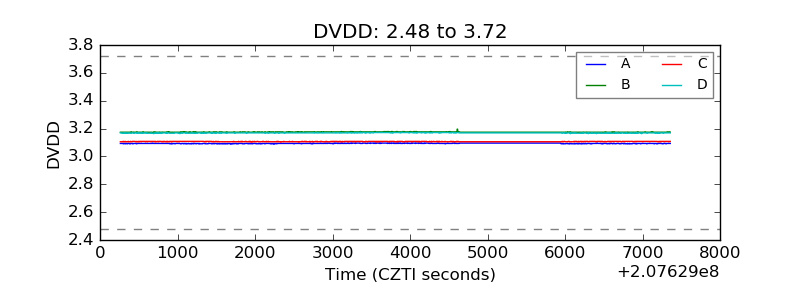 |
| Temperature 1 | 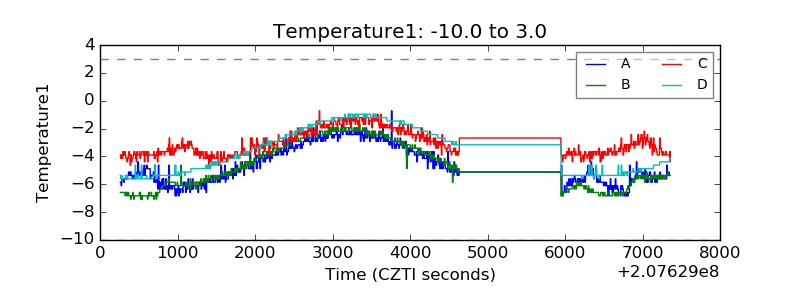 |
| Veto HV Monitor | 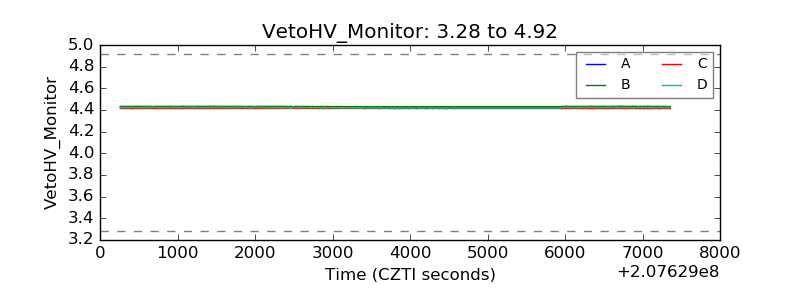 |
| Veto LLD | 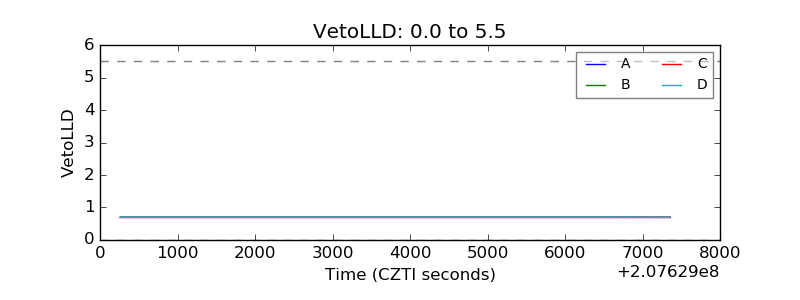 |
| Alpha Counter | 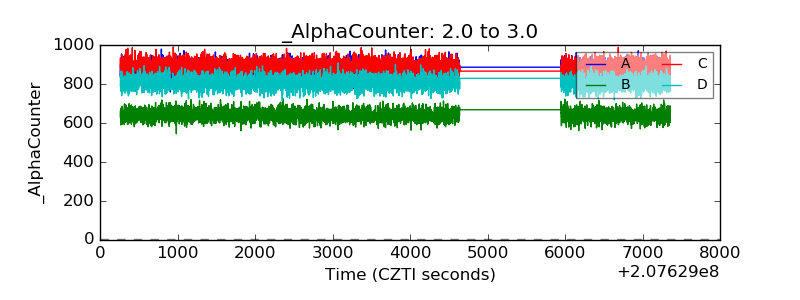 |
| _CPM_Rate | 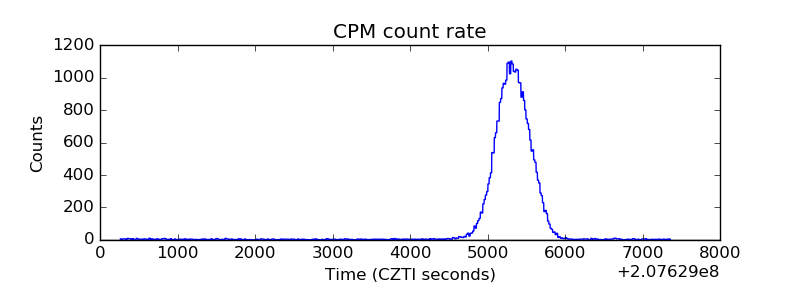 |
| CZT Counter | 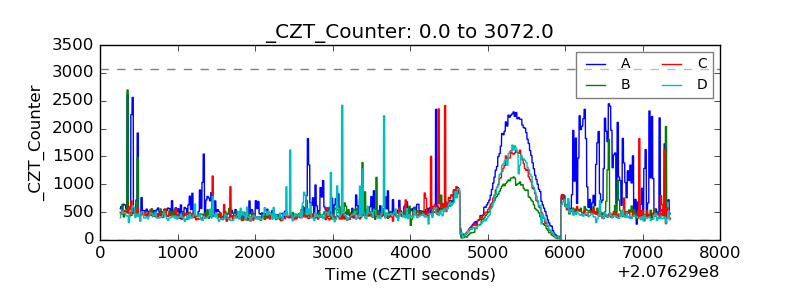 |
| +2.5 Volts monitor |  |
| +5 Volts monitor | 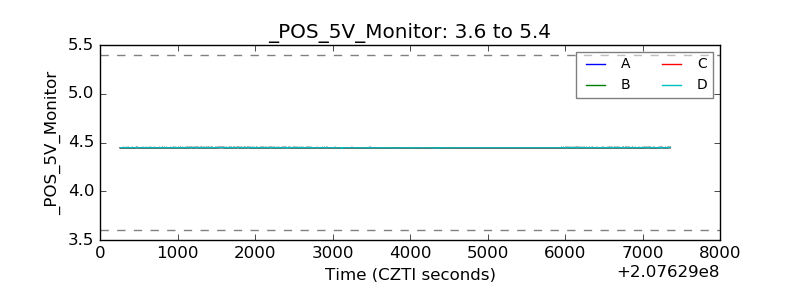 |
| _ROLL_ROT | 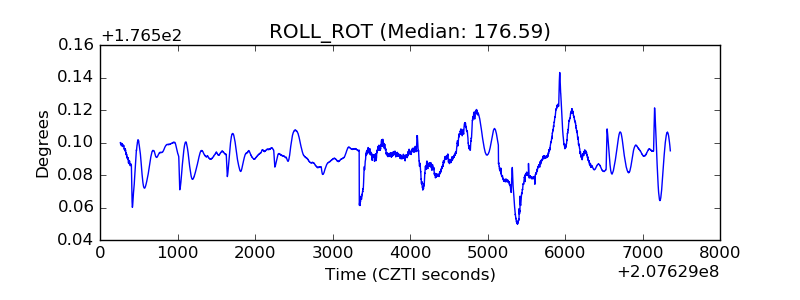 |
| _Roll_DEC | 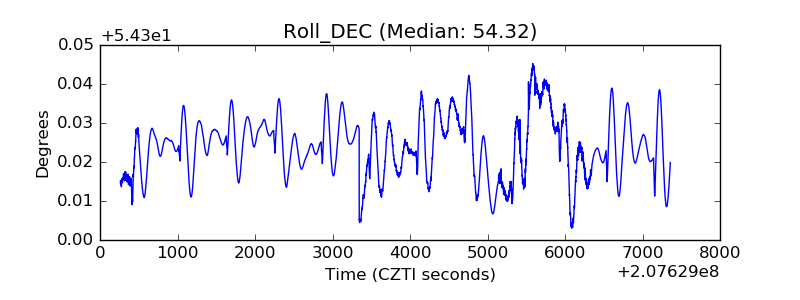 |
| _Roll_RA | 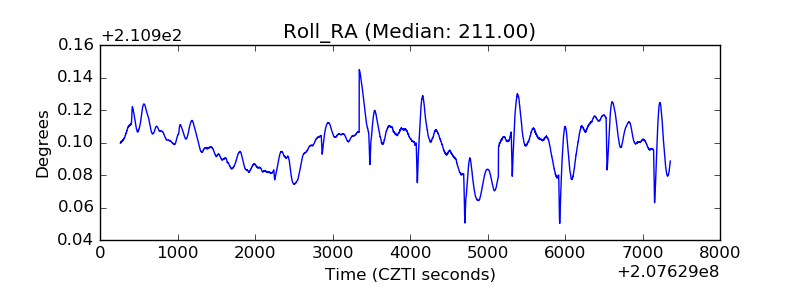 |
| Veto Counter | 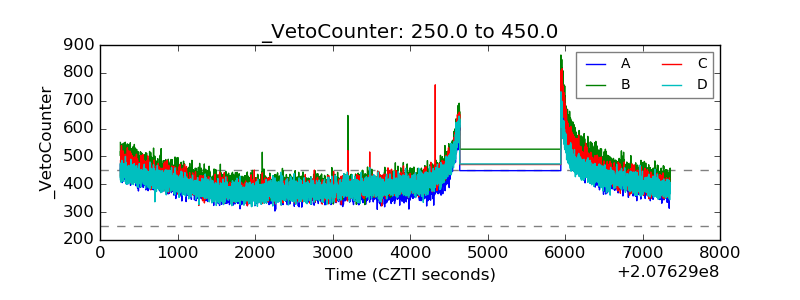 |