| Param | Original file | Final file |
|---|---|---|
| Filename | modeM0/AS1G05_233T10_9000000570_04546cztM0_level2.evt | modeM0/AS1G05_233T10_9000000570_04546cztM0_level2_quad_clean.evt |
| Size (bytes) | 584,110,080 | 75,314,880 |
| Size | 557.1 MB | 71.8 MB |
| Events in quadrant A | 7,797,948 | 430,187 |
| Events in quadrant B | 3,260,349 | 476,478 |
| Events in quadrant C | 3,125,078 | 467,142 |
| Events in quadrant D | 3,067,458 | 454,972 |
| Mode M9 | |||
|---|---|---|---|
| Quadrant | BADHDUFLAG | Total packets | Discarded packets |
| A | 0 | 11 | 0 |
| B | 0 | 11 | 0 |
| C | 0 | 11 | 0 |
| D | 0 | 11 | 0 |
| Mode M0 | |||
|---|---|---|---|
| Quadrant | BADHDUFLAG | Total packets | Discarded packets |
| A | 0 | 27631 | 2 |
| B | 0 | 13774 | 1 |
| C | 0 | 13786 | 1 |
| D | 0 | 13832 | 1 |
| Mode SS | |||
|---|---|---|---|
| Quadrant | BADHDUFLAG | Total packets | Discarded packets |
| A | 0 | 132 | 0 |
| B | 0 | 132 | 0 |
| C | 0 | 132 | 0 |
| D | 0 | 132 | 0 |
| Quadrant | Total seconds | Saturated seconds | Saturation percentage |
|---|---|---|---|
| A | 6467 | 1684 | 26.039895% |
| B | 6467 | 155 | 2.396784% |
| C | 6467 | 125 | 1.932890% |
| D | 6467 | 124 | 1.917427% |
Noise dominated data is calculated using 1-second bins in cleaned event files. If a bin has >2000 counts, and if more than 50% of those come from <1% of pixels, then it is considered to be noise-dominated and hence unusable.
| Quadrant | # 1 sec bins | Bins with >0 counts | Bins with >2000 counts | High rate bins dominated by noise | Noise dominated (total time) | Noise dominated (detector-on time) | Marked lightcurve |
|---|---|---|---|---|---|---|---|
| A | 7572 | 6468 | 1022 | 1022 | 13.50% | 15.80% | 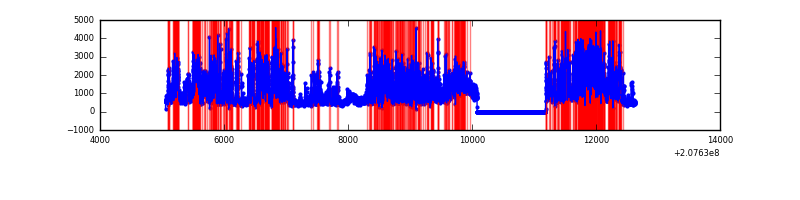 |
| B | 7572 | 6468 | 4 | 4 | 0.05% | 0.06% | 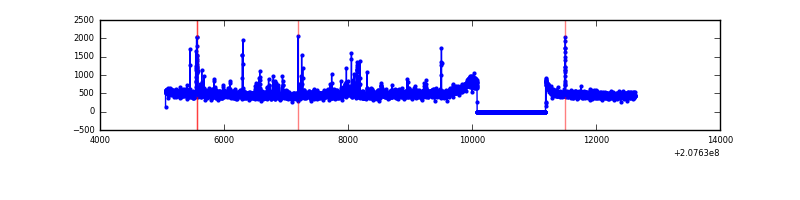 |
| C | 7572 | 6468 | 9 | 9 | 0.12% | 0.14% | 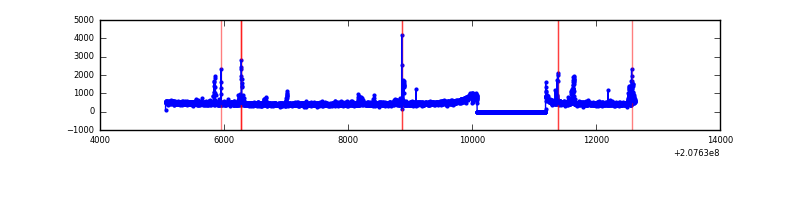 |
| D | 7572 | 6468 | 11 | 11 | 0.15% | 0.17% | 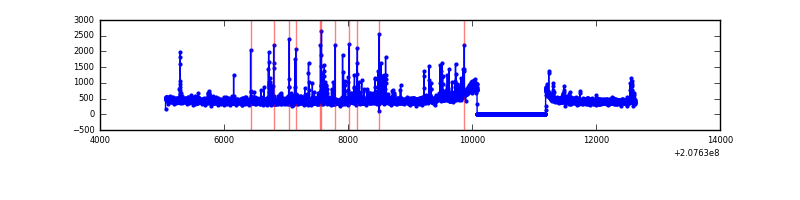 |
Top three noisy pixels from each quadrant. If the there are fewer than three noisy pixels in the level2.evt file, extra rows are filled as -1
| Pixel properties | Quadrant properties | ||||||
|---|---|---|---|---|---|---|---|
| Quadrant | DetID | PixID | Counts | Sigma | Mean | Median | Sigma |
| A | 0 | 13 | 4694720 | 32796.43 | 701 | 685 | 143.1 |
| A | 13 | 251 | 230122 | 1603.04 | 701 | 685 | 143.1 |
| A | 0 | 50 | 125225 | 870.14 | 701 | 685 | 143.1 |
| B | 8 | 3 | 60084 | 399.35 | 781 | 764 | 148.5 |
| B | 4 | 80 | 52159 | 346.0 | 781 | 764 | 148.5 |
| B | 12 | 18 | 31487 | 206.83 | 781 | 764 | 148.5 |
| C | 14 | 48 | 177380 | 1017.04 | 747 | 749 | 173.7 |
| C | 9 | 247 | 26855 | 150.32 | 747 | 749 | 173.7 |
| C | 13 | 61 | 6015 | 30.32 | 747 | 749 | 173.7 |
| D | 13 | 235 | 126278 | 696.42 | 744 | 723 | 180.3 |
| D | 2 | 136 | 59138 | 324.01 | 744 | 723 | 180.3 |
| D | 9 | 35 | 16428 | 87.11 | 744 | 723 | 180.3 |
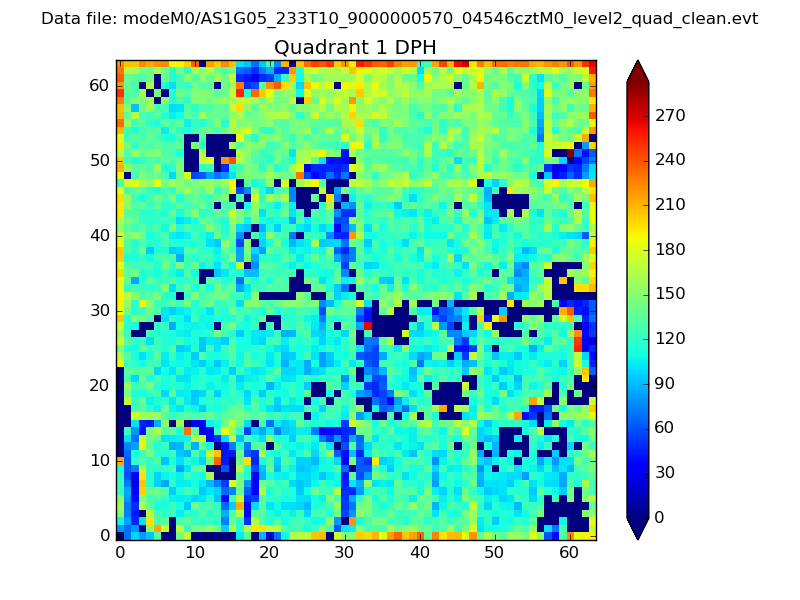
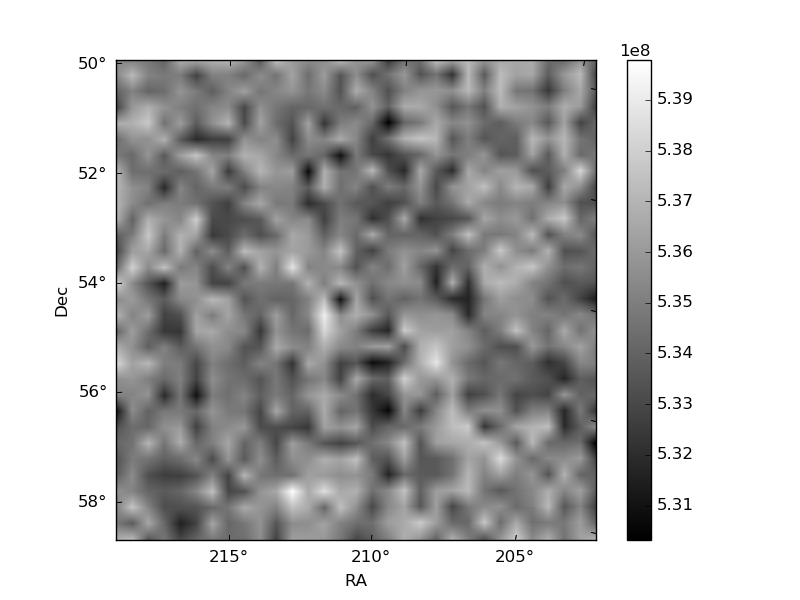
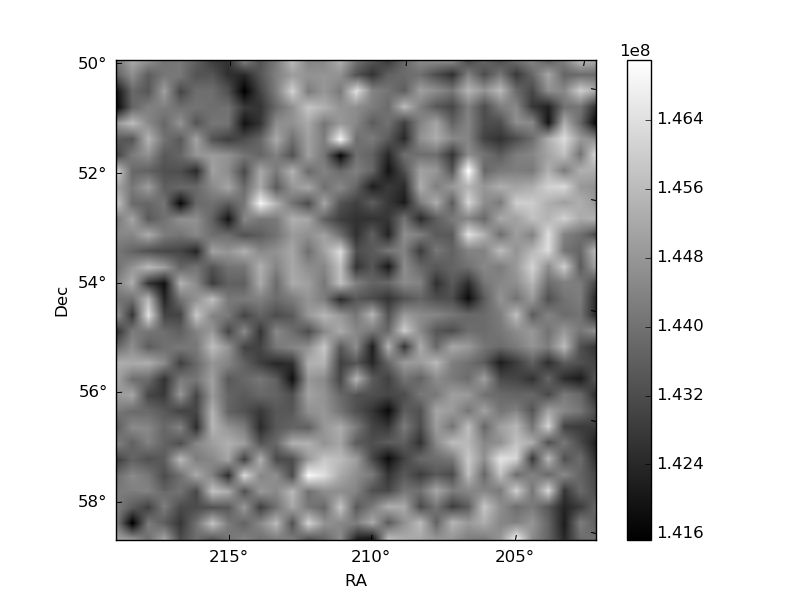
Histogram calculated using DETX and DETY for each event in the final _common_clean file
| Quadrant A | 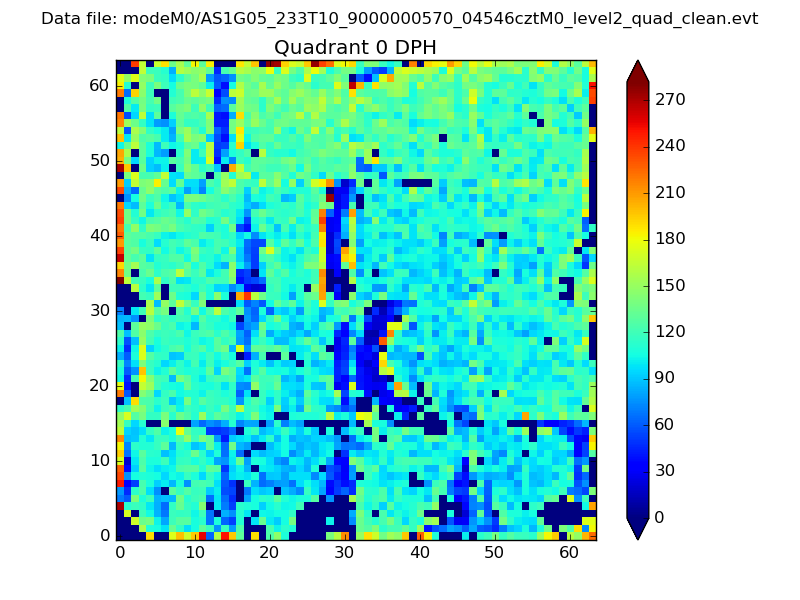 |
 |
Quadrant B |
|---|---|---|---|
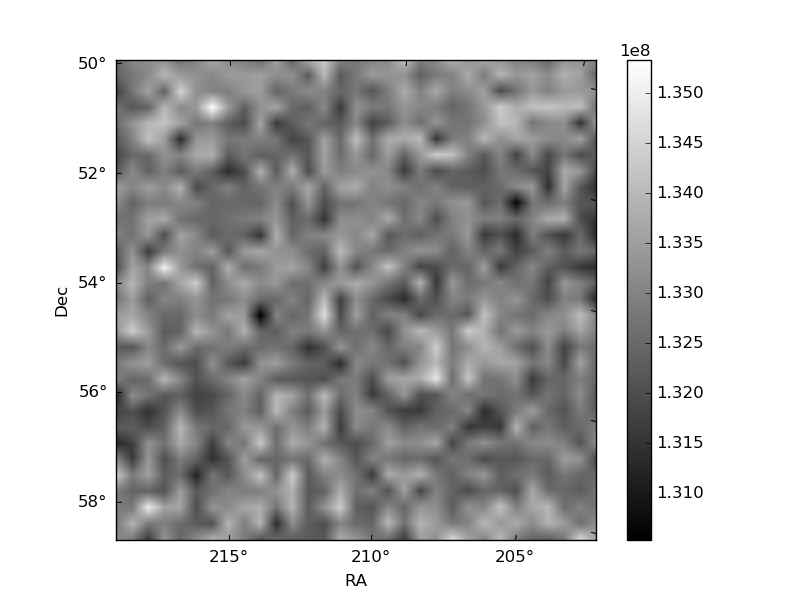
| Quadrant D | 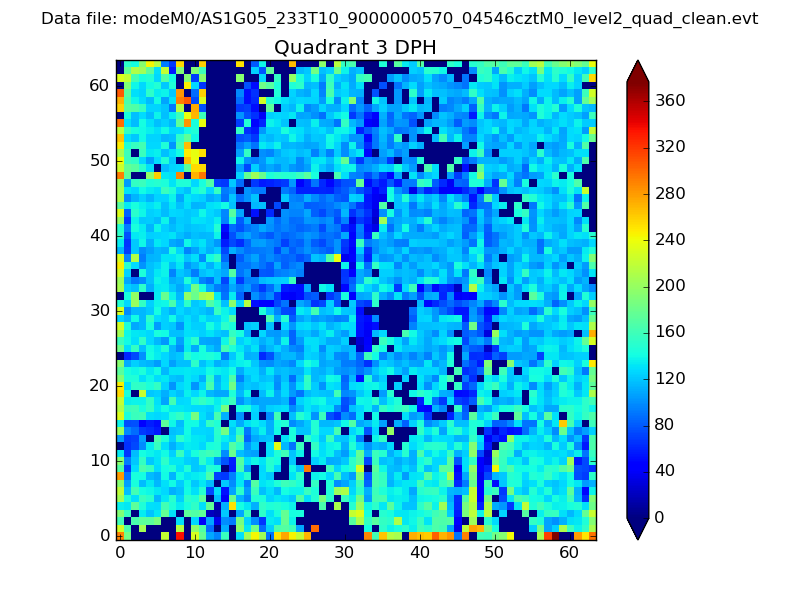 |
 |
Quadrant C |
| Plot type | Count rate plots | Images |
|---|---|---|
| Comparison with Poisson distribution Blue bars denote a histogram of data divided into 1 sec bins. Red curve is a Poisson curve with rate = median count rate of data. |
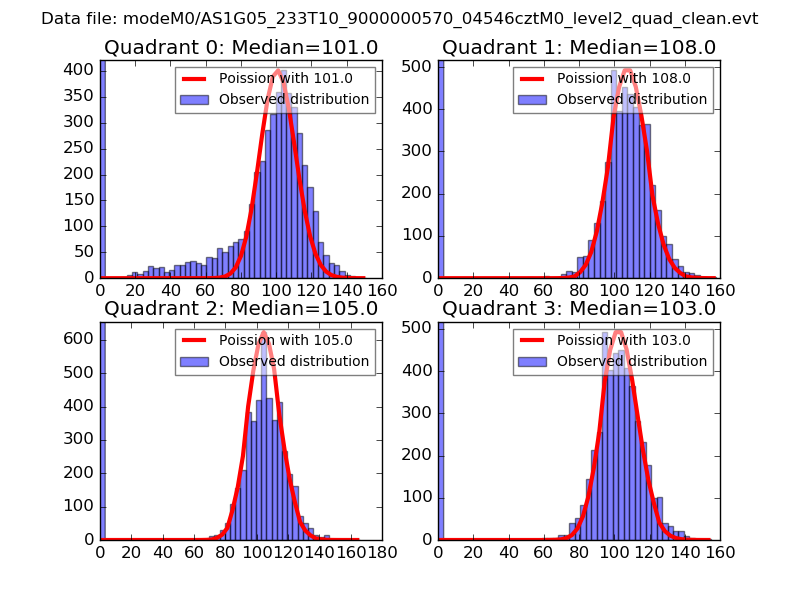 |
 |
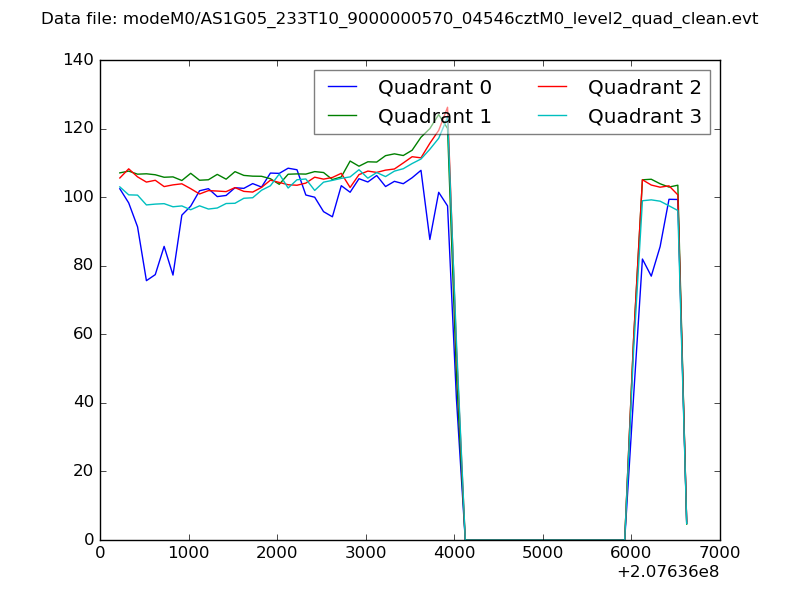
| Quadrant-wise count rates Data is divided into 100 sec bins |
 |
|
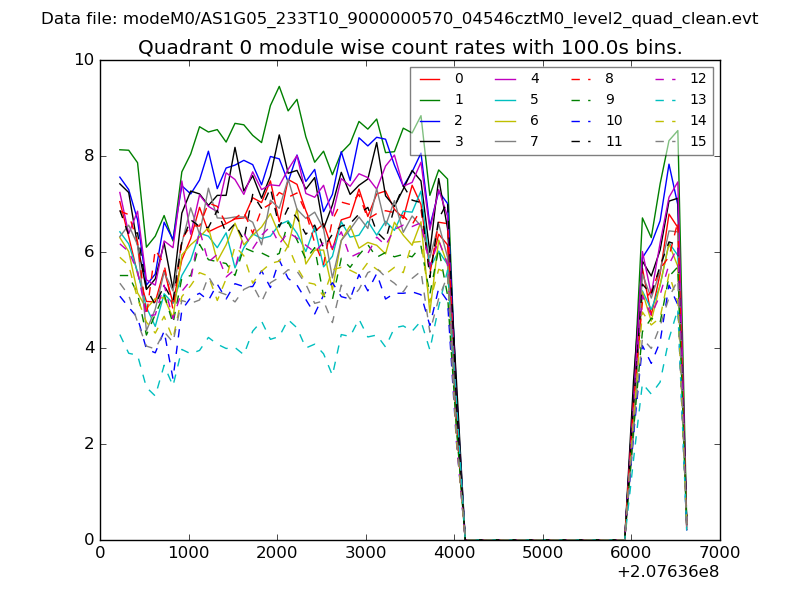
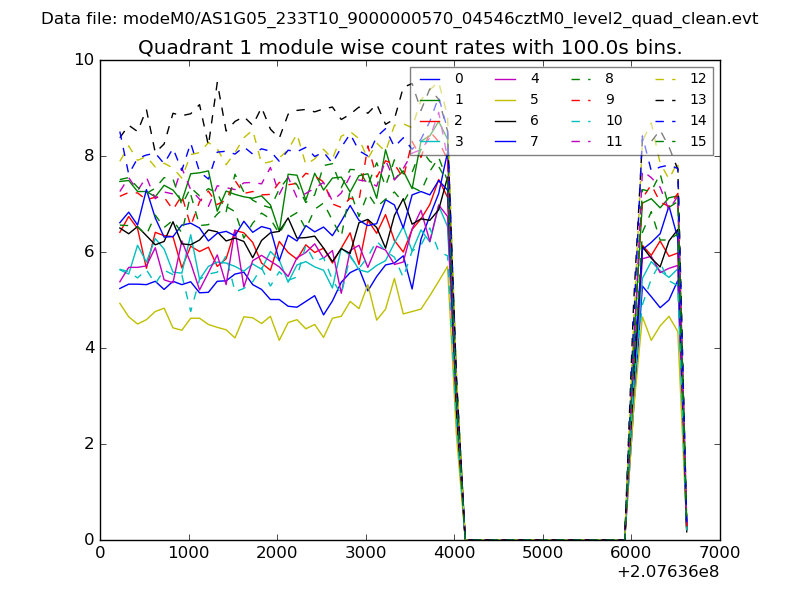
| Module-wise count rates for Quadrant A Data is divided into 100 sec bins |
 |
 |
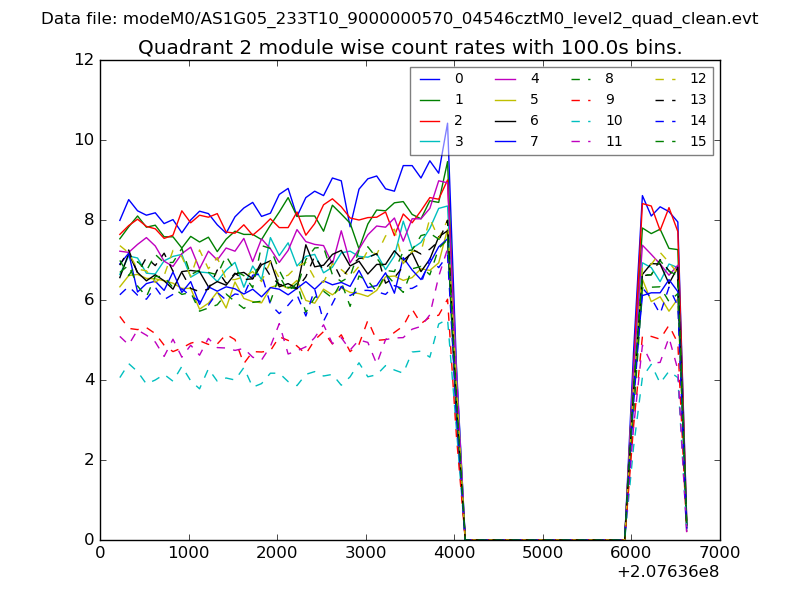
| Module-wise count rates for Quadrant B Data is divided into 100 sec bins |
 |
 |
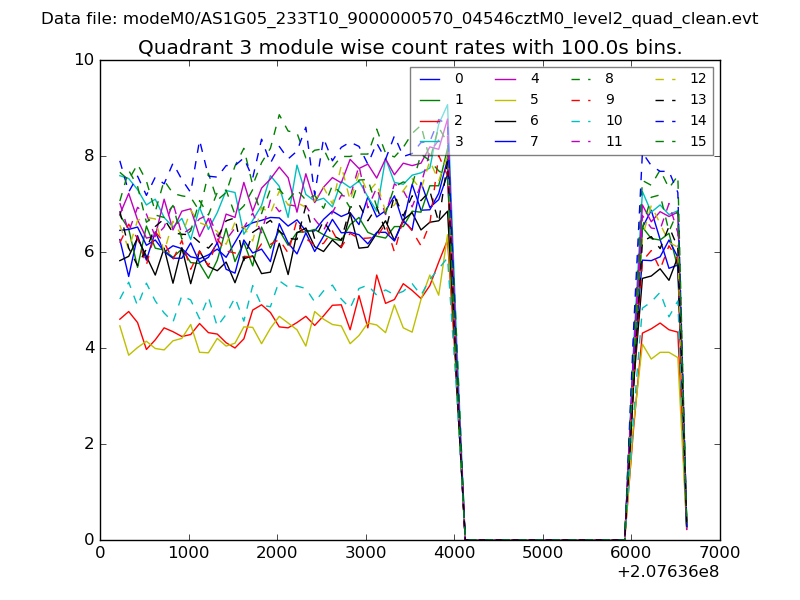
| Module-wise count rates for Quadrant C Data is divided into 100 sec bins |
 |
 |
| Module-wise count rates for Quadrant D Data is divided into 100 sec bins |
 |
 |
| Parameter | Plot |
|---|---|
| CZT HV Monitor | 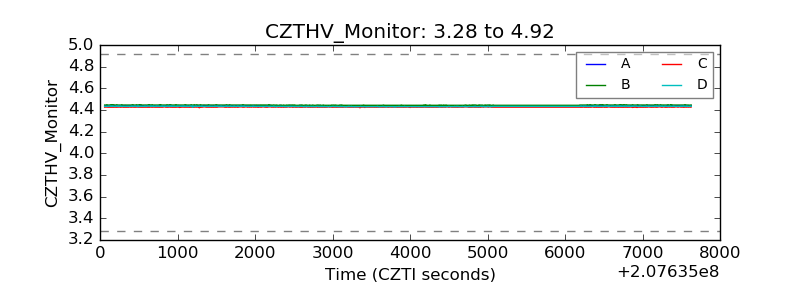 |
| D_VDD | 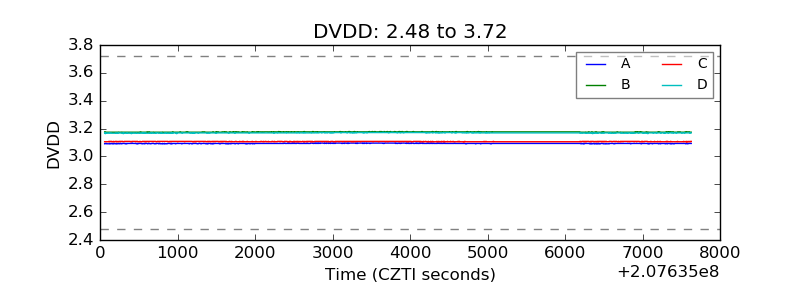 |
| Temperature 1 | 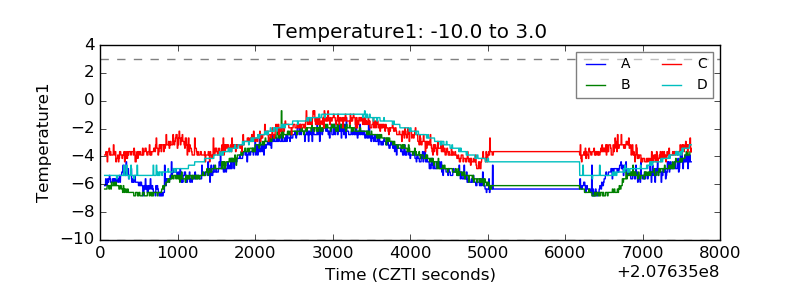 |
| Veto HV Monitor | 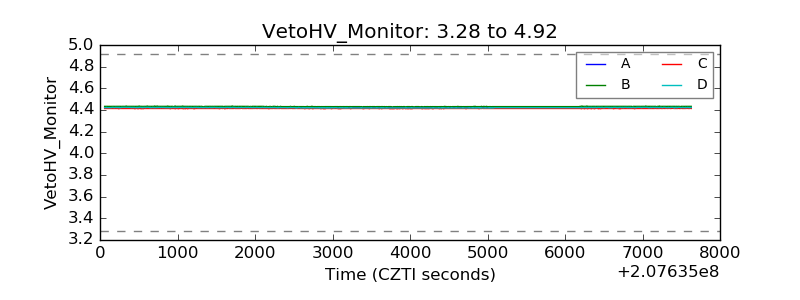 |
| Veto LLD | 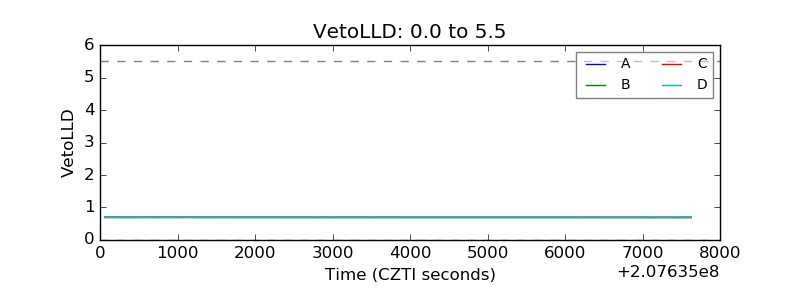 |
| Alpha Counter | 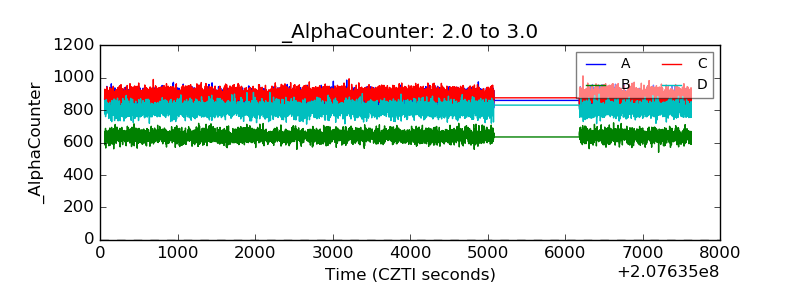 |
| _CPM_Rate | 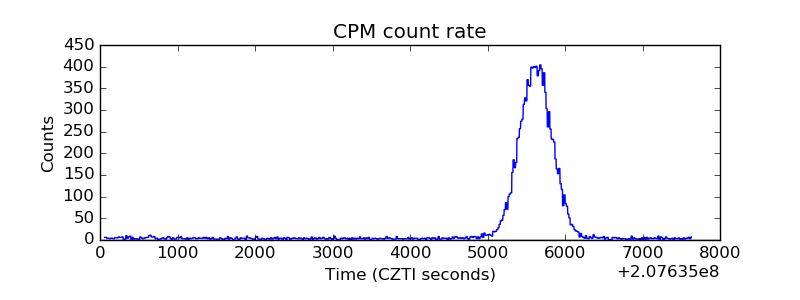 |
| CZT Counter | 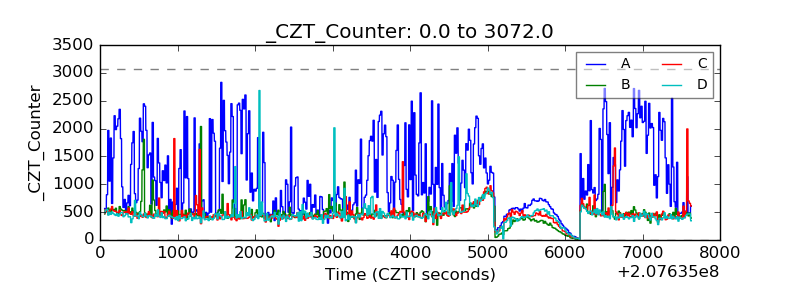 |
| +2.5 Volts monitor |  |
| +5 Volts monitor |  |
| _ROLL_ROT | 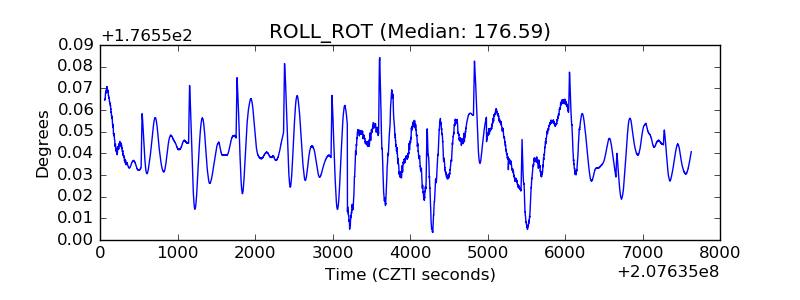 |
| _Roll_DEC | 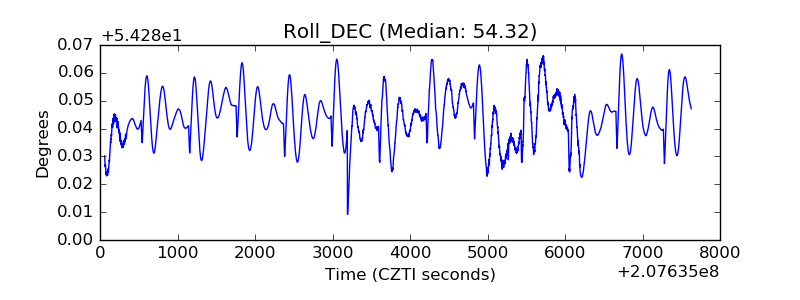 |
| _Roll_RA | 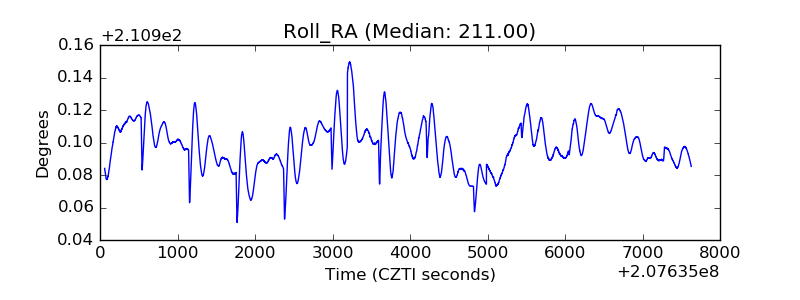 |
| Veto Counter | 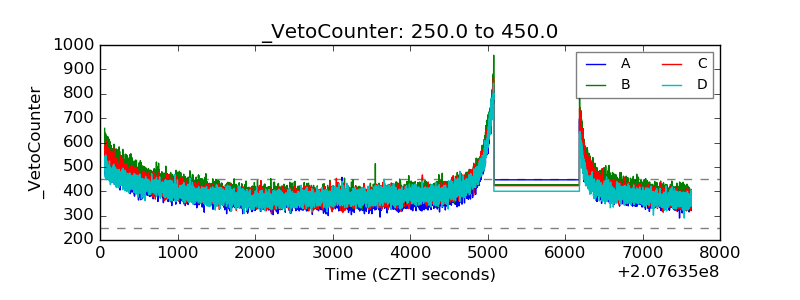 |