| Param | Original file | Final file |
|---|---|---|
| Filename | modeM0/AS1G05_233T10_9000000570_04547cztM0_level2.evt | modeM0/AS1G05_233T10_9000000570_04547cztM0_level2_quad_clean.evt |
| Size (bytes) | 678,335,040 | 80,490,240 |
| Size | 646.9 MB | 76.8 MB |
| Events in quadrant A | 9,863,754 | 425,972 |
| Events in quadrant B | 3,404,199 | 528,582 |
| Events in quadrant C | 3,449,432 | 523,092 |
| Events in quadrant D | 3,388,265 | 508,420 |
| Mode M9 | |||
|---|---|---|---|
| Quadrant | BADHDUFLAG | Total packets | Discarded packets |
| A | 0 | 9 | 0 |
| B | 0 | 9 | 0 |
| C | 0 | 9 | 0 |
| D | 0 | 9 | 0 |
| Mode M0 | |||
|---|---|---|---|
| Quadrant | BADHDUFLAG | Total packets | Discarded packets |
| A | 0 | 33819 | 2 |
| B | 0 | 14464 | 1 |
| C | 0 | 14803 | 1 |
| D | 0 | 14713 | 1 |
| Mode SS | |||
|---|---|---|---|
| Quadrant | BADHDUFLAG | Total packets | Discarded packets |
| A | 0 | 130 | 0 |
| B | 0 | 130 | 0 |
| C | 0 | 130 | 0 |
| D | 0 | 130 | 0 |
| Quadrant | Total seconds | Saturated seconds | Saturation percentage |
|---|---|---|---|
| A | 6462 | 2951 | 45.666976% |
| B | 6462 | 227 | 3.512844% |
| C | 6462 | 138 | 2.135562% |
| D | 6462 | 201 | 3.110492% |
Noise dominated data is calculated using 1-second bins in cleaned event files. If a bin has >2000 counts, and if more than 50% of those come from <1% of pixels, then it is considered to be noise-dominated and hence unusable.
| Quadrant | # 1 sec bins | Bins with >0 counts | Bins with >2000 counts | High rate bins dominated by noise | Noise dominated (total time) | Noise dominated (detector-on time) | Marked lightcurve |
|---|---|---|---|---|---|---|---|
| A | 7277 | 6462 | 1790 | 1790 | 24.60% | 27.70% | 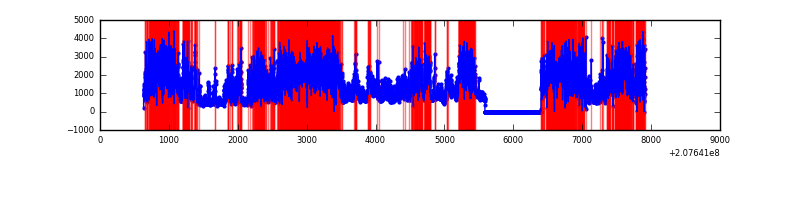 |
| B | 7277 | 6463 | 47 | 47 | 0.65% | 0.73% | 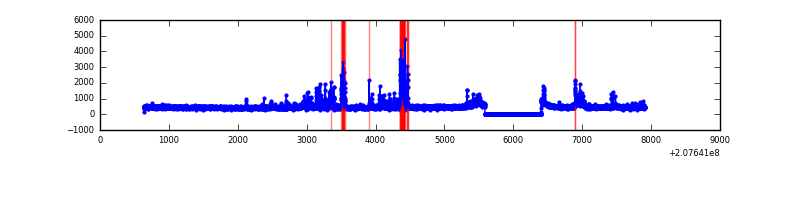 |
| C | 7277 | 6463 | 30 | 30 | 0.41% | 0.46% | 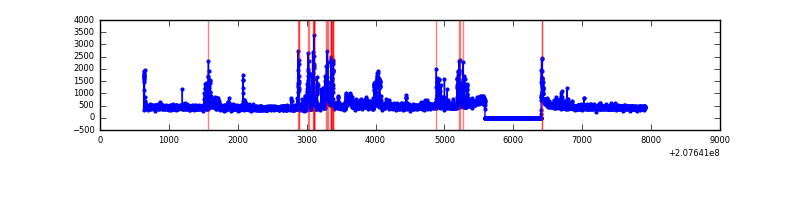 |
| D | 7277 | 6463 | 61 | 61 | 0.84% | 0.94% | 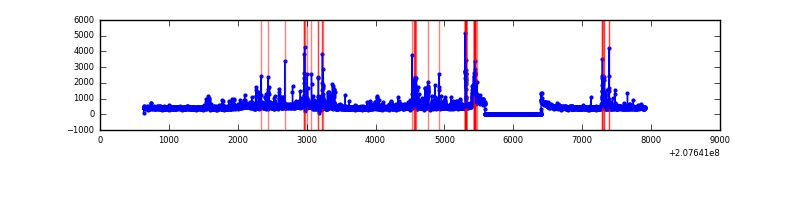 |
Top three noisy pixels from each quadrant. If the there are fewer than three noisy pixels in the level2.evt file, extra rows are filled as -1
| Pixel properties | Quadrant properties | ||||||
|---|---|---|---|---|---|---|---|
| Quadrant | DetID | PixID | Counts | Sigma | Mean | Median | Sigma |
| A | 0 | 13 | 7516593 | 61940.51 | 592 | 579 | 121.3 |
| A | 15 | 234 | 15663 | 124.31 | 592 | 579 | 121.3 |
| A | 13 | 251 | 14093 | 111.37 | 592 | 579 | 121.3 |
| B | 10 | 16 | 298810 | 2105.72 | 744 | 726 | 141.6 |
| B | 14 | 167 | 97891 | 686.39 | 744 | 726 | 141.6 |
| B | 15 | 204 | 44651 | 310.29 | 744 | 726 | 141.6 |
| C | 14 | 48 | 618794 | 3720.04 | 717 | 719 | 166.1 |
| C | 9 | 247 | 20049 | 116.34 | 717 | 719 | 166.1 |
| C | 9 | 54 | 10522 | 59.0 | 717 | 719 | 166.1 |
| D | 13 | 235 | 174200 | 1013.26 | 713 | 691 | 171.2 |
| D | 1 | 20 | 172735 | 1004.7 | 713 | 691 | 171.2 |
| D | 9 | 35 | 145037 | 842.95 | 713 | 691 | 171.2 |
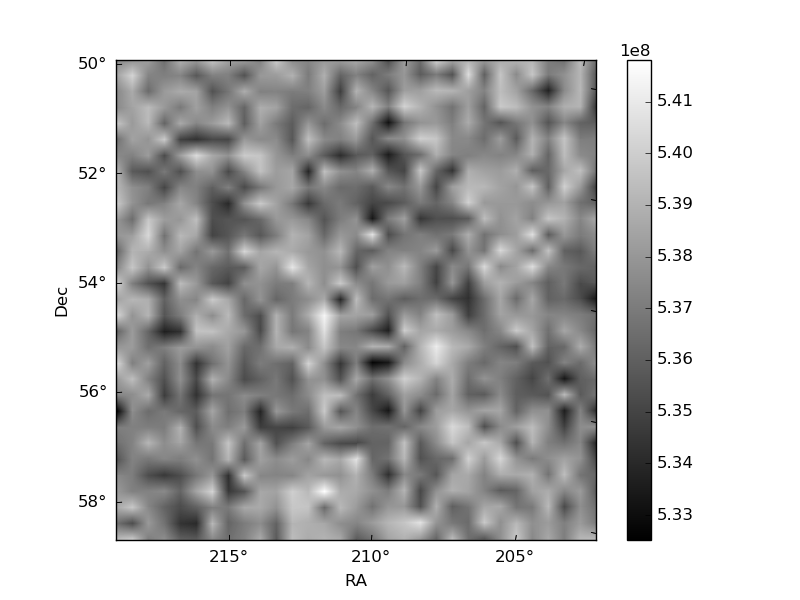
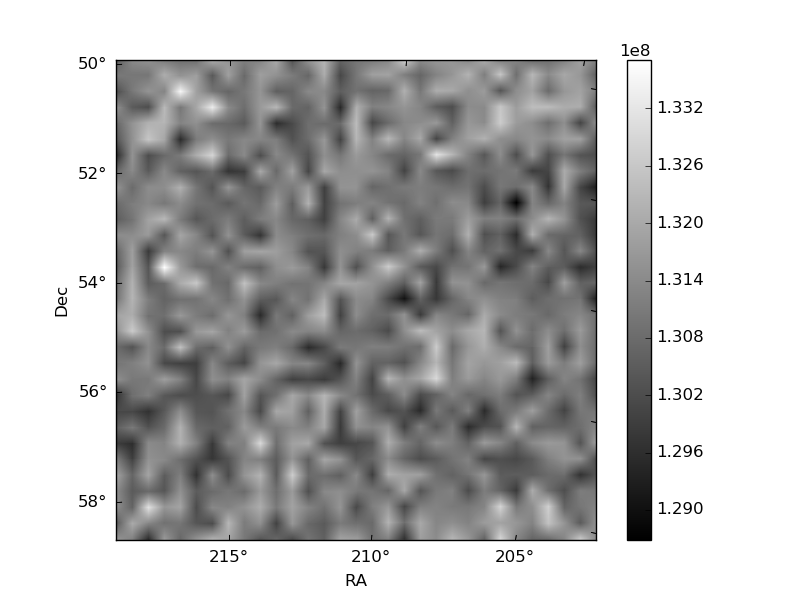
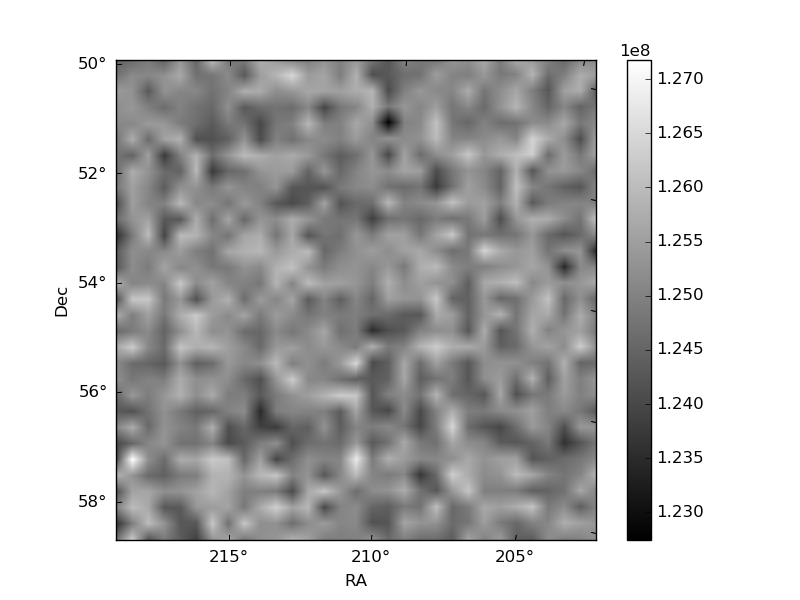
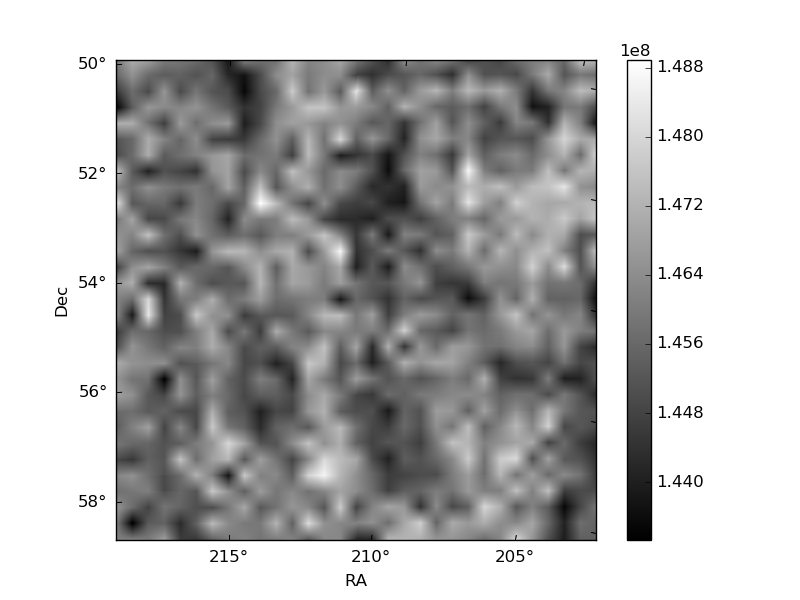
Histogram calculated using DETX and DETY for each event in the final _common_clean file
| Quadrant A | 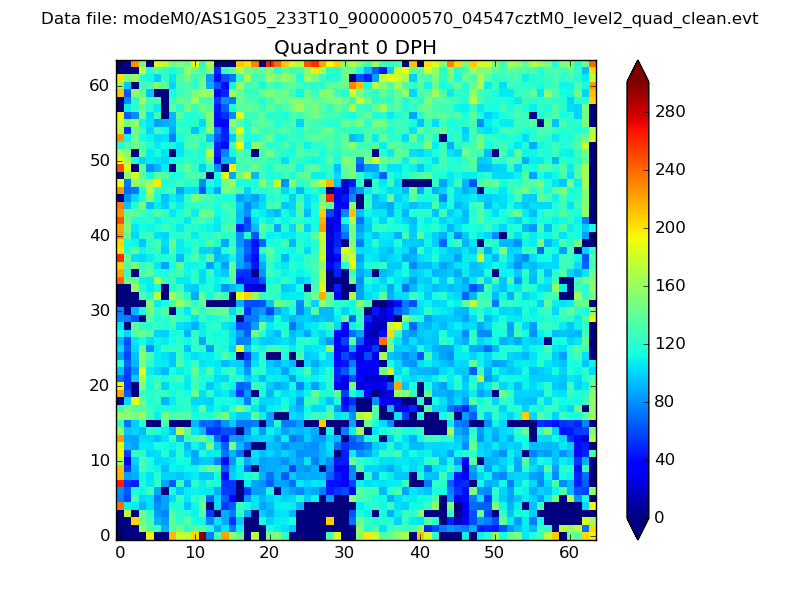 |
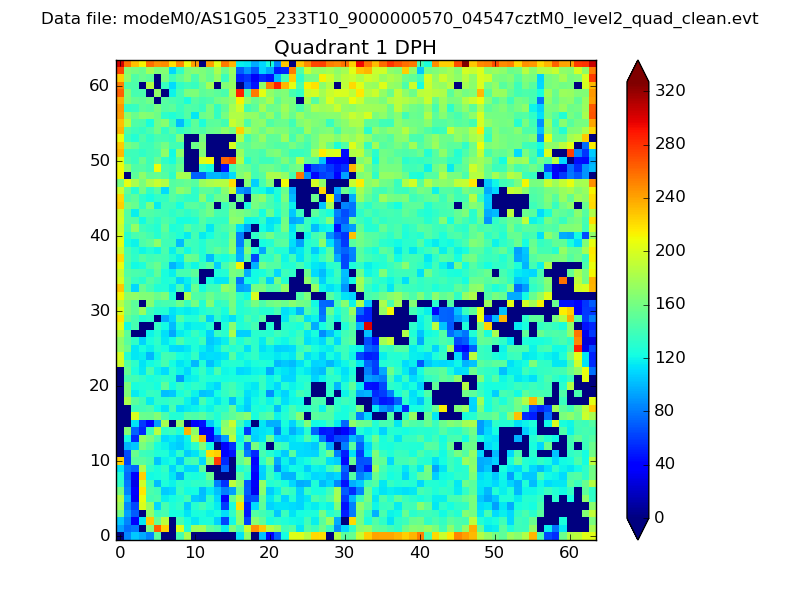 |
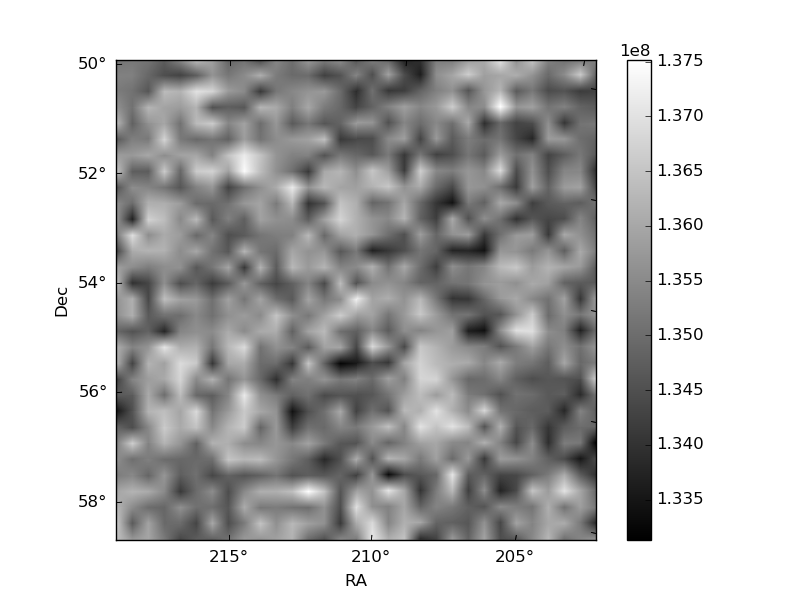
Quadrant B |
|---|---|---|---|
| Quadrant D | 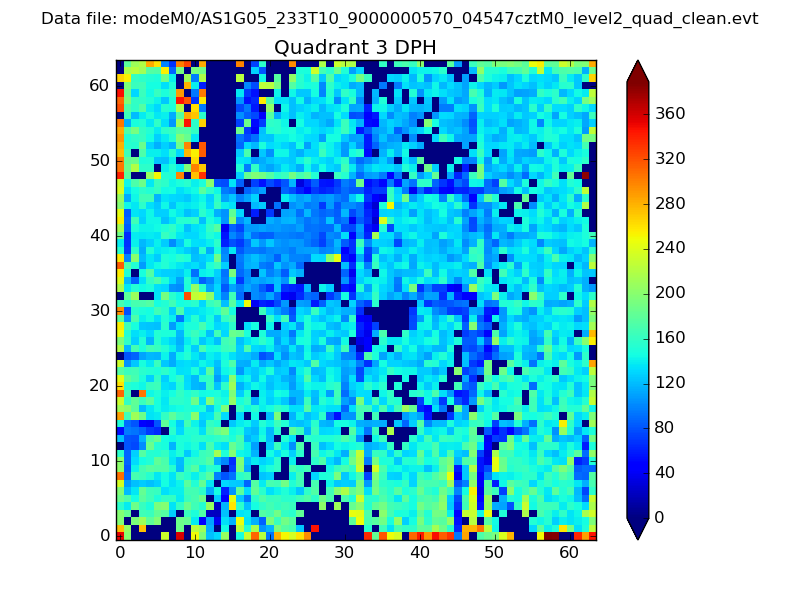 |
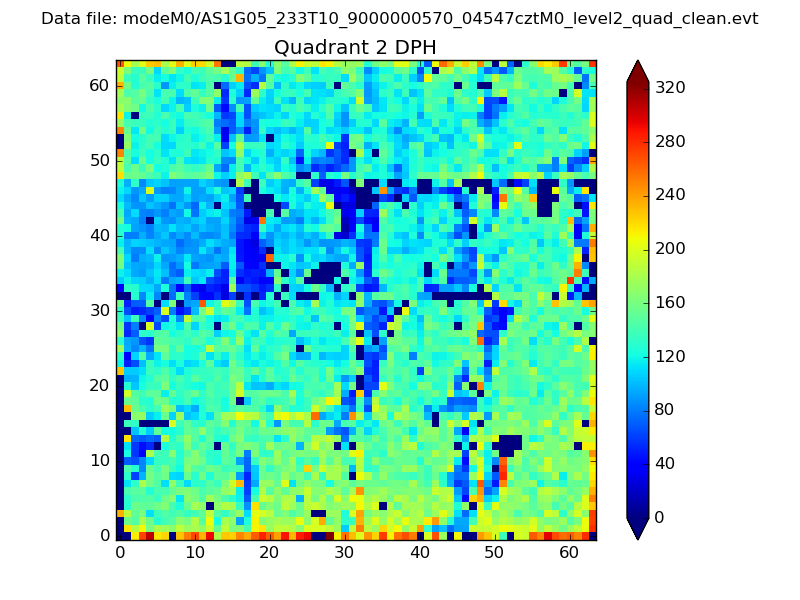 |
Quadrant C |
| Plot type | Count rate plots | Images |
|---|---|---|
| Comparison with Poisson distribution Blue bars denote a histogram of data divided into 1 sec bins. Red curve is a Poisson curve with rate = median count rate of data. |
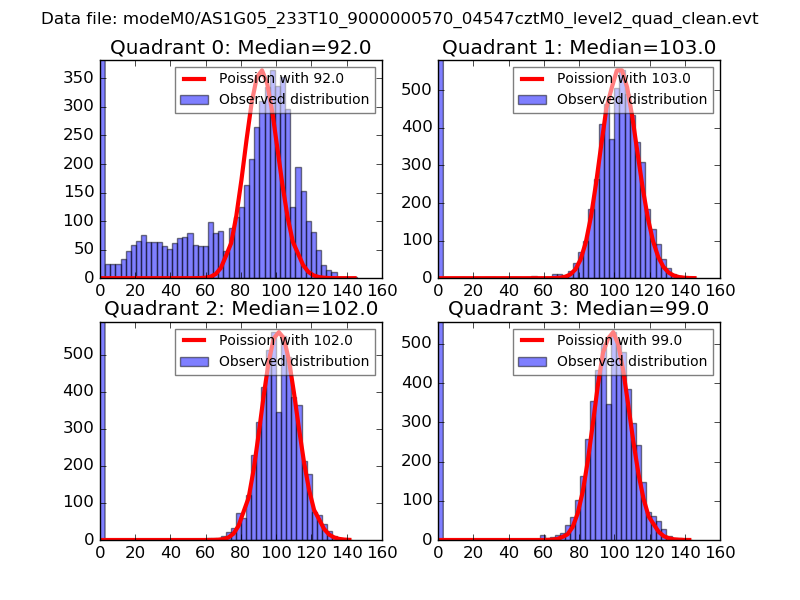 |
 |
| Quadrant-wise count rates Data is divided into 100 sec bins |
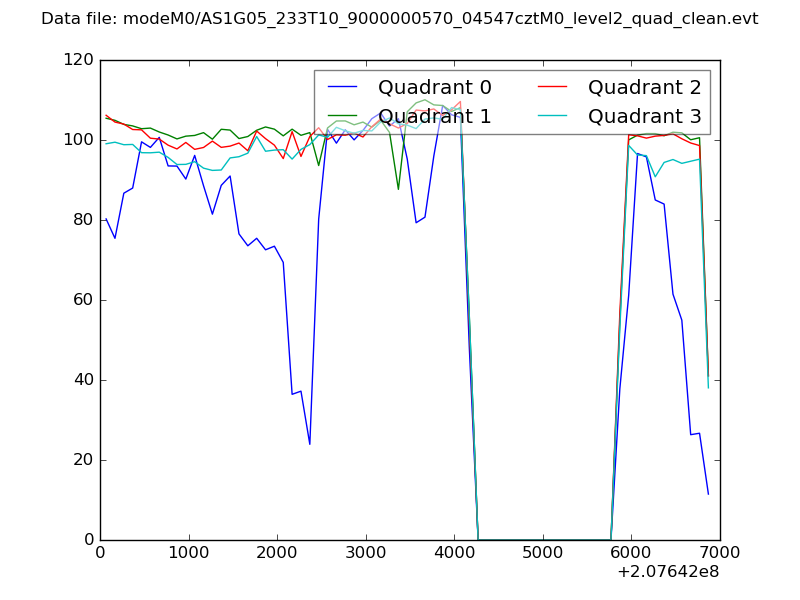 |
|
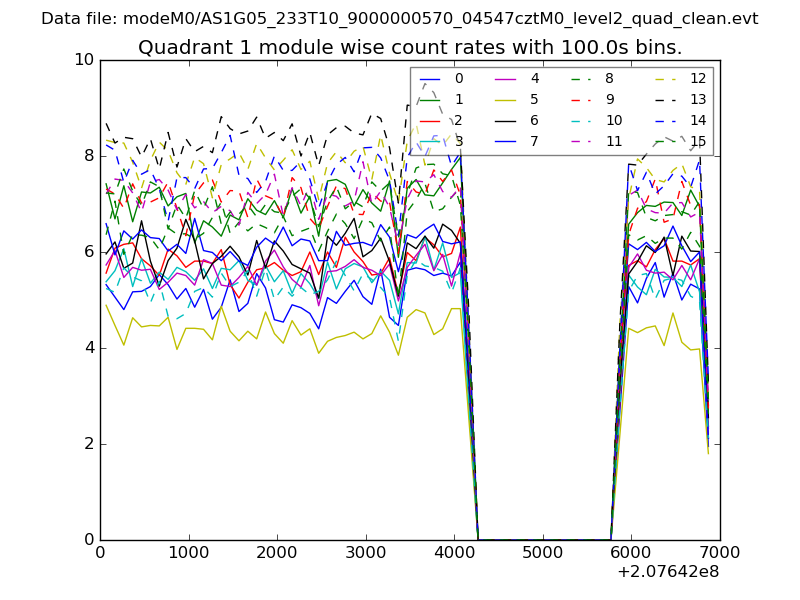
| Module-wise count rates for Quadrant A Data is divided into 100 sec bins |
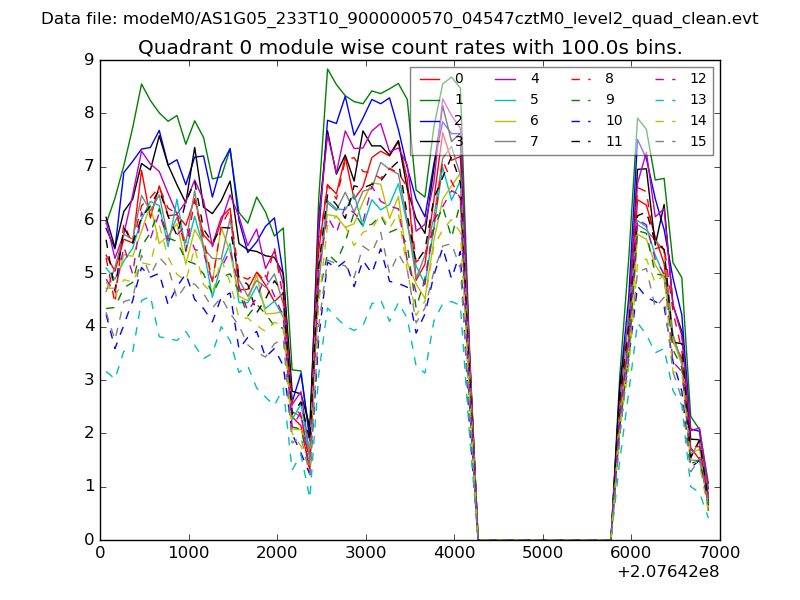 |
 |
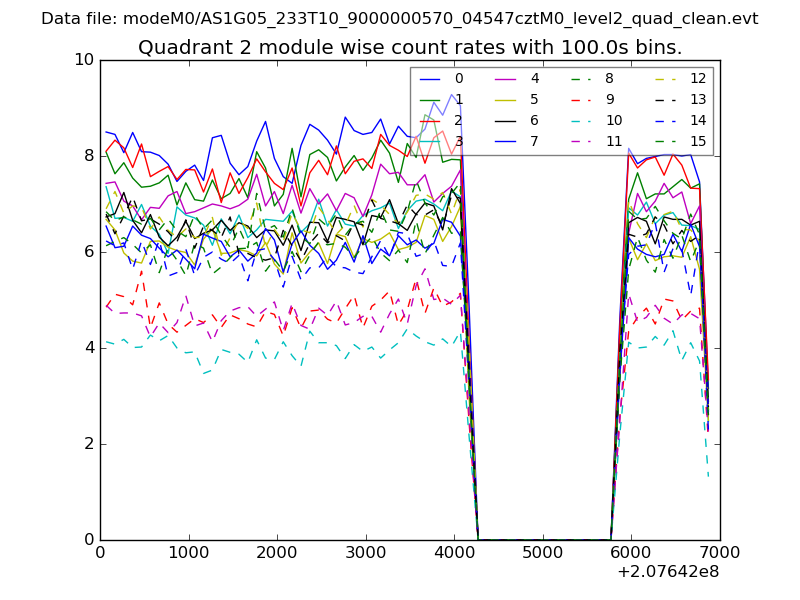
| Module-wise count rates for Quadrant B Data is divided into 100 sec bins |
 |
 |
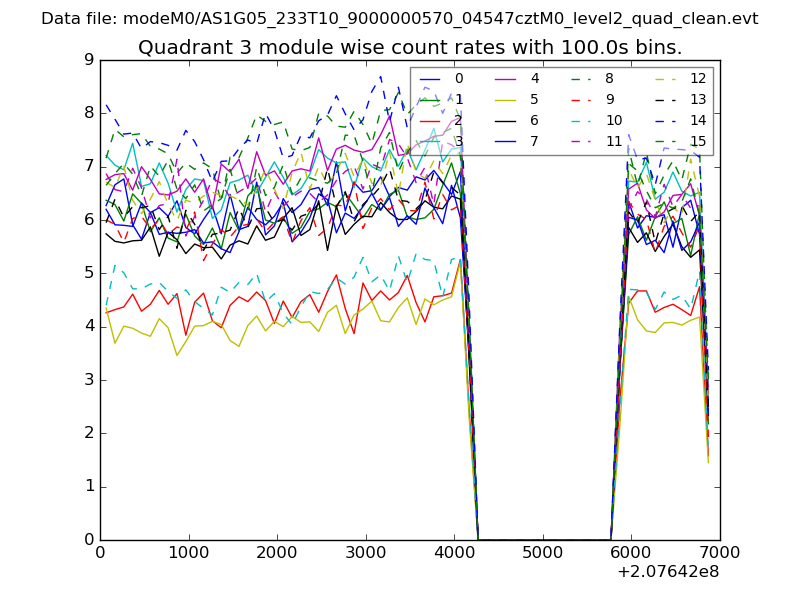
| Module-wise count rates for Quadrant C Data is divided into 100 sec bins |
 |
 |
| Module-wise count rates for Quadrant D Data is divided into 100 sec bins |
 |
 |
| Parameter | Plot |
|---|---|
| CZT HV Monitor | 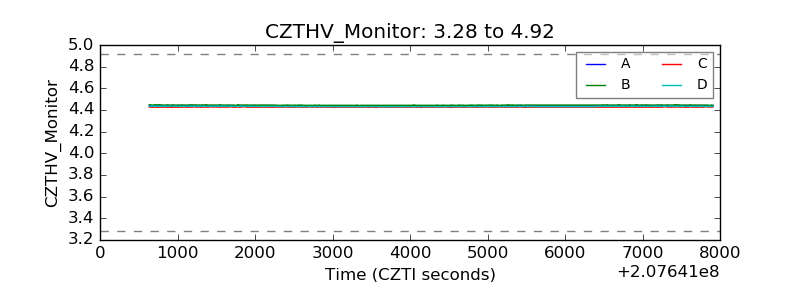 |
| D_VDD | 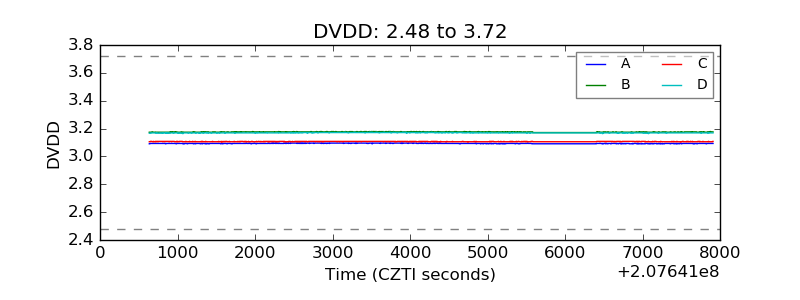 |
| Temperature 1 | 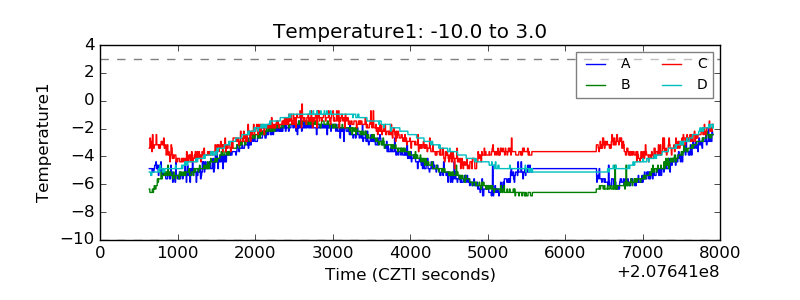 |
| Veto HV Monitor | 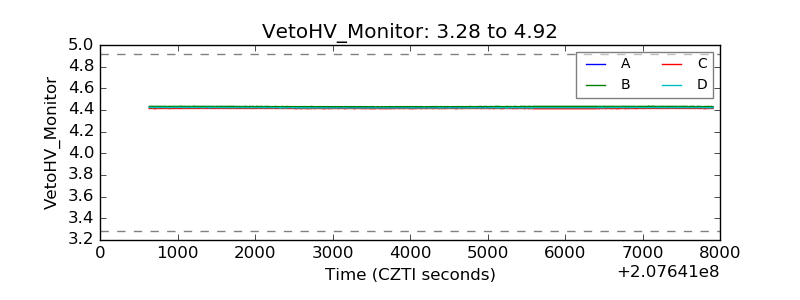 |
| Veto LLD | 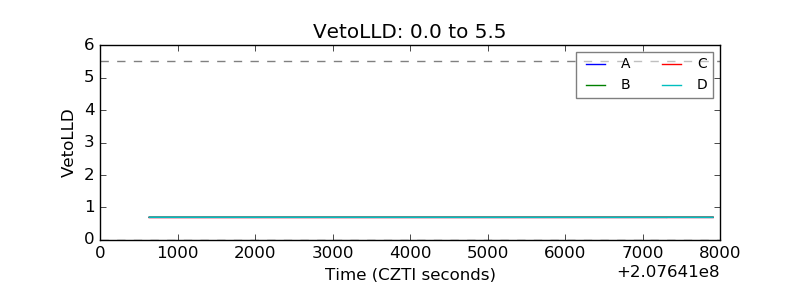 |
| Alpha Counter | 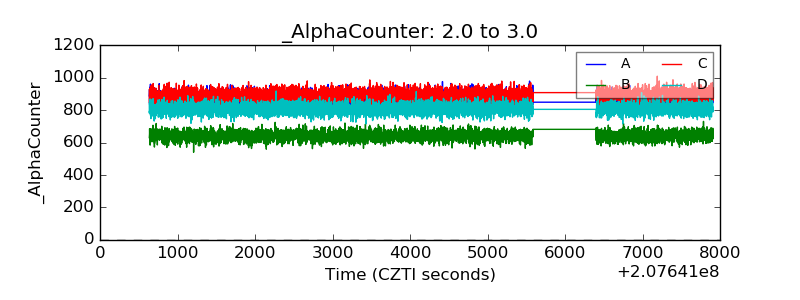 |
| _CPM_Rate | 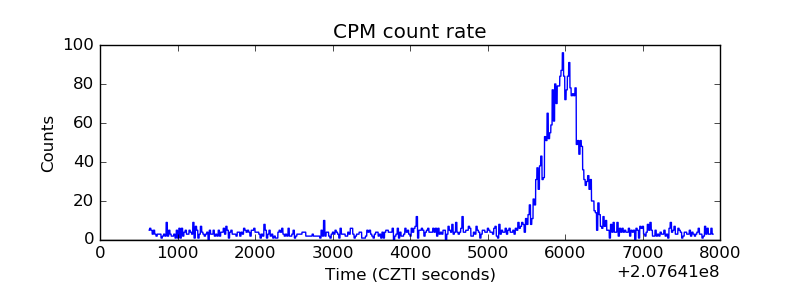 |
| CZT Counter | 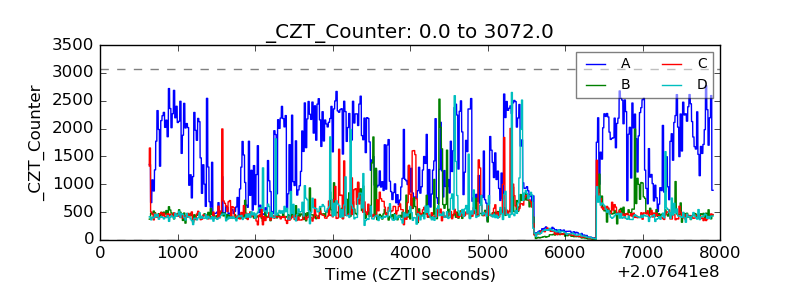 |
| +2.5 Volts monitor |  |
| +5 Volts monitor |  |
| _ROLL_ROT | 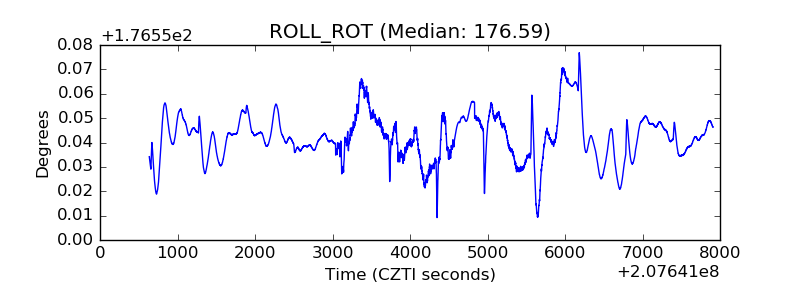 |
| _Roll_DEC | 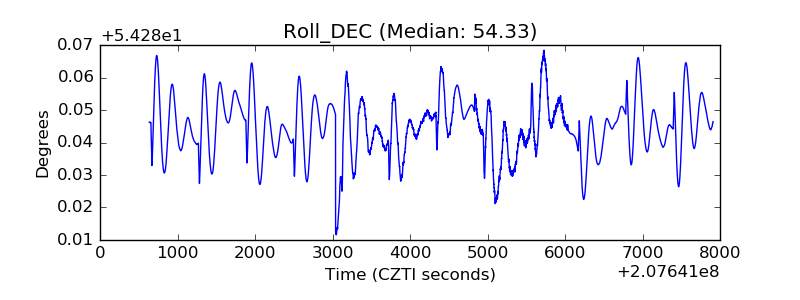 |
| _Roll_RA | 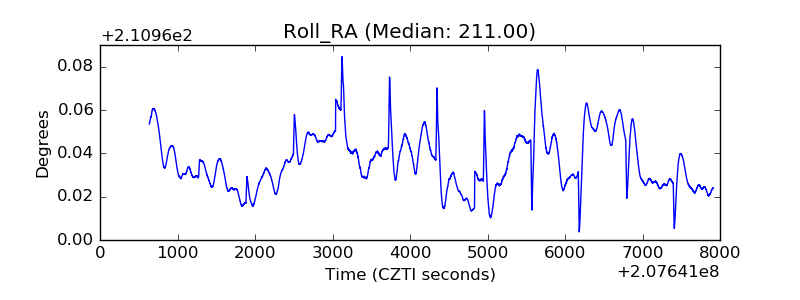 |
| Veto Counter | 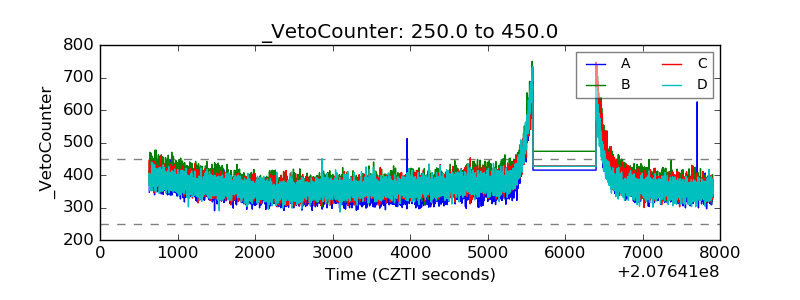 |