| Param | Original file | Final file |
|---|---|---|
| Filename | modeM0/AS1G05_233T10_9000000570_04548cztM0_level2.evt | modeM0/AS1G05_233T10_9000000570_04548cztM0_level2_quad_clean.evt |
| Size (bytes) | 770,880,960 | 83,165,760 |
| Size | 735.2 MB | 79.3 MB |
| Events in quadrant A | 9,036,010 | 426,615 |
| Events in quadrant B | 5,115,087 | 527,816 |
| Events in quadrant C | 4,004,800 | 547,810 |
| Events in quadrant D | 4,719,665 | 530,168 |
| Mode M9 | |||
|---|---|---|---|
| Quadrant | BADHDUFLAG | Total packets | Discarded packets |
| A | 0 | 3 | 0 |
| B | 0 | 3 | 0 |
| C | 0 | 3 | 0 |
| D | 0 | 3 | 0 |
| Mode M0 | |||
|---|---|---|---|
| Quadrant | BADHDUFLAG | Total packets | Discarded packets |
| A | 0 | 31644 | 2 |
| B | 0 | 19814 | 1 |
| C | 0 | 16816 | 1 |
| D | 0 | 19075 | 1 |
| Mode SS | |||
|---|---|---|---|
| Quadrant | BADHDUFLAG | Total packets | Discarded packets |
| A | 0 | 140 | 0 |
| B | 0 | 140 | 0 |
| C | 0 | 140 | 0 |
| D | 0 | 140 | 0 |
| Quadrant | Total seconds | Saturated seconds | Saturation percentage |
|---|---|---|---|
| A | 6962 | 2564 | 36.828498% |
| B | 6962 | 764 | 10.973858% |
| C | 6962 | 218 | 3.131284% |
| D | 6962 | 301 | 4.323470% |
Noise dominated data is calculated using 1-second bins in cleaned event files. If a bin has >2000 counts, and if more than 50% of those come from <1% of pixels, then it is considered to be noise-dominated and hence unusable.
| Quadrant | # 1 sec bins | Bins with >0 counts | Bins with >2000 counts | High rate bins dominated by noise | Noise dominated (total time) | Noise dominated (detector-on time) | Marked lightcurve |
|---|---|---|---|---|---|---|---|
| A | 7272 | 6961 | 1388 | 1388 | 19.09% | 19.94% | 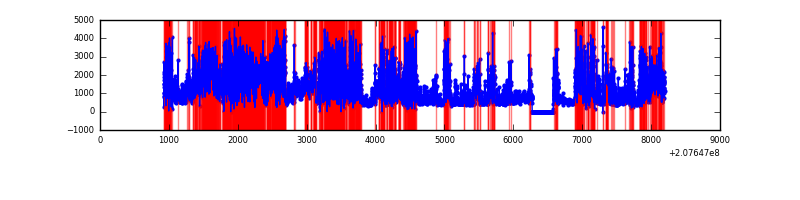 |
| B | 7272 | 6963 | 467 | 467 | 6.42% | 6.71% | 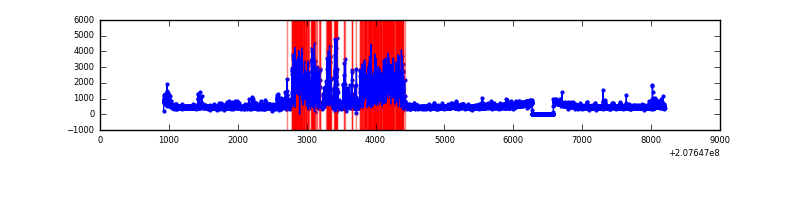 |
| C | 7272 | 6963 | 93 | 93 | 1.28% | 1.34% | 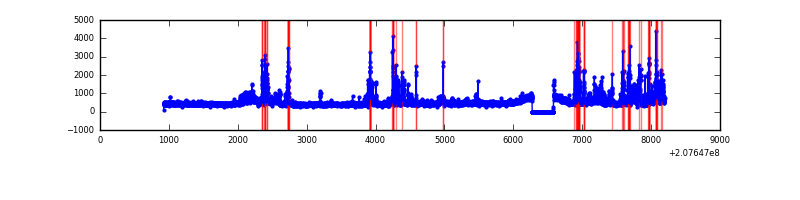 |
| D | 7272 | 6963 | 87 | 87 | 1.20% | 1.25% | 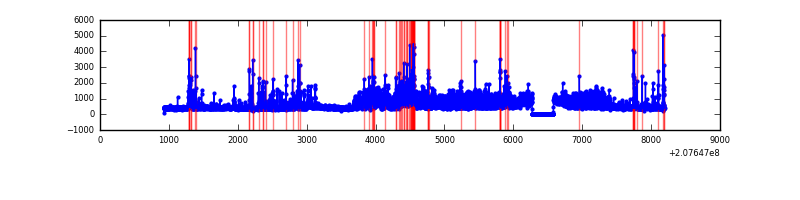 |
Top three noisy pixels from each quadrant. If the there are fewer than three noisy pixels in the level2.evt file, extra rows are filled as -1
| Pixel properties | Quadrant properties | ||||||
|---|---|---|---|---|---|---|---|
| Quadrant | DetID | PixID | Counts | Sigma | Mean | Median | Sigma |
| A | 0 | 13 | 6349912 | 46220.67 | 666 | 648 | 137.4 |
| A | 8 | 15 | 36887 | 263.81 | 666 | 648 | 137.4 |
| A | 15 | 234 | 26475 | 188.01 | 666 | 648 | 137.4 |
| B | 10 | 16 | 1657593 | 11141.14 | 775 | 755 | 148.7 |
| B | 15 | 204 | 258360 | 1732.22 | 775 | 755 | 148.7 |
| B | 8 | 3 | 36307 | 239.06 | 775 | 755 | 148.7 |
| C | 14 | 48 | 865861 | 4816.51 | 771 | 770 | 179.6 |
| C | 9 | 247 | 125300 | 693.34 | 771 | 770 | 179.6 |
| C | 13 | 61 | 6465 | 31.71 | 771 | 770 | 179.6 |
| D | 13 | 106 | 1185911 | 6389.87 | 769 | 745 | 185.5 |
| D | 13 | 235 | 267389 | 1437.62 | 769 | 745 | 185.5 |
| D | 2 | 136 | 156728 | 840.99 | 769 | 745 | 185.5 |
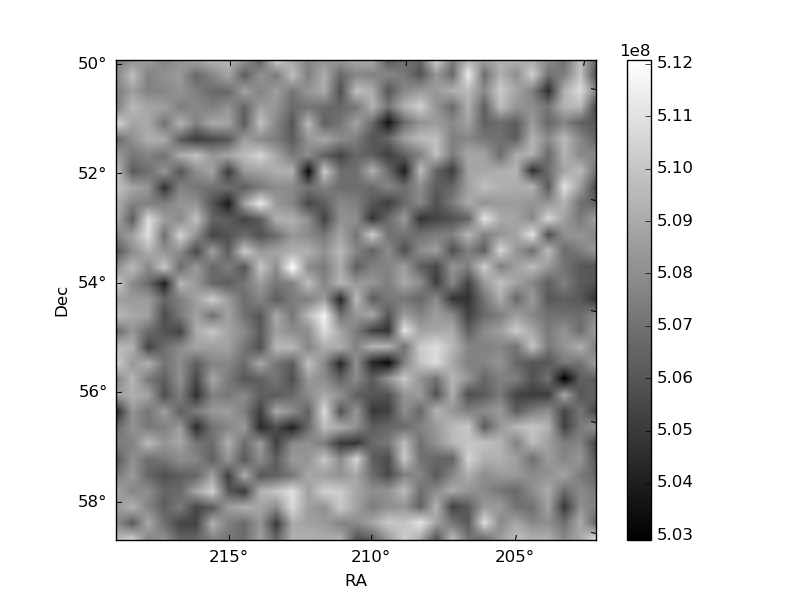
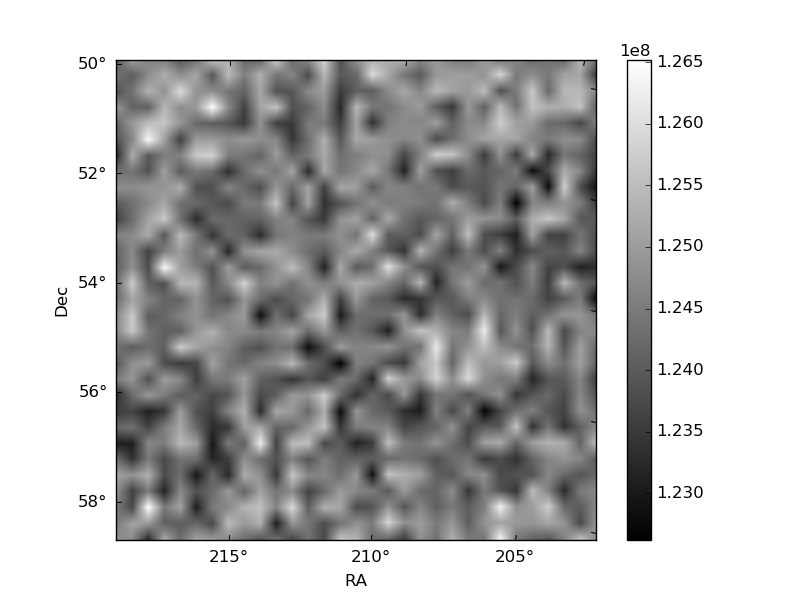
Histogram calculated using DETX and DETY for each event in the final _common_clean file
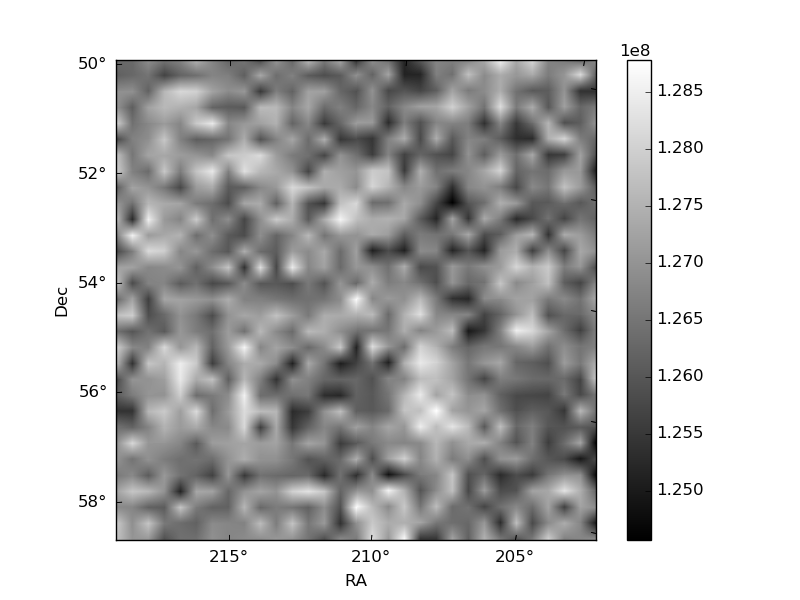
| Quadrant A | 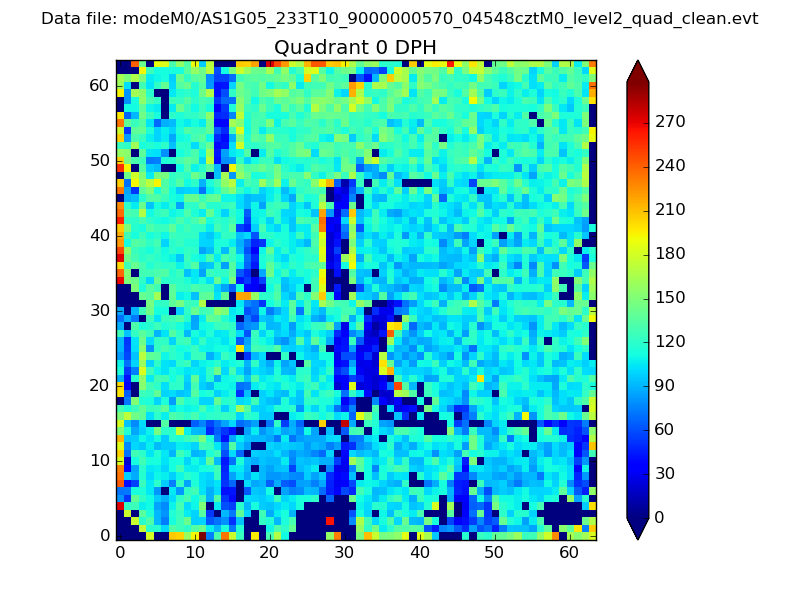 |
 |
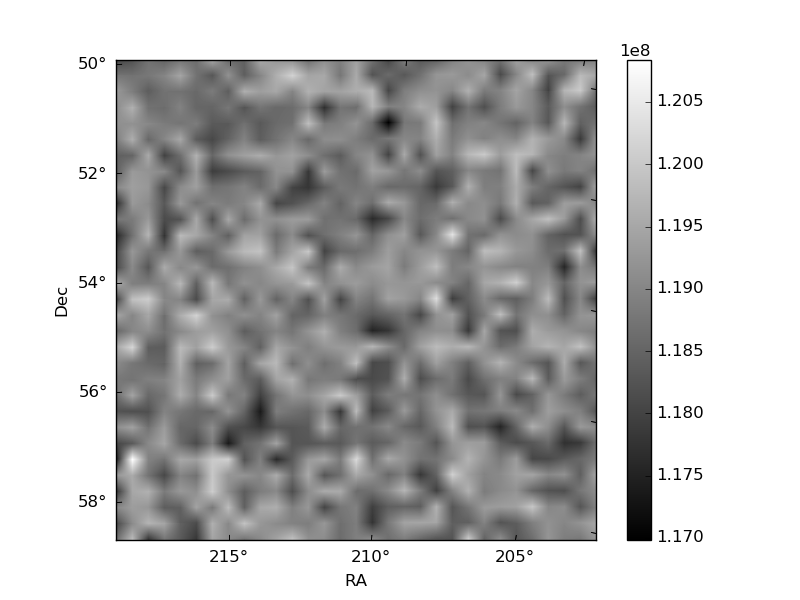
Quadrant B |
|---|---|---|---|
| Quadrant D | 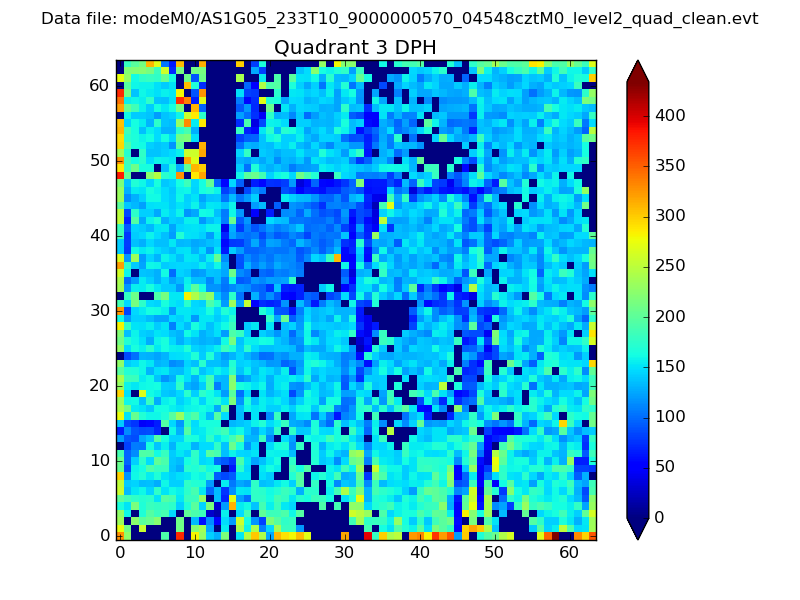 |
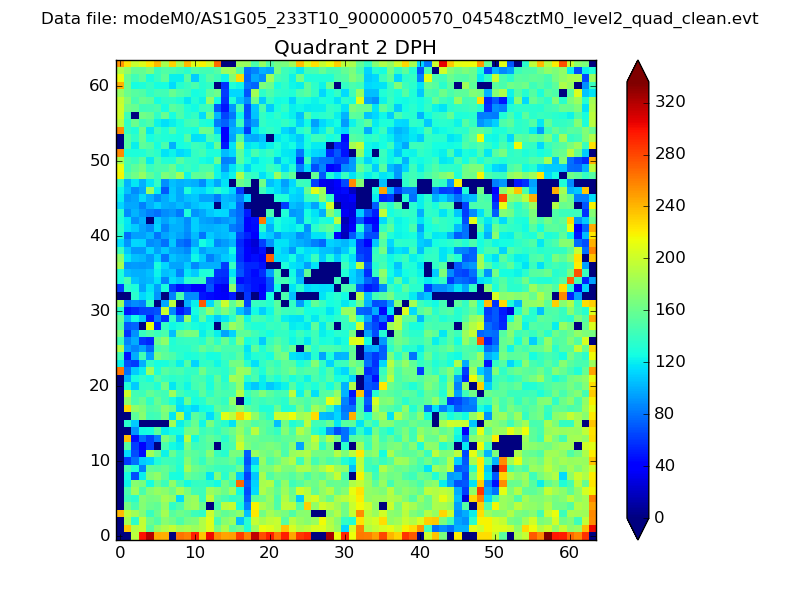 |
Quadrant C |
| Plot type | Count rate plots | Images |
|---|---|---|
| Comparison with Poisson distribution Blue bars denote a histogram of data divided into 1 sec bins. Red curve is a Poisson curve with rate = median count rate of data. |
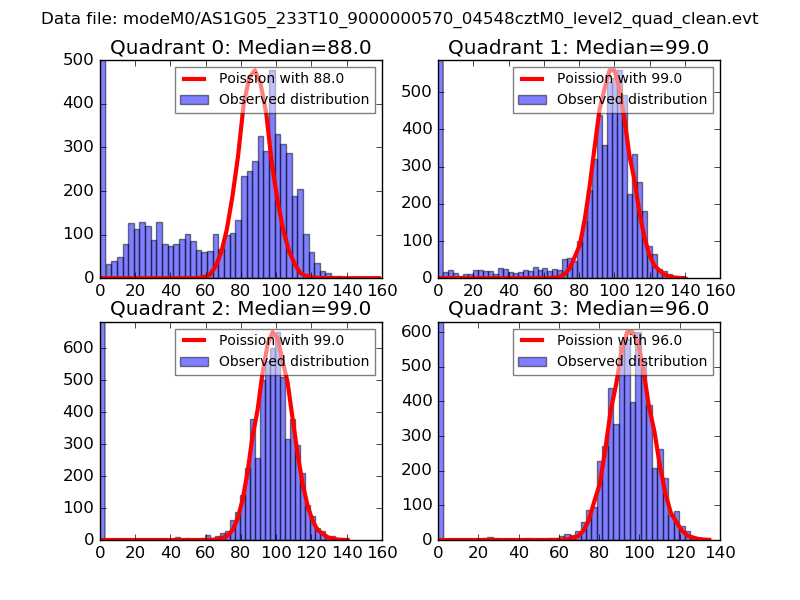 |
 |
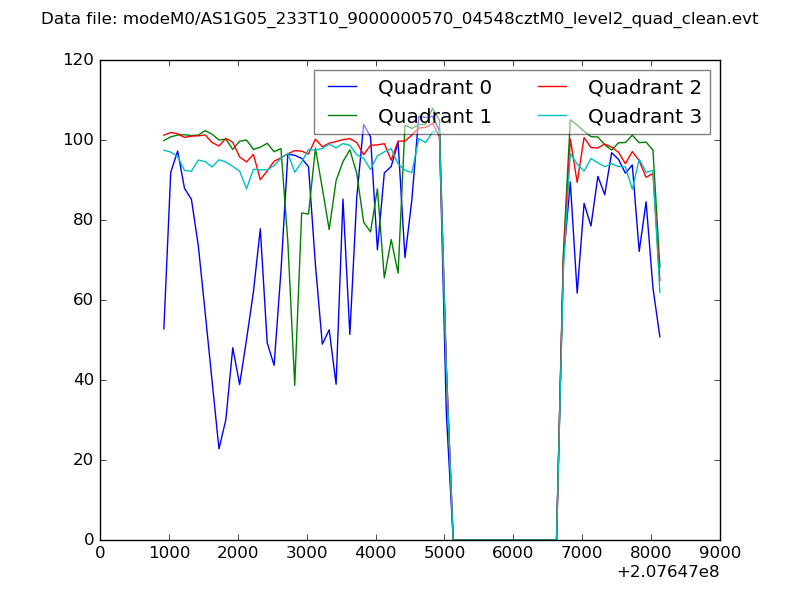
| Quadrant-wise count rates Data is divided into 100 sec bins |
 |
|
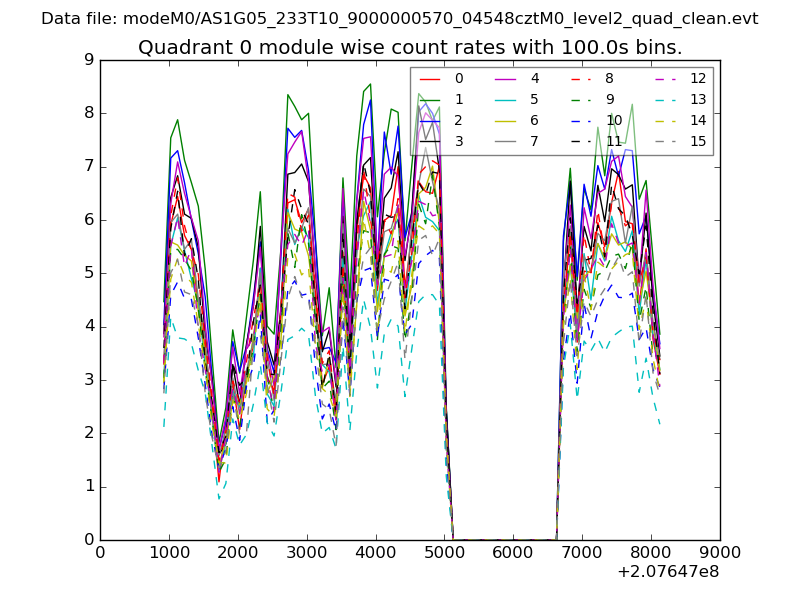
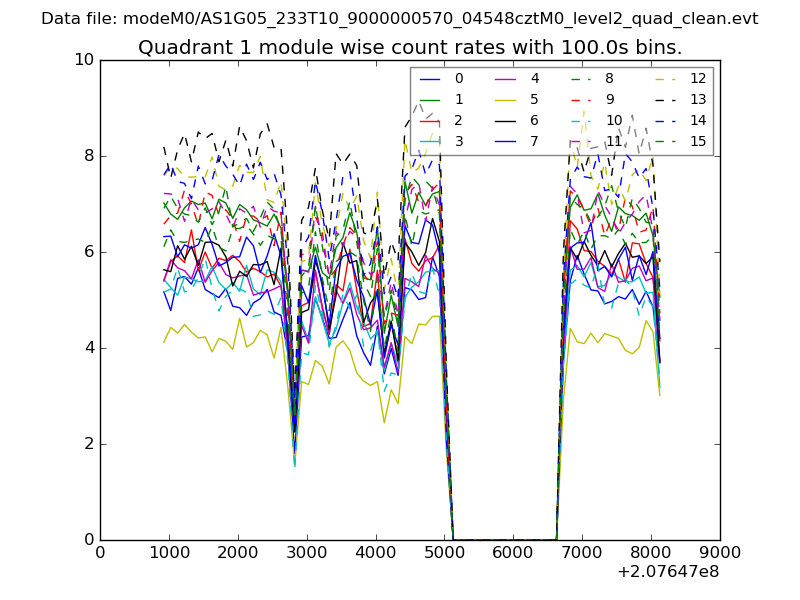
| Module-wise count rates for Quadrant A Data is divided into 100 sec bins |
 |
 |
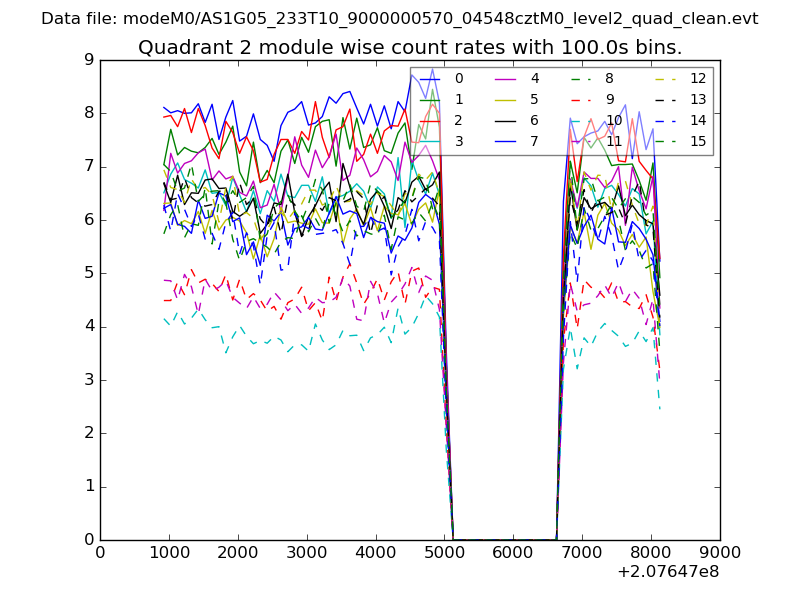
| Module-wise count rates for Quadrant B Data is divided into 100 sec bins |
 |
 |
| Module-wise count rates for Quadrant C Data is divided into 100 sec bins |
 |
 |
| Module-wise count rates for Quadrant D Data is divided into 100 sec bins |
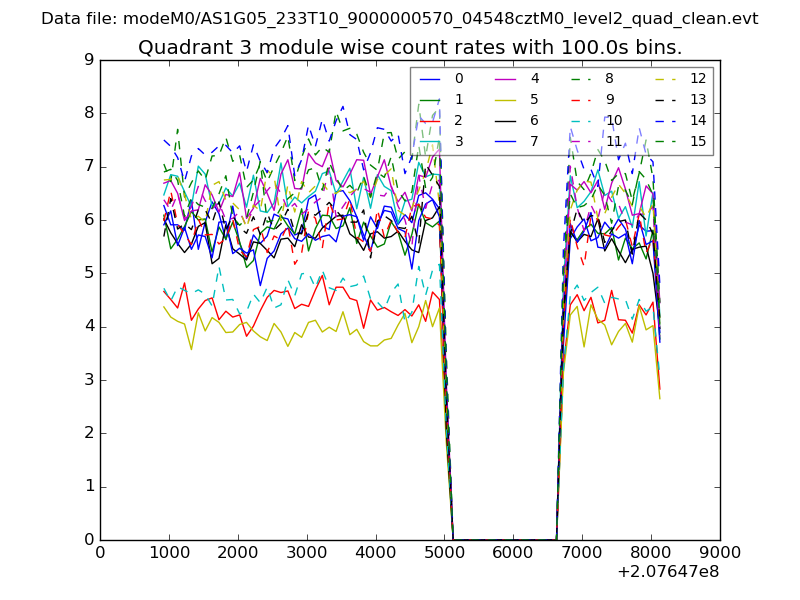 |
 |
| Parameter | Plot |
|---|---|
| CZT HV Monitor | 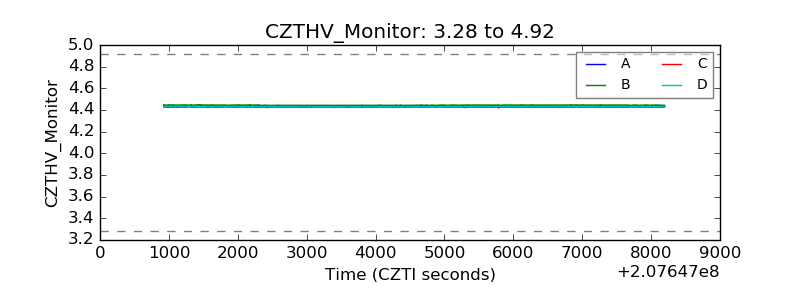 |
| D_VDD | 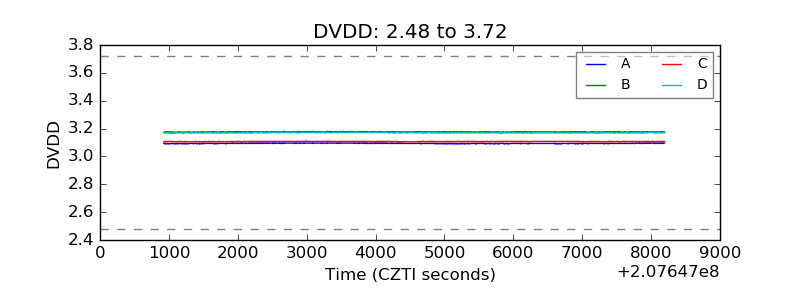 |
| Temperature 1 | 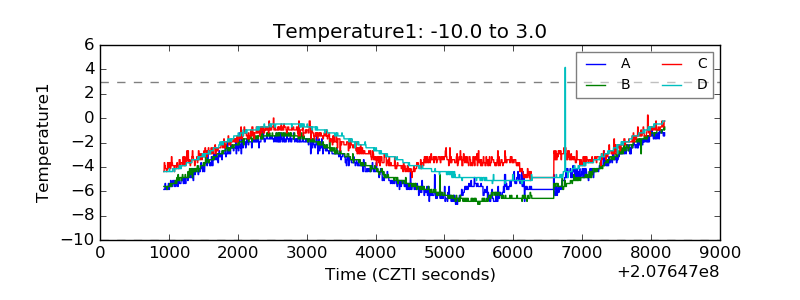 |
| Veto HV Monitor | 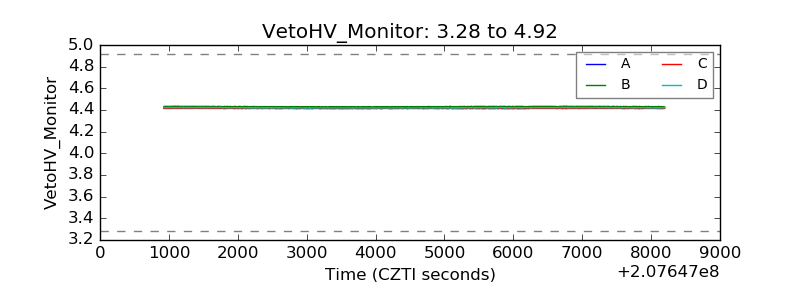 |
| Veto LLD | 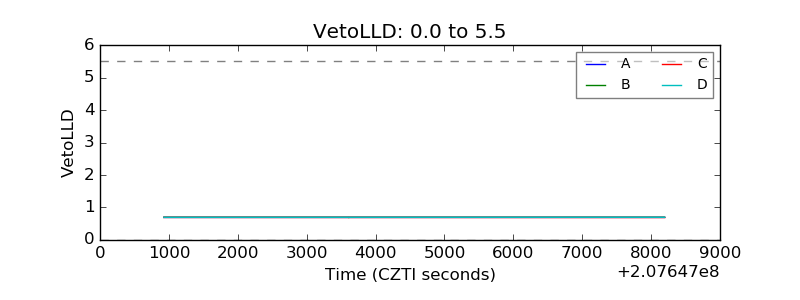 |
| Alpha Counter | 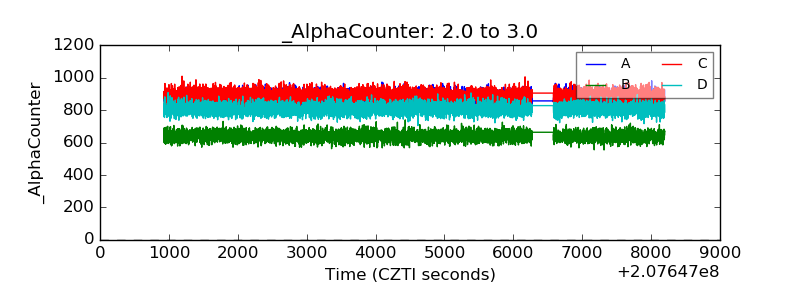 |
| _CPM_Rate | 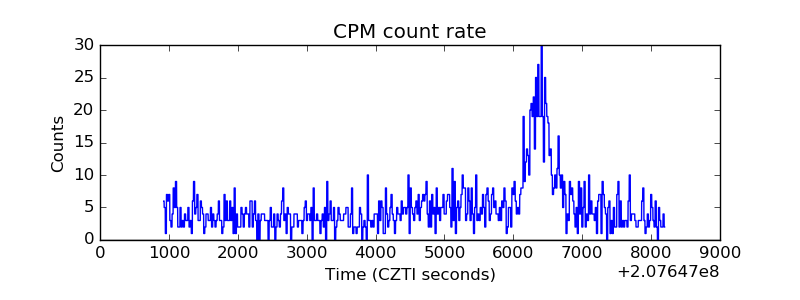 |
| CZT Counter | 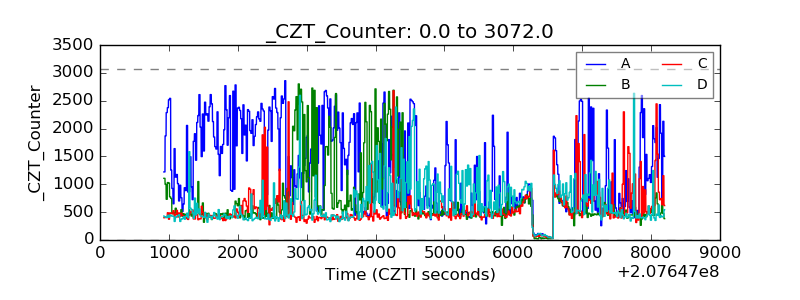 |
| +2.5 Volts monitor |  |
| +5 Volts monitor | 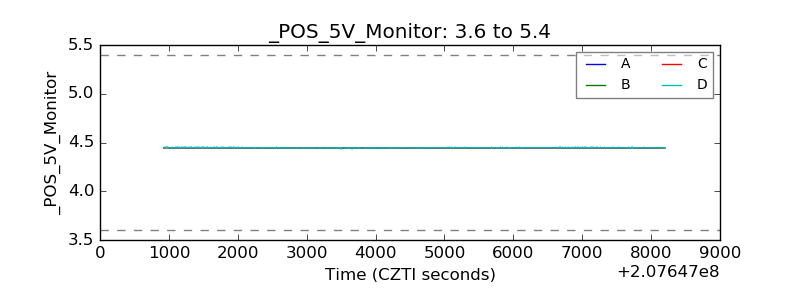 |
| _ROLL_ROT | 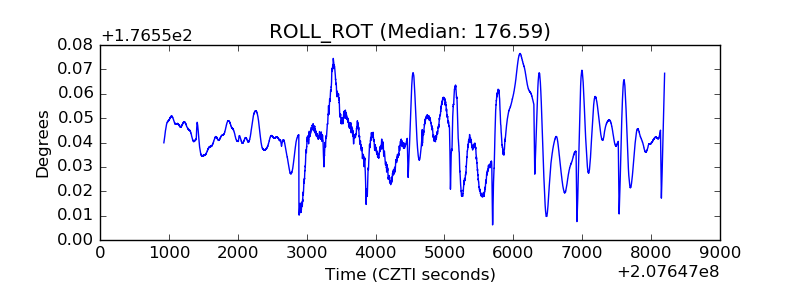 |
| _Roll_DEC | 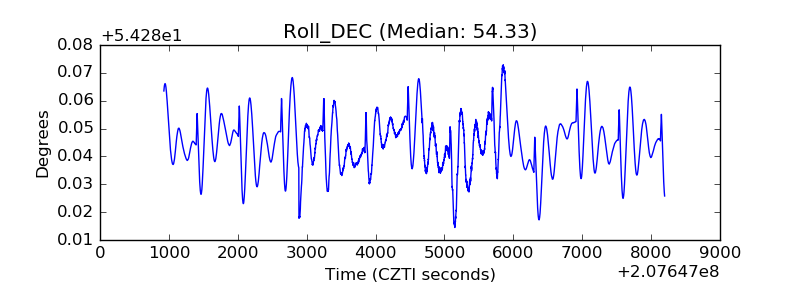 |
| _Roll_RA | 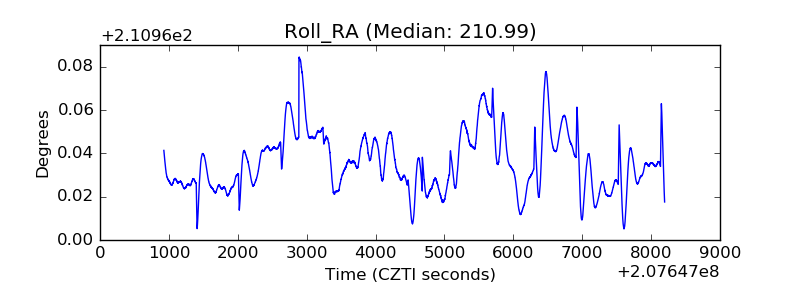 |
| Veto Counter | 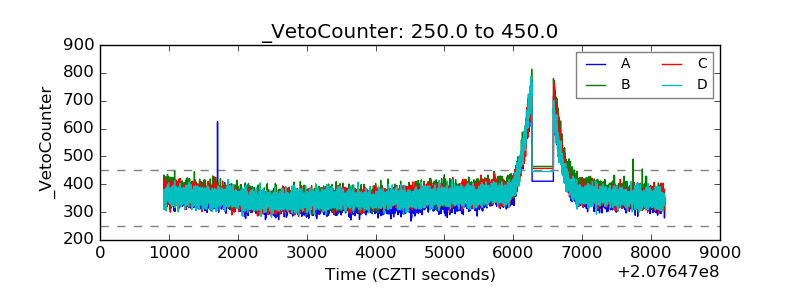 |