| Param | Original file | Final file |
|---|---|---|
| Filename | modeM0/AS1G05_233T10_9000000570_04549cztM0_level2.evt | modeM0/AS1G05_233T10_9000000570_04549cztM0_level2_quad_clean.evt |
| Size (bytes) | 701,363,520 | 87,088,320 |
| Size | 668.9 MB | 83.1 MB |
| Events in quadrant A | 7,770,275 | 467,426 |
| Events in quadrant B | 3,780,170 | 565,903 |
| Events in quadrant C | 4,266,777 | 557,323 |
| Events in quadrant D | 4,926,167 | 534,293 |
| Mode M9 | |||
|---|---|---|---|
| Quadrant | BADHDUFLAG | Total packets | Discarded packets |
| A | 0 | 1 | 0 |
| B | 0 | 1 | 0 |
| C | 0 | 1 | 0 |
| D | 0 | 1 | 0 |
| Mode M0 | |||
|---|---|---|---|
| Quadrant | BADHDUFLAG | Total packets | Discarded packets |
| A | 0 | 28102 | 2 |
| B | 0 | 16002 | 1 |
| C | 0 | 17809 | 1 |
| D | 0 | 19978 | 1 |
| Mode SS | |||
|---|---|---|---|
| Quadrant | BADHDUFLAG | Total packets | Discarded packets |
| A | 0 | 148 | 0 |
| B | 0 | 148 | 0 |
| C | 0 | 148 | 0 |
| D | 0 | 148 | 0 |
| Quadrant | Total seconds | Saturated seconds | Saturation percentage |
|---|---|---|---|
| A | 7348 | 1956 | 26.619488% |
| B | 7348 | 112 | 1.524224% |
| C | 7348 | 147 | 2.000544% |
| D | 7348 | 387 | 5.266739% |
Noise dominated data is calculated using 1-second bins in cleaned event files. If a bin has >2000 counts, and if more than 50% of those come from <1% of pixels, then it is considered to be noise-dominated and hence unusable.
| Quadrant | # 1 sec bins | Bins with >0 counts | Bins with >2000 counts | High rate bins dominated by noise | Noise dominated (total time) | Noise dominated (detector-on time) | Marked lightcurve |
|---|---|---|---|---|---|---|---|
| A | 7433 | 7348 | 657 | 657 | 8.84% | 8.94% | 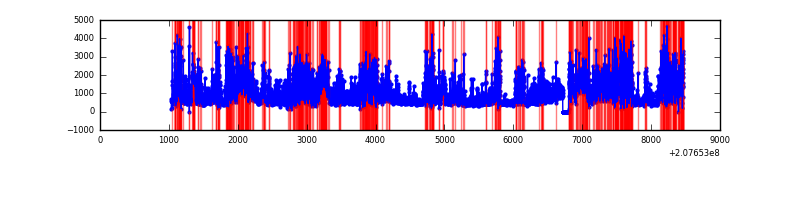 |
| B | 7433 | 7349 | 16 | 16 | 0.22% | 0.22% | 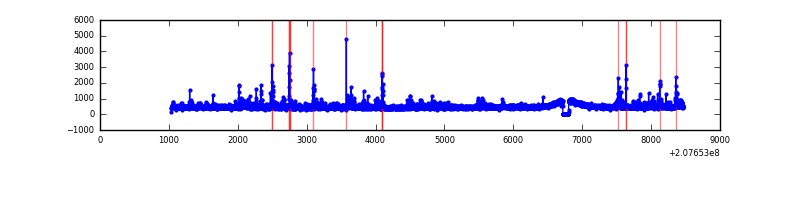 |
| C | 7433 | 7349 | 82 | 82 | 1.10% | 1.12% | 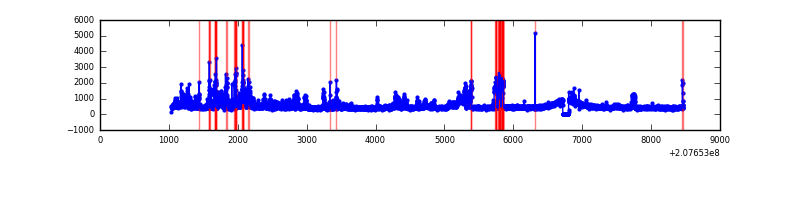 |
| D | 7433 | 7348 | 178 | 178 | 2.39% | 2.42% | 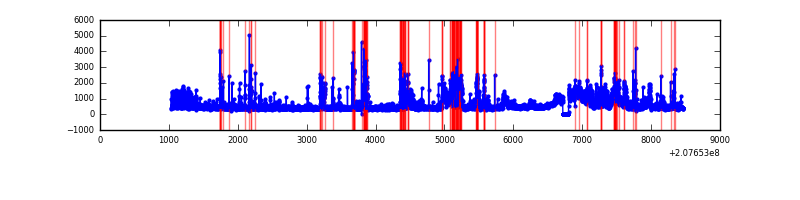 |
Top three noisy pixels from each quadrant. If the there are fewer than three noisy pixels in the level2.evt file, extra rows are filled as -1
| Pixel properties | Quadrant properties | ||||||
|---|---|---|---|---|---|---|---|
| Quadrant | DetID | PixID | Counts | Sigma | Mean | Median | Sigma |
| A | 0 | 13 | 4677912 | 30166.57 | 749 | 730 | 155.0 |
| A | 15 | 234 | 75206 | 480.35 | 749 | 730 | 155.0 |
| A | 0 | 118 | 66858 | 426.51 | 749 | 730 | 155.0 |
| B | 15 | 204 | 124795 | 757.86 | 853 | 829 | 163.6 |
| B | 15 | 54 | 89126 | 539.8 | 853 | 829 | 163.6 |
| B | 10 | 16 | 77661 | 469.71 | 853 | 829 | 163.6 |
| C | 14 | 48 | 877737 | 4600.71 | 819 | 822 | 190.6 |
| C | 9 | 247 | 165677 | 864.91 | 819 | 822 | 190.6 |
| C | 9 | 54 | 8657 | 41.11 | 819 | 822 | 190.6 |
| D | 9 | 35 | 1048922 | 5250.17 | 816 | 790 | 199.6 |
| D | 13 | 106 | 208880 | 1042.34 | 816 | 790 | 199.6 |
| D | 1 | 20 | 193838 | 966.99 | 816 | 790 | 199.6 |
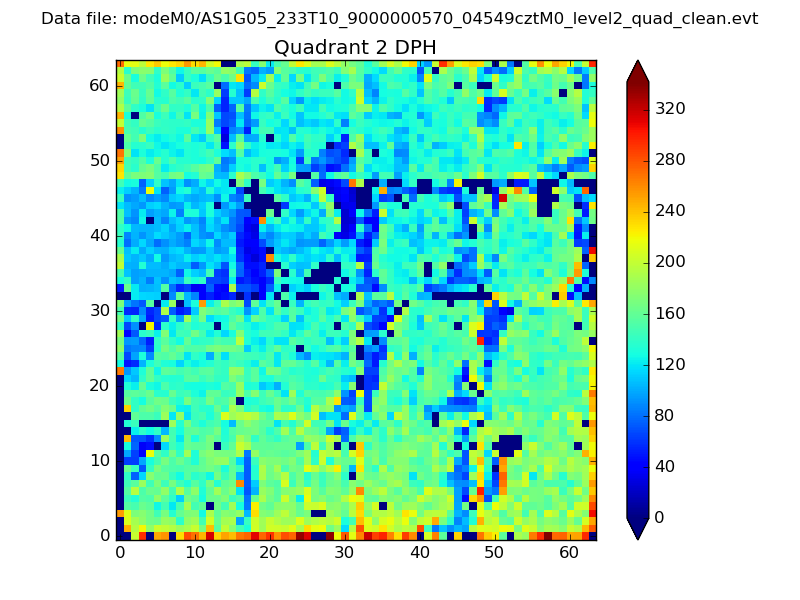
Histogram calculated using DETX and DETY for each event in the final _common_clean file
| Quadrant A | 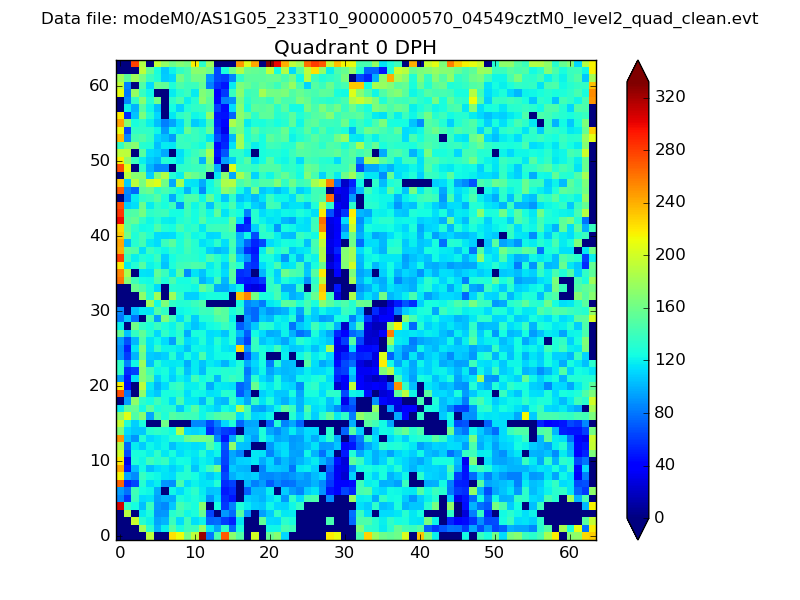 |
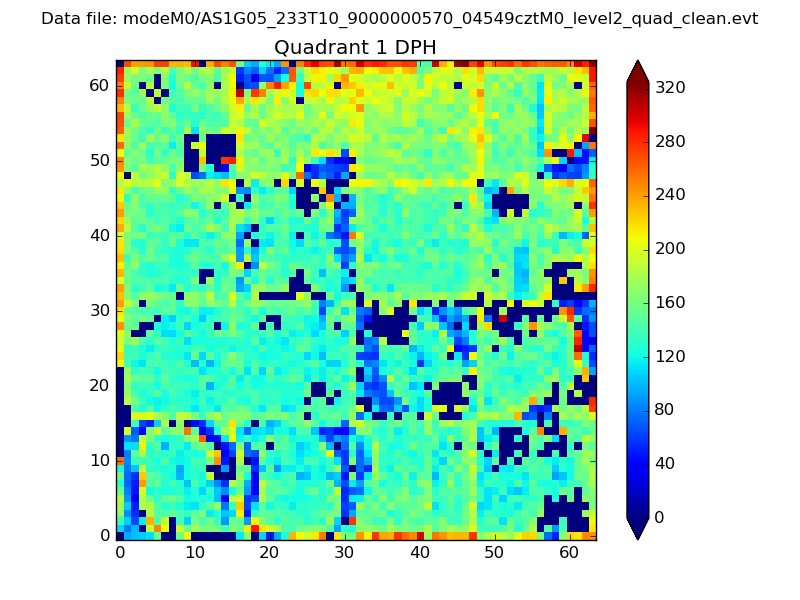 |
Quadrant B |
|---|---|---|---|
| Quadrant D | 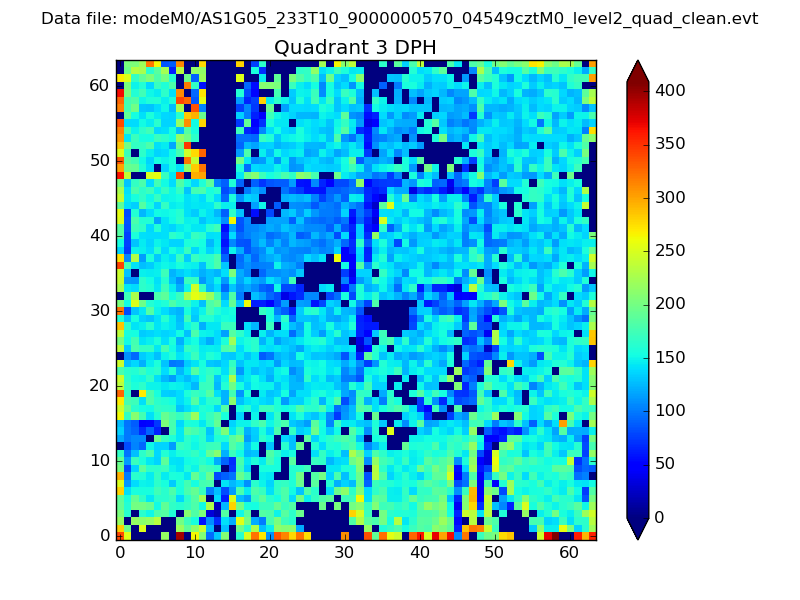 |
 |
Quadrant C |
| Plot type | Count rate plots | Images |
|---|---|---|
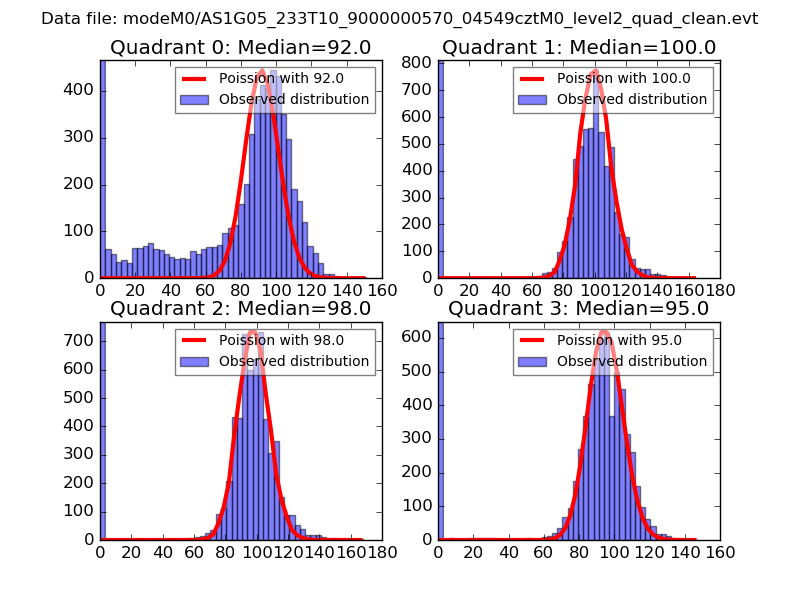
| Comparison with Poisson distribution Blue bars denote a histogram of data divided into 1 sec bins. Red curve is a Poisson curve with rate = median count rate of data. |
 |
 |
| Quadrant-wise count rates Data is divided into 100 sec bins |
 |
|
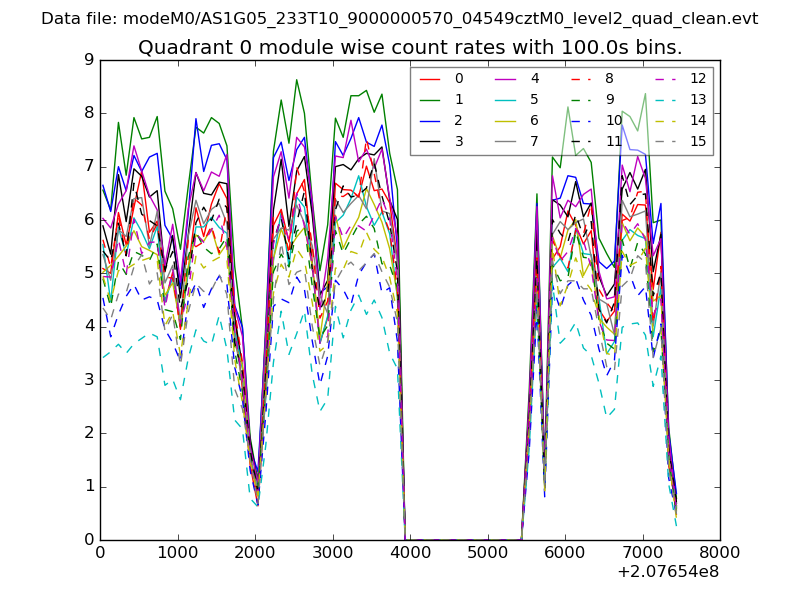
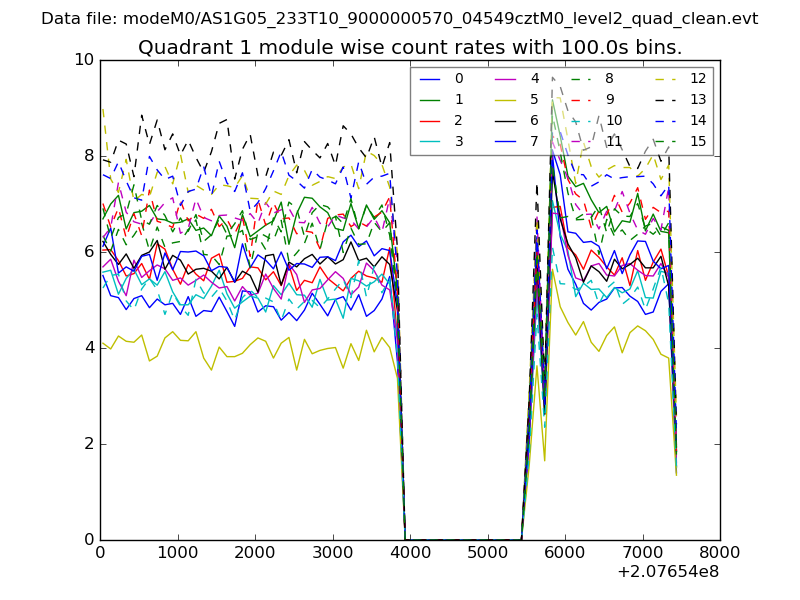
| Module-wise count rates for Quadrant A Data is divided into 100 sec bins |
 |
 |
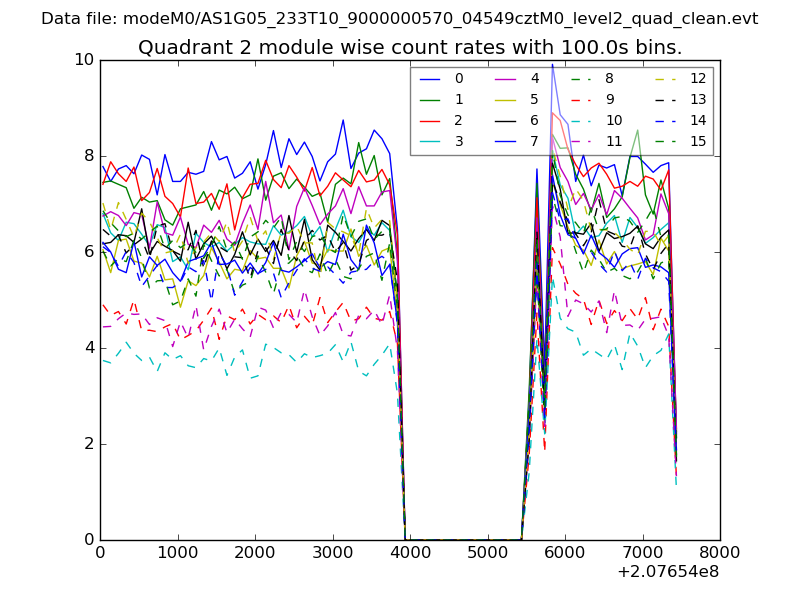
| Module-wise count rates for Quadrant B Data is divided into 100 sec bins |
 |
 |
| Module-wise count rates for Quadrant C Data is divided into 100 sec bins |
 |
 |
| Module-wise count rates for Quadrant D Data is divided into 100 sec bins |
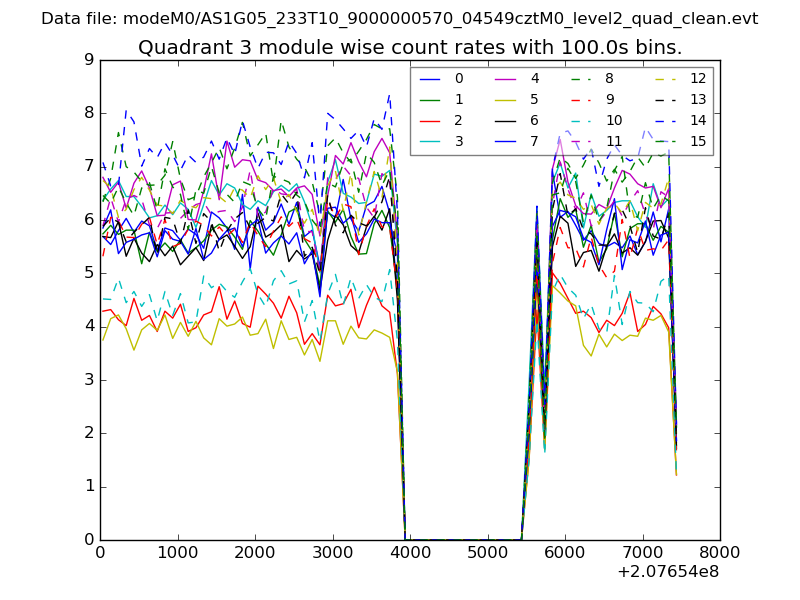 |
 |
| Parameter | Plot |
|---|---|
| CZT HV Monitor | 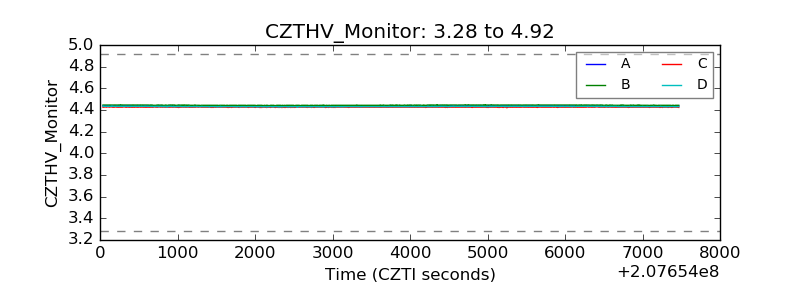 |
| D_VDD | 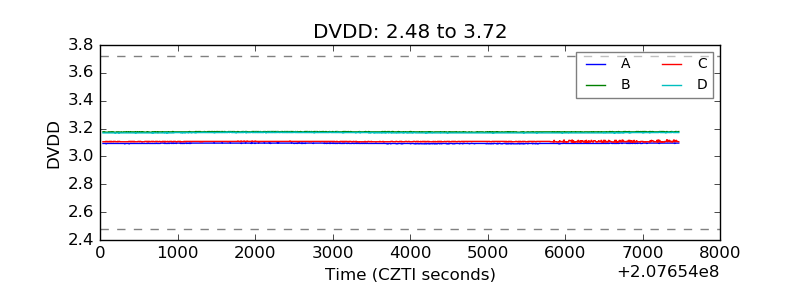 |
| Temperature 1 | 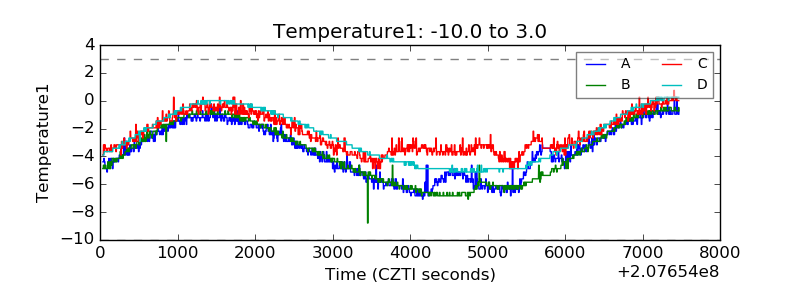 |
| Veto HV Monitor | 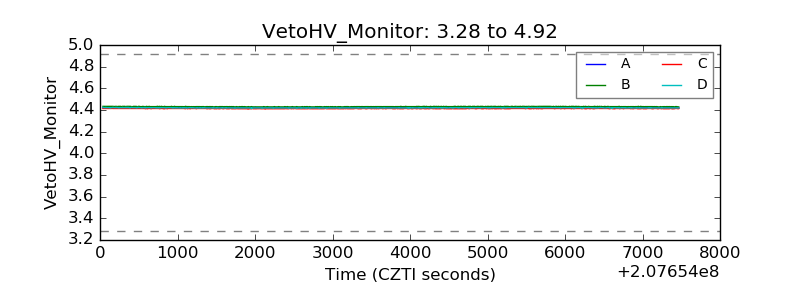 |
| Veto LLD | 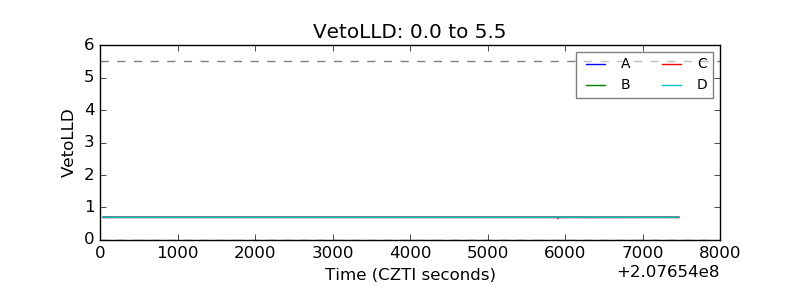 |
| Alpha Counter | 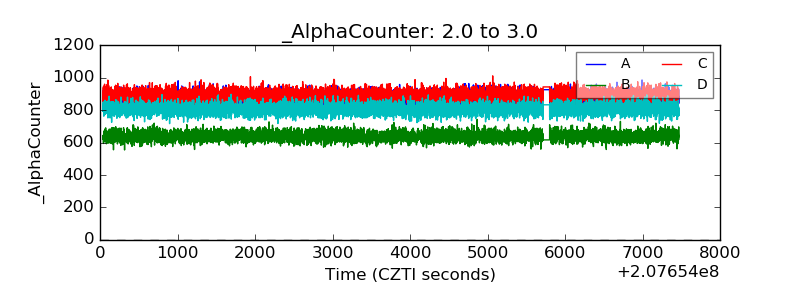 |
| _CPM_Rate | 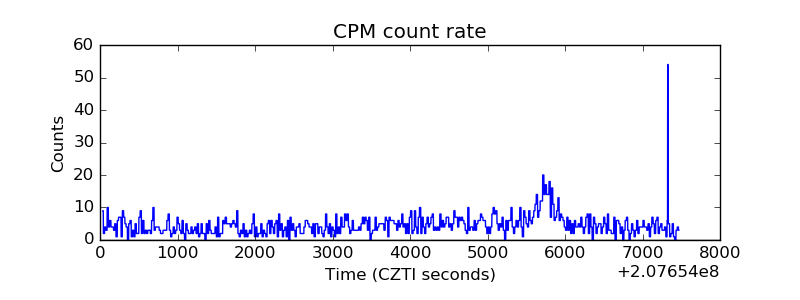 |
| CZT Counter | 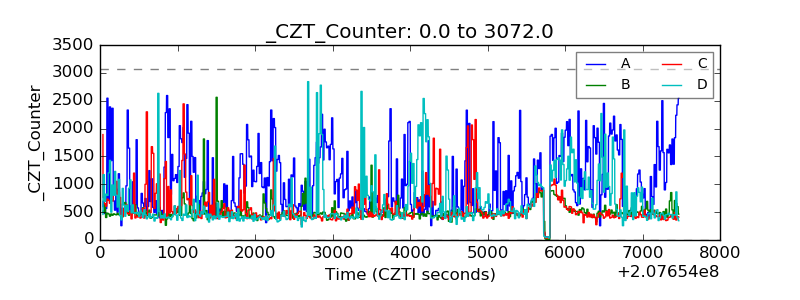 |
| +2.5 Volts monitor |  |
| +5 Volts monitor |  |
| _ROLL_ROT | 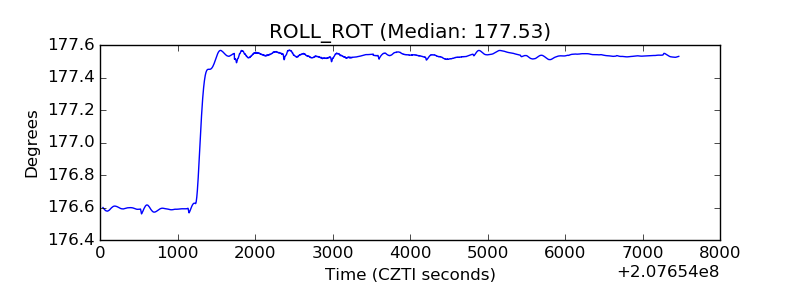 |
| _Roll_DEC | 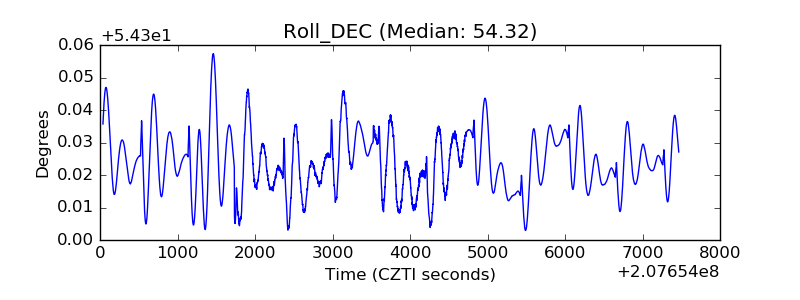 |
| _Roll_RA | 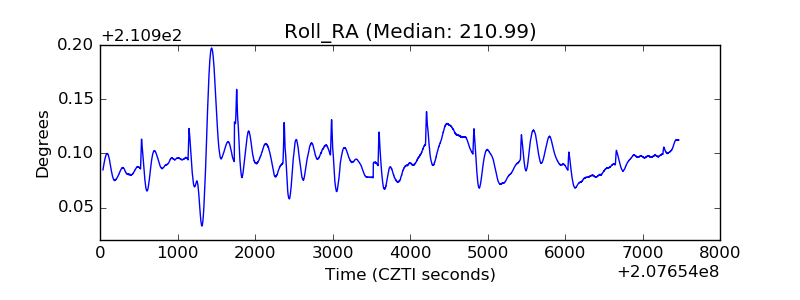 |
| Veto Counter | 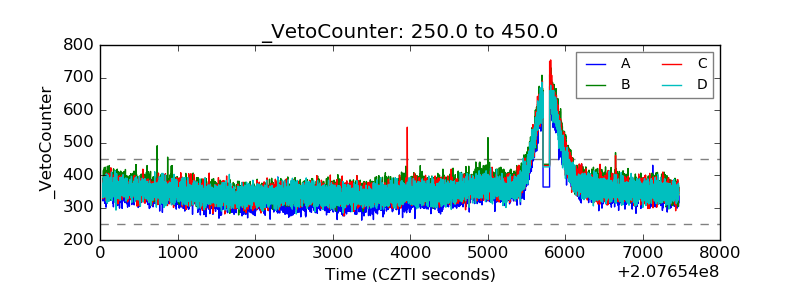 |