| Param | Original file | Final file |
|---|---|---|
| Filename | modeM0/AS1G05_233T10_9000000570_04550cztM0_level2.evt | modeM0/AS1G05_233T10_9000000570_04550cztM0_level2_quad_clean.evt |
| Size (bytes) | 644,365,440 | 86,990,400 |
| Size | 614.5 MB | 83.0 MB |
| Events in quadrant A | 7,679,257 | 450,708 |
| Events in quadrant B | 3,781,016 | 565,429 |
| Events in quadrant C | 3,685,721 | 558,770 |
| Events in quadrant D | 3,868,857 | 545,469 |
| Mode M9 | |||
|---|---|---|---|
| Quadrant | BADHDUFLAG | Total packets | Discarded packets |
| A | 0 | 3 | 0 |
| B | 0 | 3 | 0 |
| C | 0 | 3 | 0 |
| D | 0 | 3 | 0 |
| Mode M0 | |||
|---|---|---|---|
| Quadrant | BADHDUFLAG | Total packets | Discarded packets |
| A | 0 | 27810 | 2 |
| B | 0 | 16096 | 1 |
| C | 0 | 16280 | 1 |
| D | 0 | 16974 | 1 |
| Mode SS | |||
|---|---|---|---|
| Quadrant | BADHDUFLAG | Total packets | Discarded packets |
| A | 0 | 150 | 0 |
| B | 0 | 150 | 0 |
| C | 0 | 150 | 0 |
| D | 0 | 150 | 0 |
| Quadrant | Total seconds | Saturated seconds | Saturation percentage |
|---|---|---|---|
| A | 7366 | 1989 | 27.002444% |
| B | 7366 | 95 | 1.289709% |
| C | 7366 | 78 | 1.058919% |
| D | 7366 | 140 | 1.900624% |
Noise dominated data is calculated using 1-second bins in cleaned event files. If a bin has >2000 counts, and if more than 50% of those come from <1% of pixels, then it is considered to be noise-dominated and hence unusable.
| Quadrant | # 1 sec bins | Bins with >0 counts | Bins with >2000 counts | High rate bins dominated by noise | Noise dominated (total time) | Noise dominated (detector-on time) | Marked lightcurve |
|---|---|---|---|---|---|---|---|
| A | 7610 | 7364 | 1063 | 1063 | 13.97% | 14.44% | 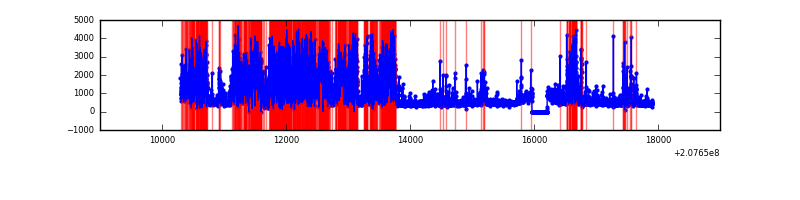 |
| B | 7610 | 7366 | 8 | 8 | 0.11% | 0.11% | 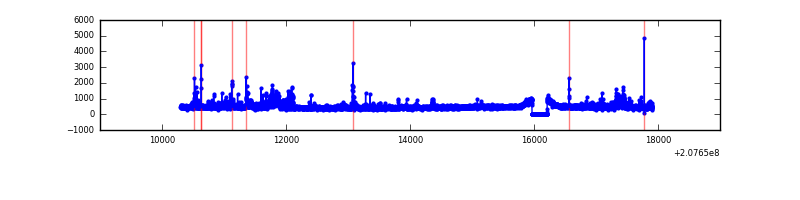 |
| C | 7611 | 7367 | 17 | 17 | 0.22% | 0.23% | 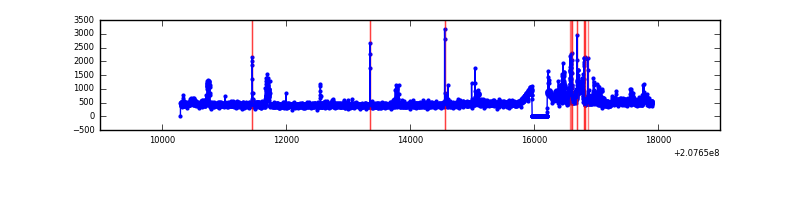 |
| D | 7611 | 7367 | 45 | 45 | 0.59% | 0.61% | 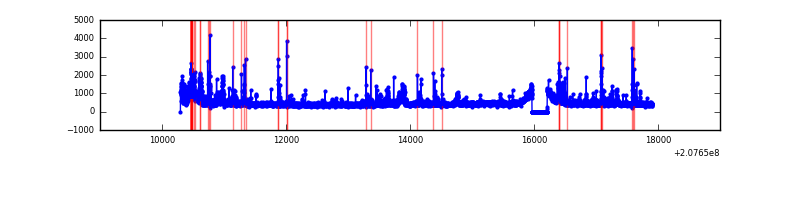 |
Top three noisy pixels from each quadrant. If the there are fewer than three noisy pixels in the level2.evt file, extra rows are filled as -1
| Pixel properties | Quadrant properties | ||||||
|---|---|---|---|---|---|---|---|
| Quadrant | DetID | PixID | Counts | Sigma | Mean | Median | Sigma |
| A | 0 | 13 | 4357680 | 28601.69 | 730 | 713 | 152.3 |
| A | 0 | 118 | 321955 | 2108.82 | 730 | 713 | 152.3 |
| A | 15 | 234 | 59509 | 385.97 | 730 | 713 | 152.3 |
| B | 8 | 3 | 199974 | 1224.58 | 846 | 825 | 162.6 |
| B | 15 | 54 | 90216 | 549.67 | 846 | 825 | 162.6 |
| B | 4 | 80 | 81685 | 497.21 | 846 | 825 | 162.6 |
| C | 14 | 48 | 290781 | 1523.71 | 816 | 818 | 190.3 |
| C | 9 | 247 | 185374 | 969.81 | 816 | 818 | 190.3 |
| C | 8 | 128 | 8489 | 40.31 | 816 | 818 | 190.3 |
| D | 9 | 35 | 427744 | 2140.45 | 818 | 793 | 199.5 |
| D | 13 | 235 | 159909 | 797.7 | 818 | 793 | 199.5 |
| D | 2 | 136 | 81990 | 407.07 | 818 | 793 | 199.5 |
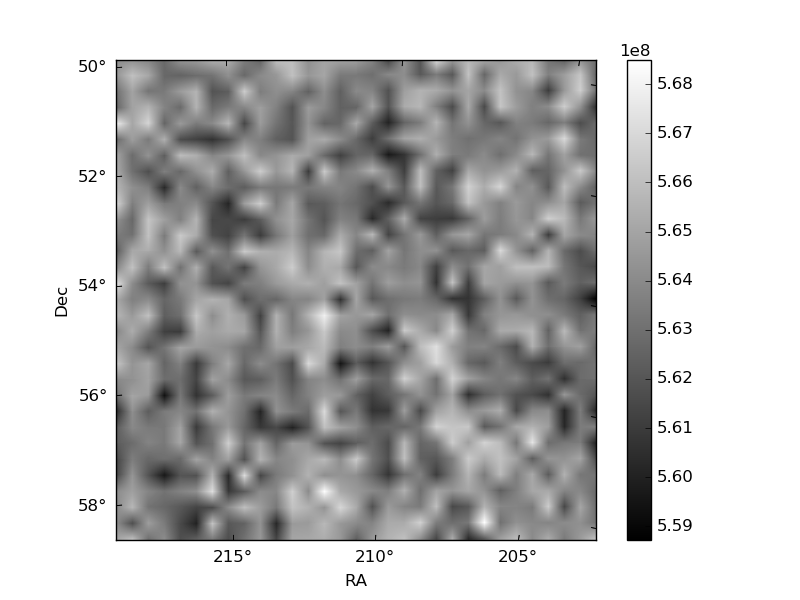
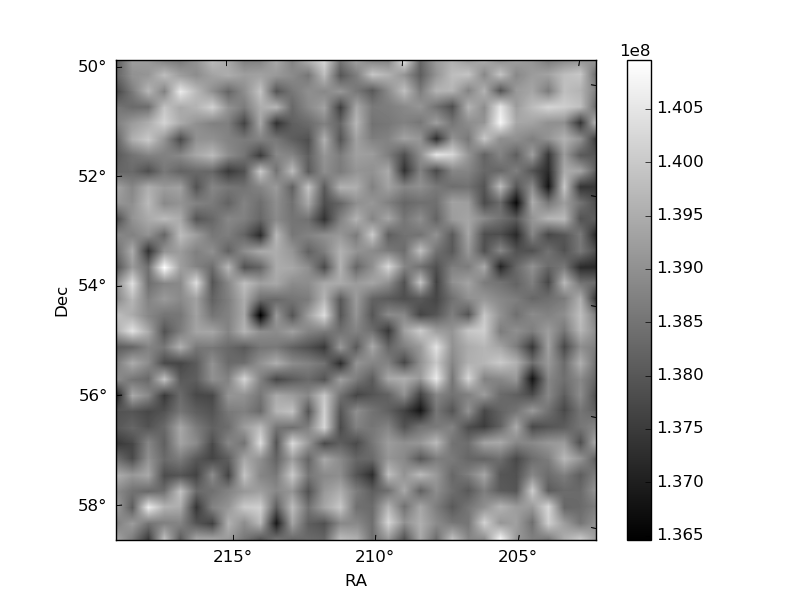
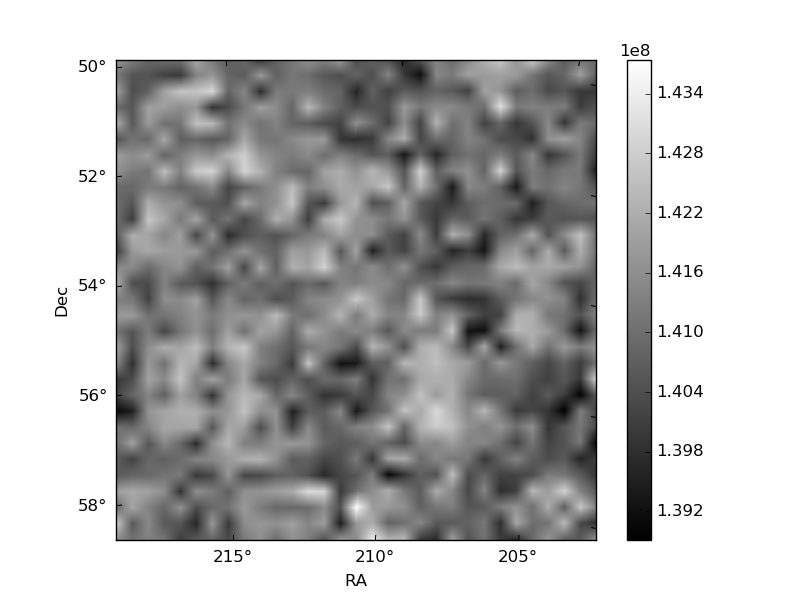
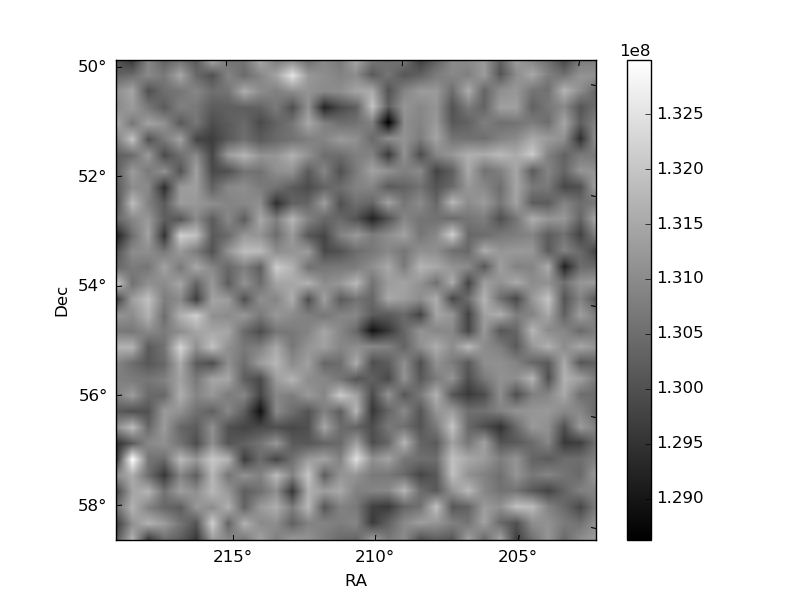
Histogram calculated using DETX and DETY for each event in the final _common_clean file
| Quadrant A | 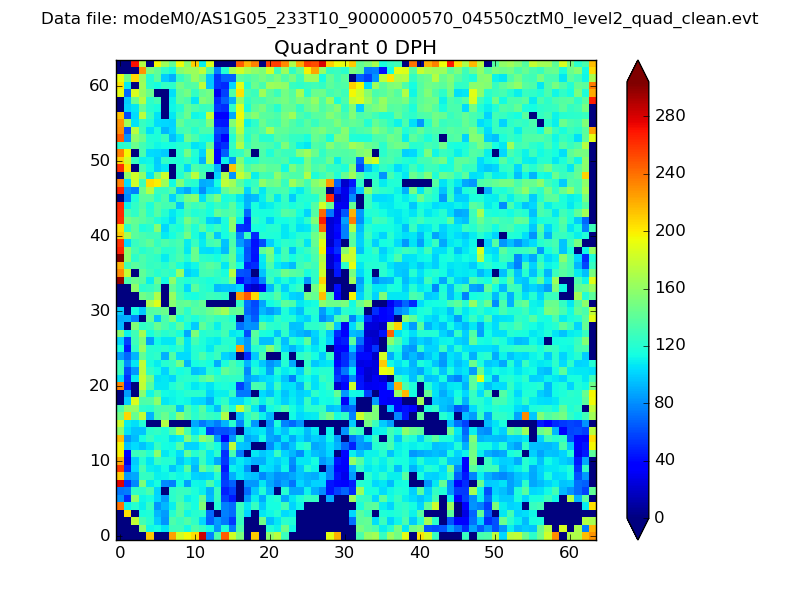 |
 |
Quadrant B |
|---|---|---|---|
| Quadrant D | 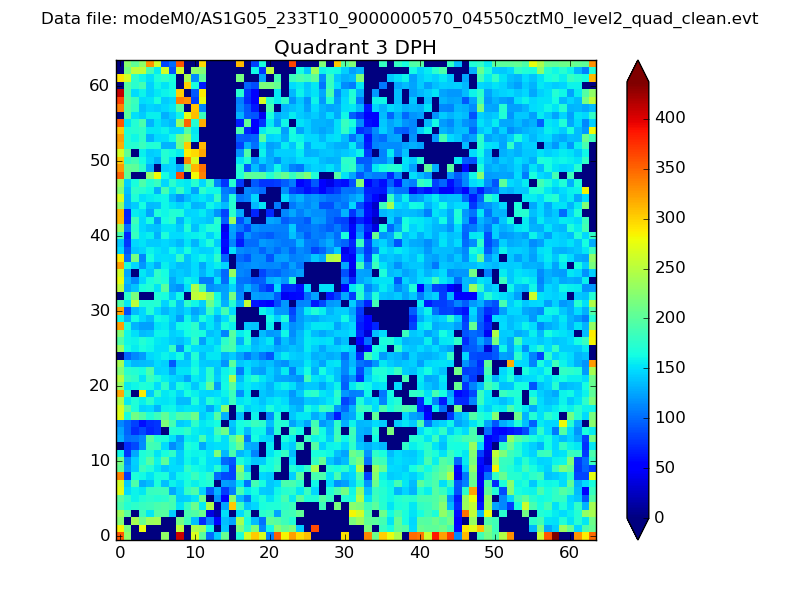 |
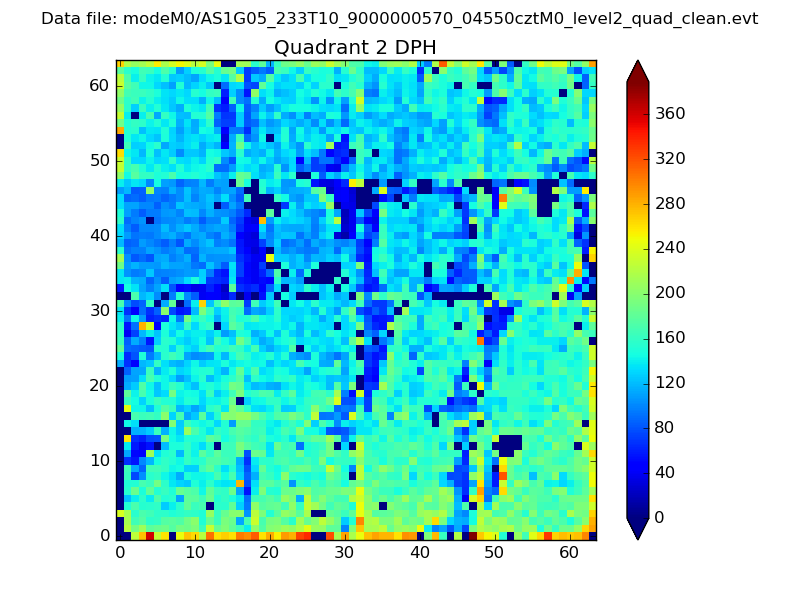 |
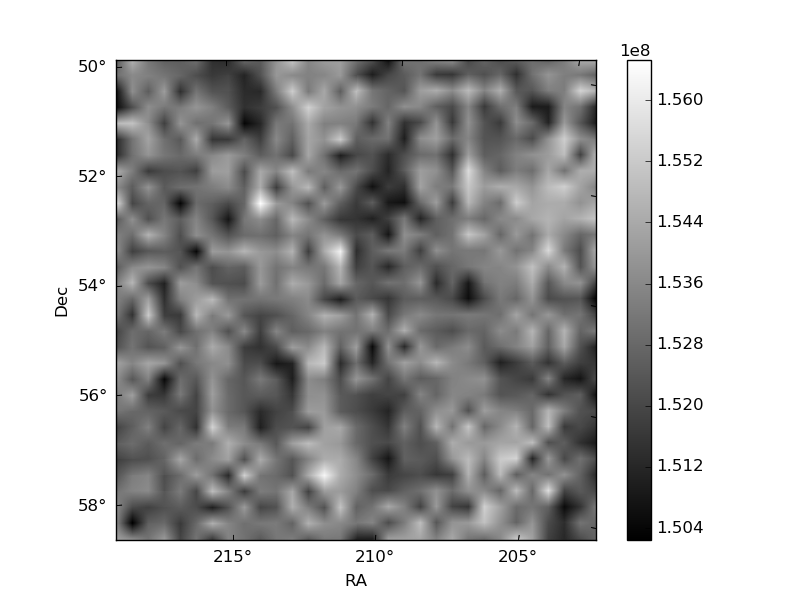
Quadrant C |
| Plot type | Count rate plots | Images |
|---|---|---|
| Comparison with Poisson distribution Blue bars denote a histogram of data divided into 1 sec bins. Red curve is a Poisson curve with rate = median count rate of data. |
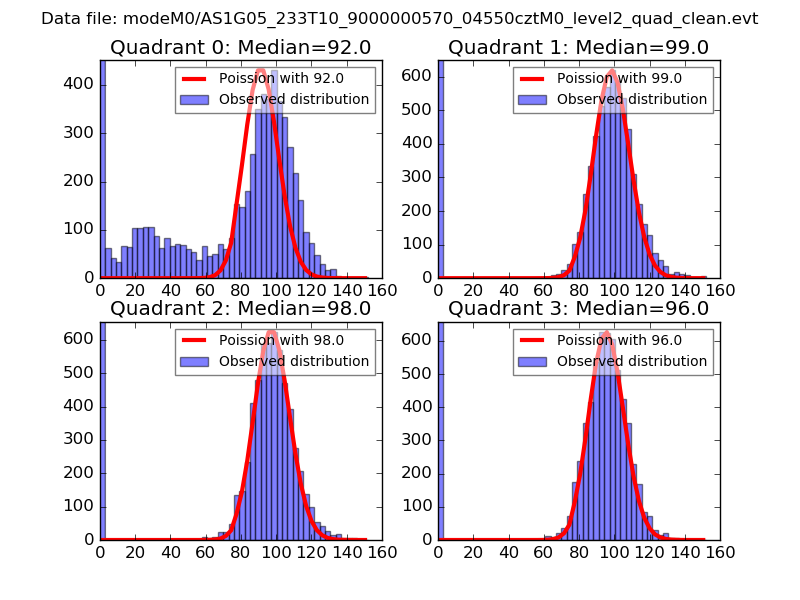 |
 |
| Quadrant-wise count rates Data is divided into 100 sec bins |
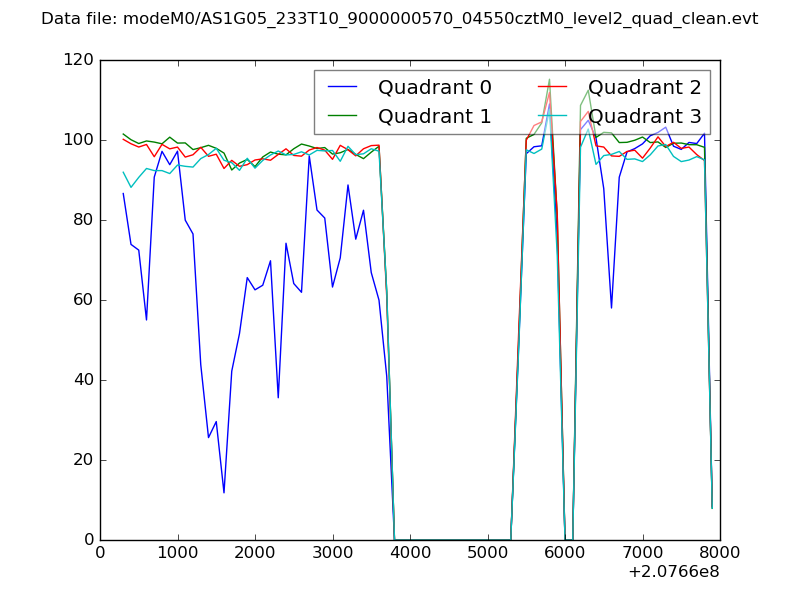 |
|
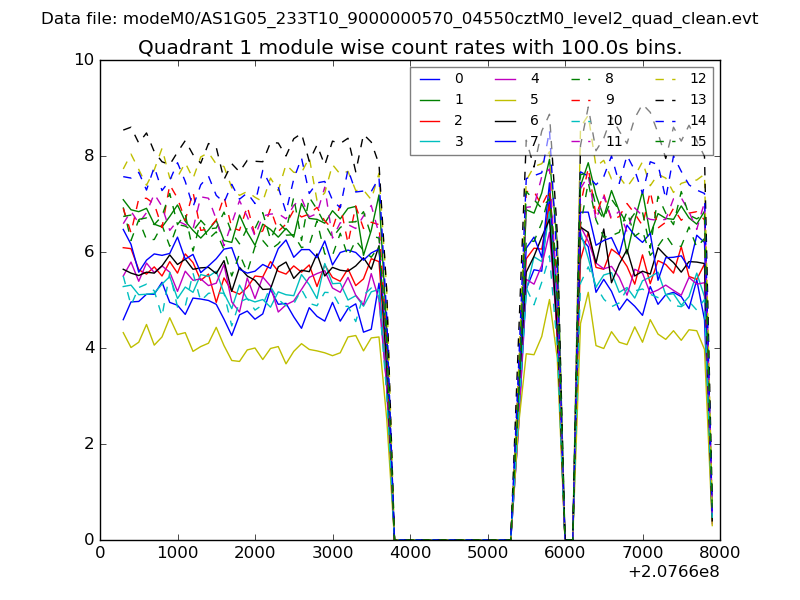
| Module-wise count rates for Quadrant A Data is divided into 100 sec bins |
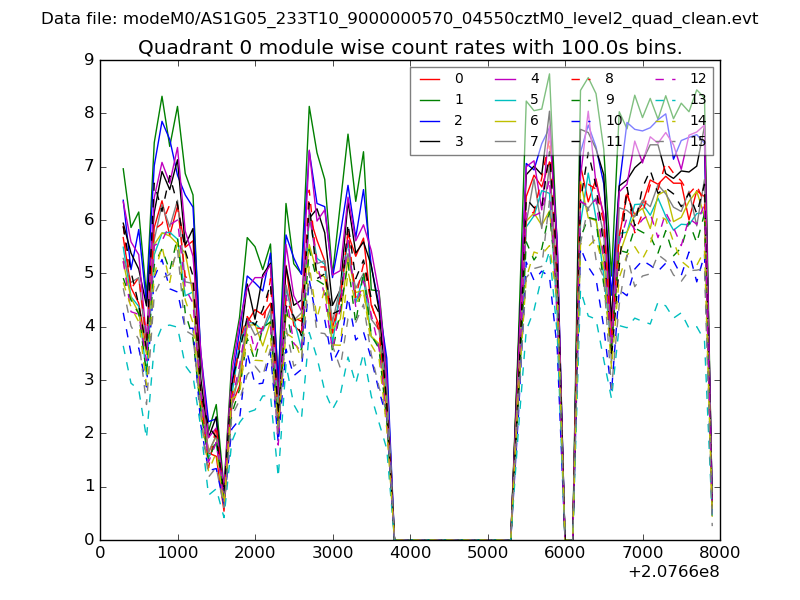 |
 |
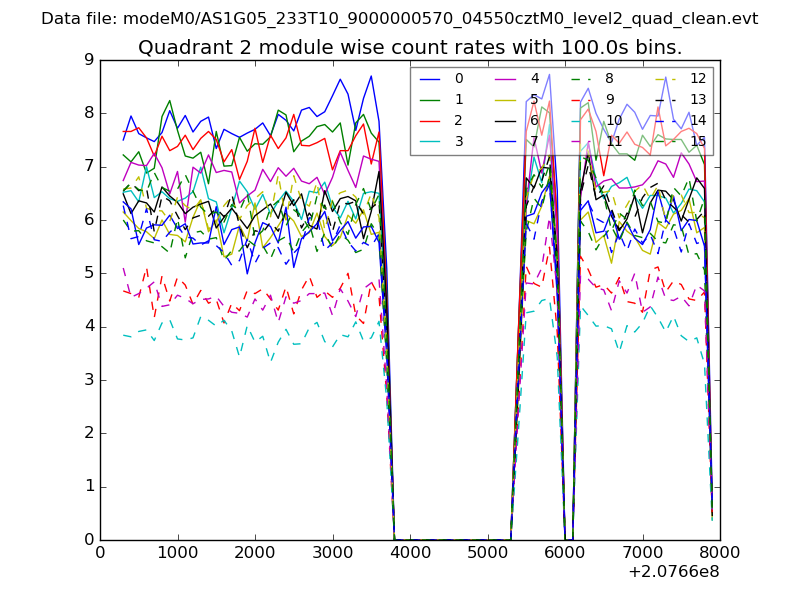
| Module-wise count rates for Quadrant B Data is divided into 100 sec bins |
 |
 |
| Module-wise count rates for Quadrant C Data is divided into 100 sec bins |
 |
 |
| Module-wise count rates for Quadrant D Data is divided into 100 sec bins |
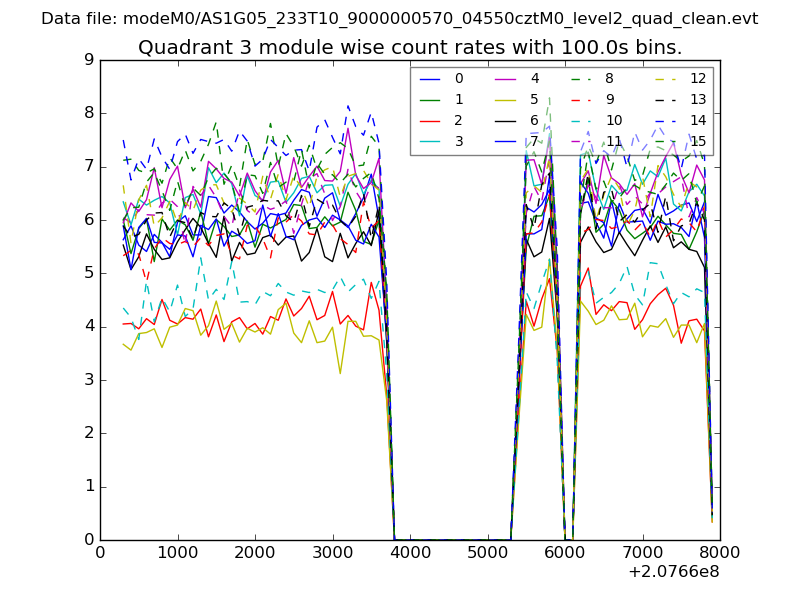 |
 |
| Parameter | Plot |
|---|---|
| CZT HV Monitor | 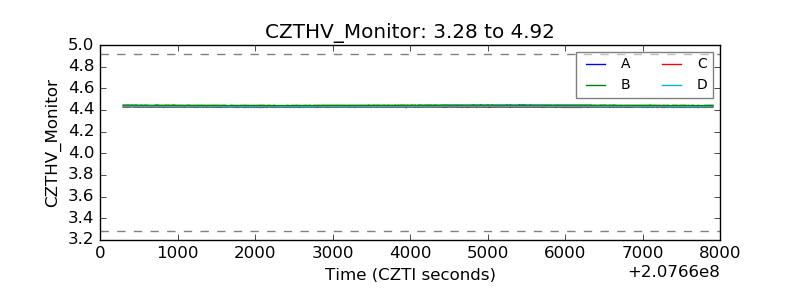 |
| D_VDD | 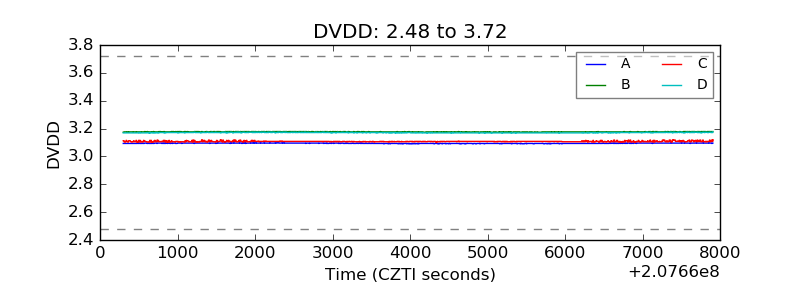 |
| Temperature 1 | 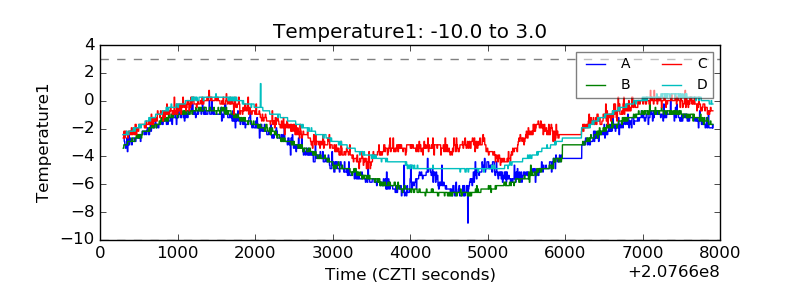 |
| Veto HV Monitor | 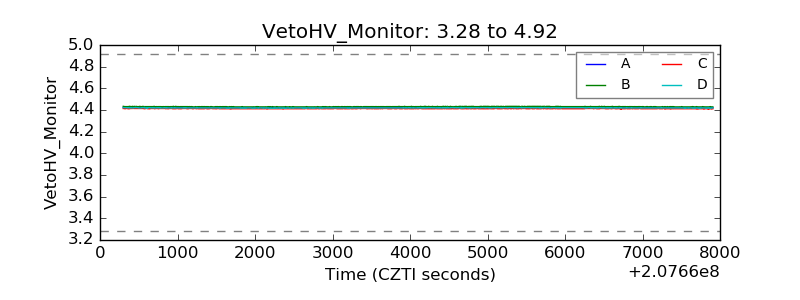 |
| Veto LLD | 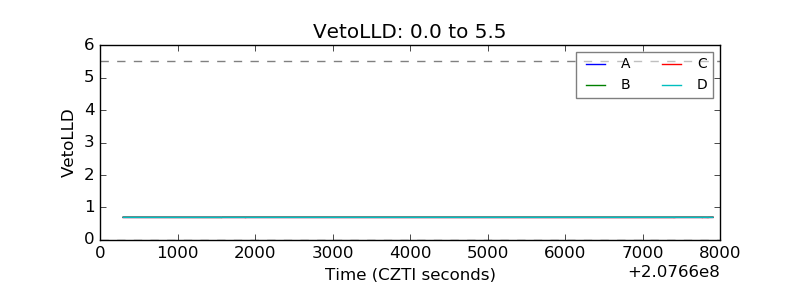 |
| Alpha Counter | 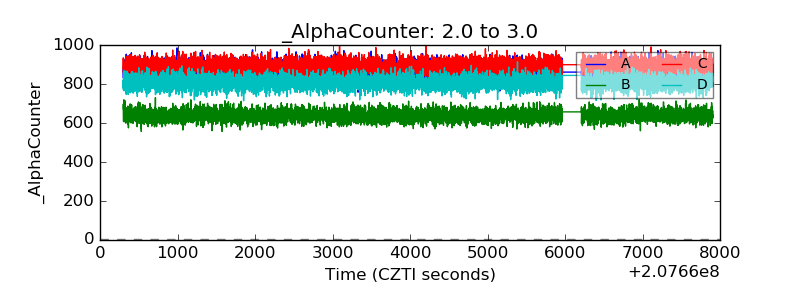 |
| _CPM_Rate | 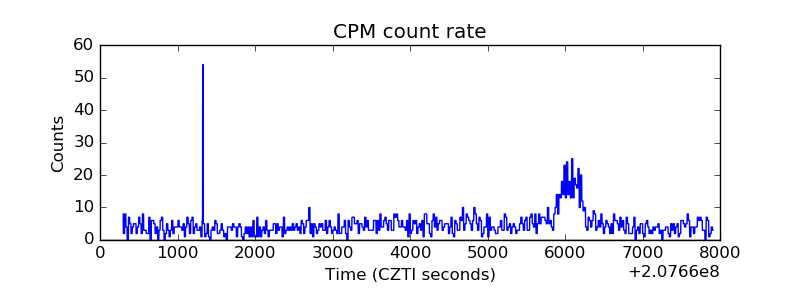 |
| CZT Counter | 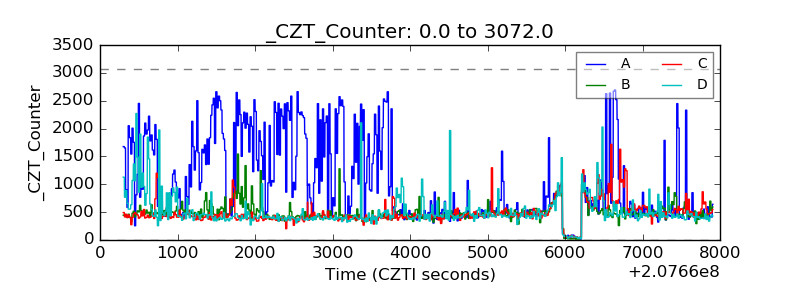 |
| +2.5 Volts monitor |  |
| +5 Volts monitor |  |
| _ROLL_ROT | 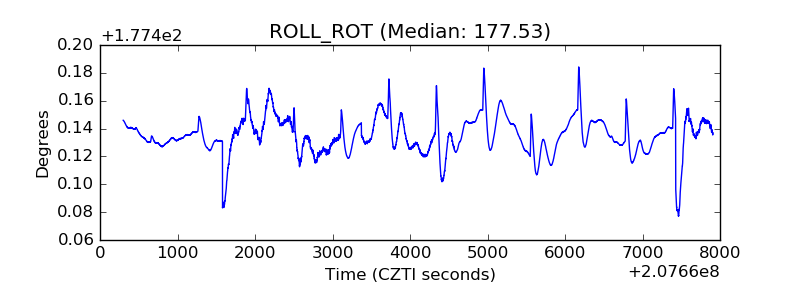 |
| _Roll_DEC | 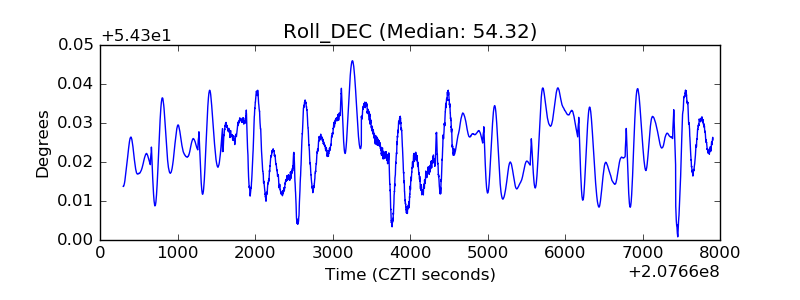 |
| _Roll_RA | 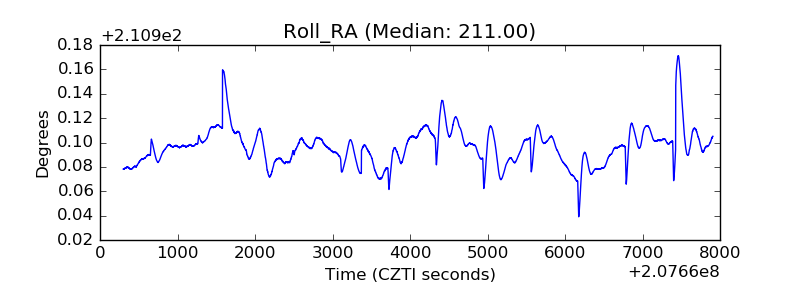 |
| Veto Counter | 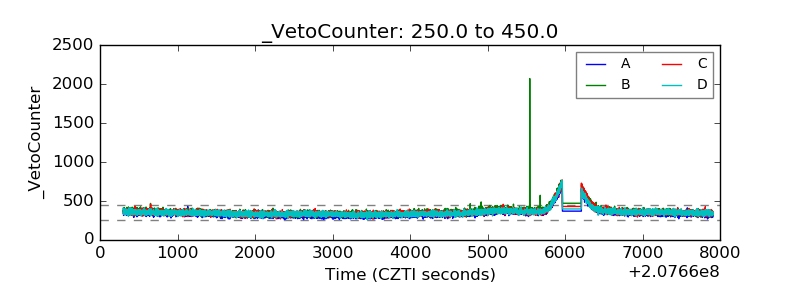 |