| Param | Original file | Final file |
|---|---|---|
| Filename | modeM0/AS1G05_233T10_9000000570_04553cztM0_level2.evt | modeM0/AS1G05_233T10_9000000570_04553cztM0_level2_quad_clean.evt |
| Size (bytes) | 14,319,360 | 3,741,120 |
| Size | 13.7 MB | 3.6 MB |
| Events in quadrant A | 128,242 | 21,818 |
| Events in quadrant B | 119,133 | 25,943 |
| Events in quadrant C | 117,735 | 25,899 |
| Events in quadrant D | 43,490 | 9,040 |
| Mode M9 | |||
|---|---|---|---|
| Quadrant | BADHDUFLAG | Total packets | Discarded packets |
| A | 0 | 11 | 0 |
| B | 0 | 19 | 11 |
| C | 0 | 11 | 0 |
| D | 0 | 19 | 11 |
| Mode M0 | |||
|---|---|---|---|
| Quadrant | BADHDUFLAG | Total packets | Discarded packets |
| A | 0 | 33011 | 32443 |
| B | 0 | 31556 | 31036 |
| C | 0 | 34817 | 34305 |
| D | 0 | 37726 | 37543 |
| Mode SS | |||
|---|---|---|---|
| Quadrant | BADHDUFLAG | Total packets | Discarded packets |
| A | 0 | 305 | 254 |
| B | 0 | 305 | 254 |
| C | 0 | 305 | 250 |
| D | 0 | 305 | 254 |
| Quadrant | Total seconds | Saturated seconds | Saturation percentage |
|---|---|---|---|
| A | 284 | 0 | 0.000000% |
| B | 261 | 2 | 0.766284% |
| C | 256 | 0 | 0.000000% |
| D | 94 | 1 | 1.063830% |
Noise dominated data is calculated using 1-second bins in cleaned event files. If a bin has >2000 counts, and if more than 50% of those come from <1% of pixels, then it is considered to be noise-dominated and hence unusable.
| Quadrant | # 1 sec bins | Bins with >0 counts | Bins with >2000 counts | High rate bins dominated by noise | Noise dominated (total time) | Noise dominated (detector-on time) | Marked lightcurve |
|---|---|---|---|---|---|---|---|
| A | 6915 | 568 | 0 | 0 | 0.00% | 0.00% | 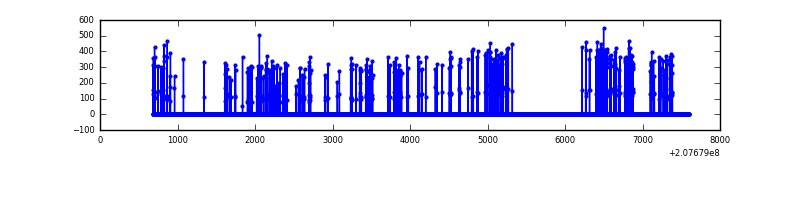 |
| B | 6915 | 518 | 0 | 0 | 0.00% | 0.00% | 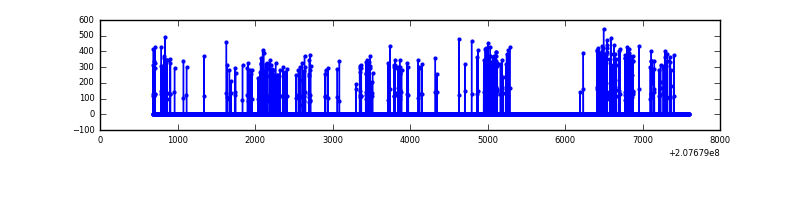 |
| C | 6914 | 509 | 0 | 0 | 0.00% | 0.00% | 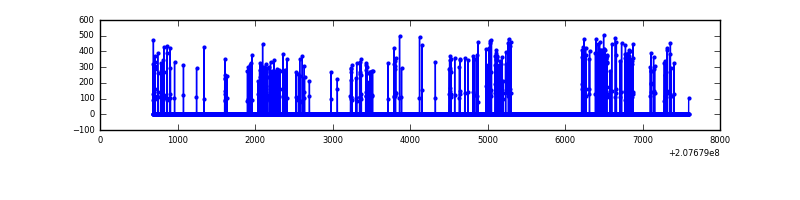 |
| D | 6663 | 183 | 0 | 0 | 0.00% | 0.00% | 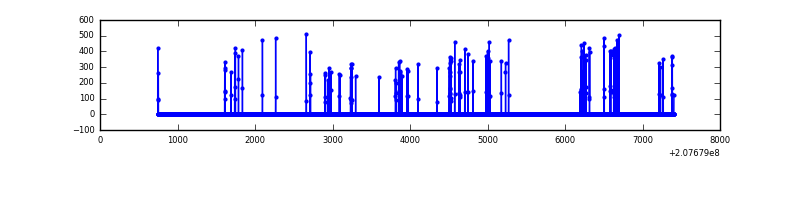 |
Top three noisy pixels from each quadrant. If the there are fewer than three noisy pixels in the level2.evt file, extra rows are filled as -1
| Pixel properties | Quadrant properties | ||||||
|---|---|---|---|---|---|---|---|
| Quadrant | DetID | PixID | Counts | Sigma | Mean | Median | Sigma |
| A | 13 | 14 | 1280 | 143.02 | 32 | 31 | 8.7 |
| A | 7 | 16 | 520 | 55.99 | 32 | 31 | 8.7 |
| A | 8 | 15 | 351 | 36.64 | 32 | 31 | 8.7 |
| B | 4 | 80 | 1436 | 179.36 | 29 | 28 | 7.9 |
| B | 0 | 183 | 1014 | 125.6 | 29 | 28 | 7.9 |
| B | 4 | 48 | 754 | 92.48 | 29 | 28 | 7.9 |
| C | 14 | 48 | 4006 | 470.83 | 28 | 28 | 8.4 |
| C | 8 | 128 | 379 | 41.54 | 28 | 28 | 8.4 |
| C | 13 | 61 | 239 | 24.97 | 28 | 28 | 8.4 |
| D | 13 | 25 | 1436 | 346.3 | 10 | 9 | 4.1 |
| D | 1 | 20 | 1190 | 286.6 | 10 | 9 | 4.1 |
| D | 2 | 136 | 592 | 141.48 | 10 | 9 | 4.1 |
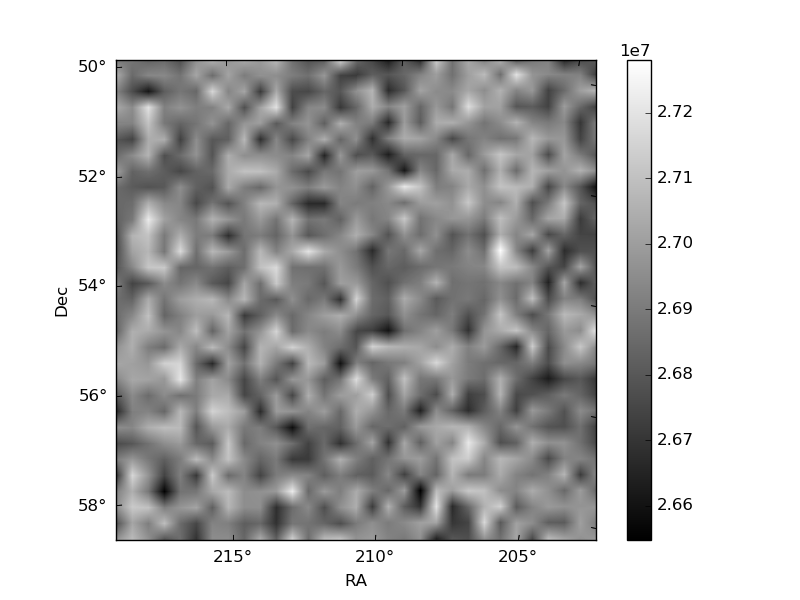
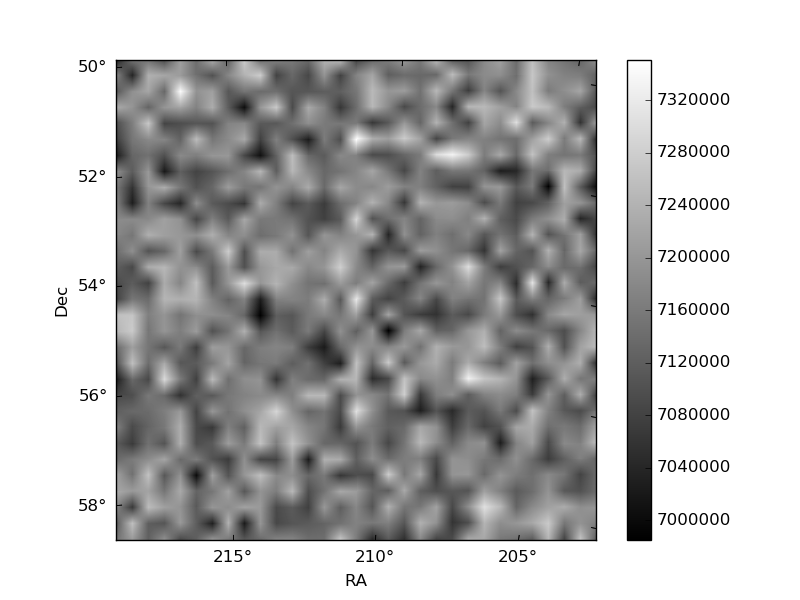
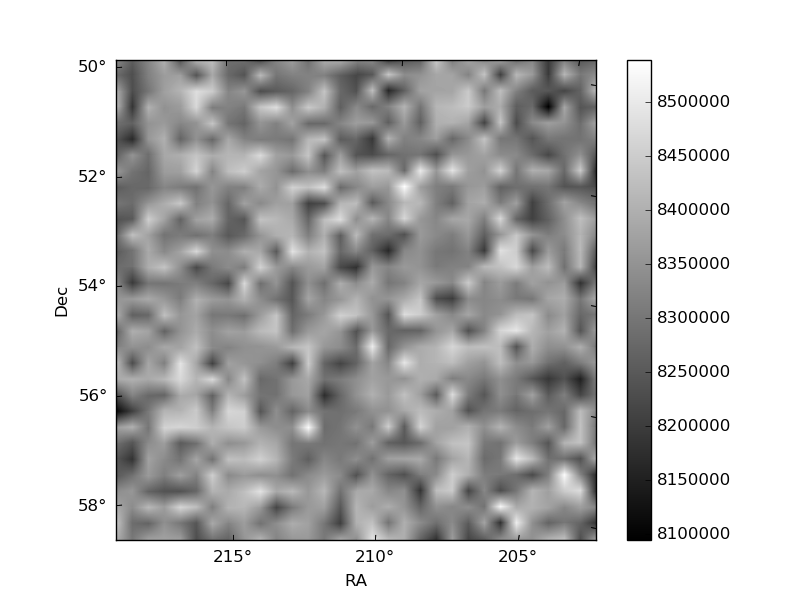
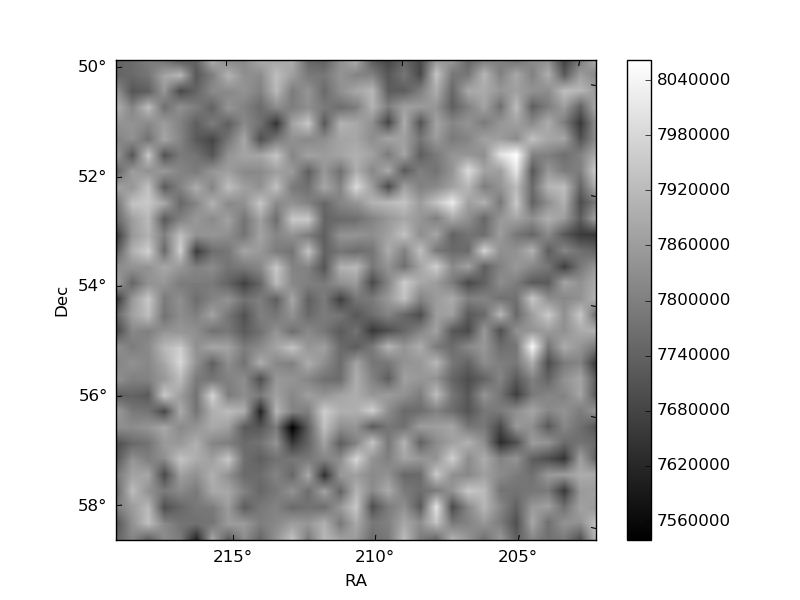
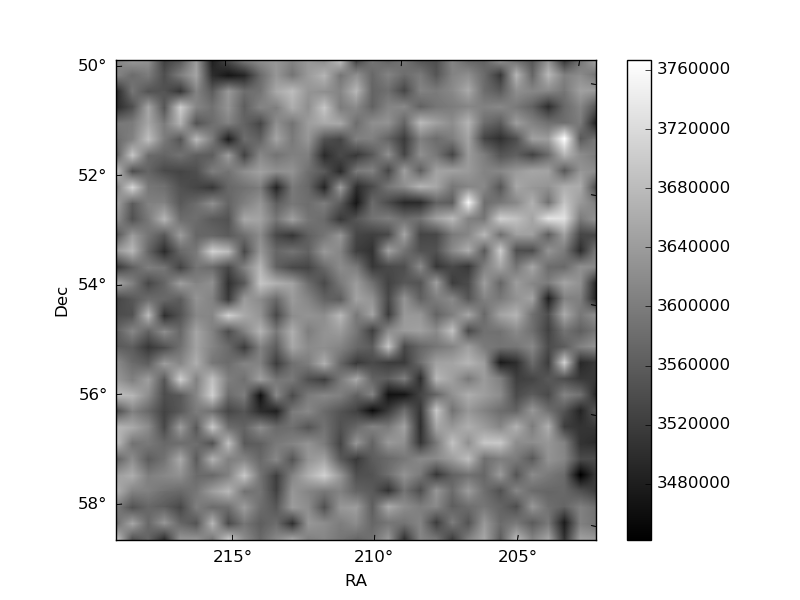
Histogram calculated using DETX and DETY for each event in the final _common_clean file
| Quadrant A | 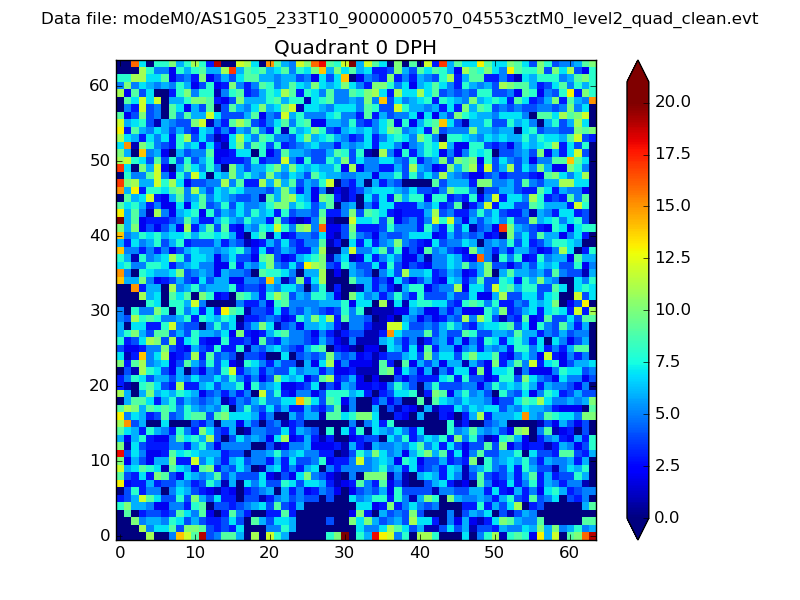 |
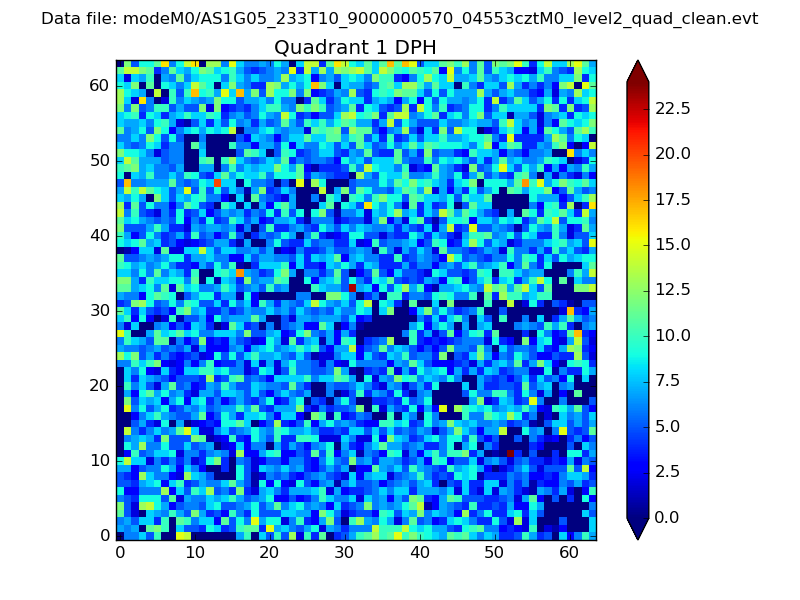 |
Quadrant B |
|---|---|---|---|
| Quadrant D | 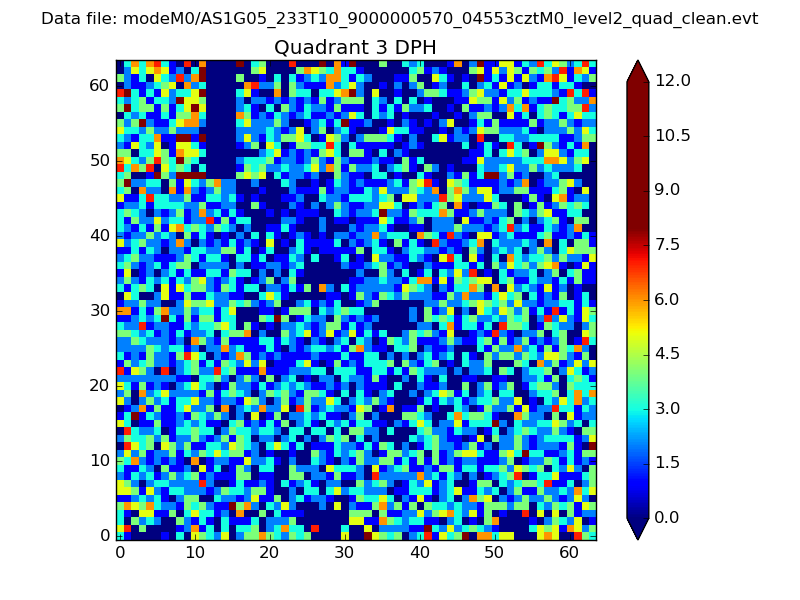 |
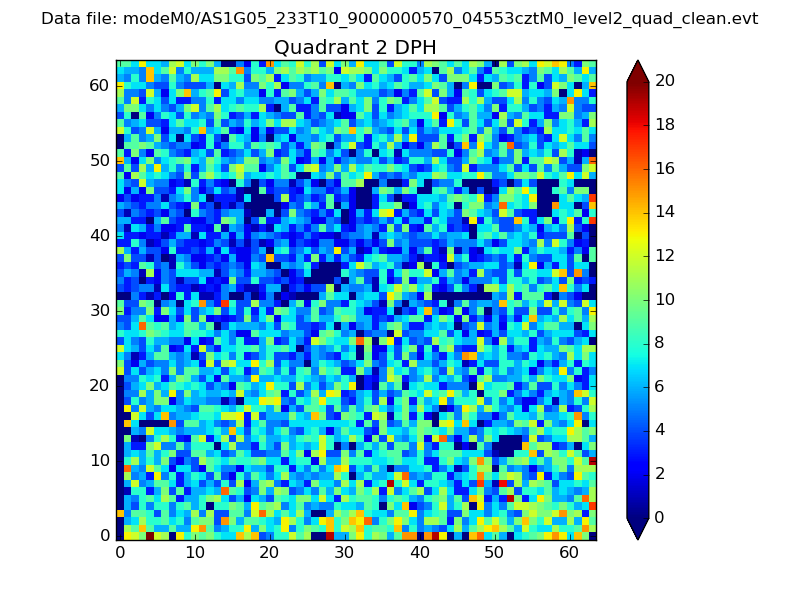 |
Quadrant C |
| Plot type | Count rate plots | Images |
|---|---|---|
| Comparison with Poisson distribution Blue bars denote a histogram of data divided into 1 sec bins. Red curve is a Poisson curve with rate = median count rate of data. |
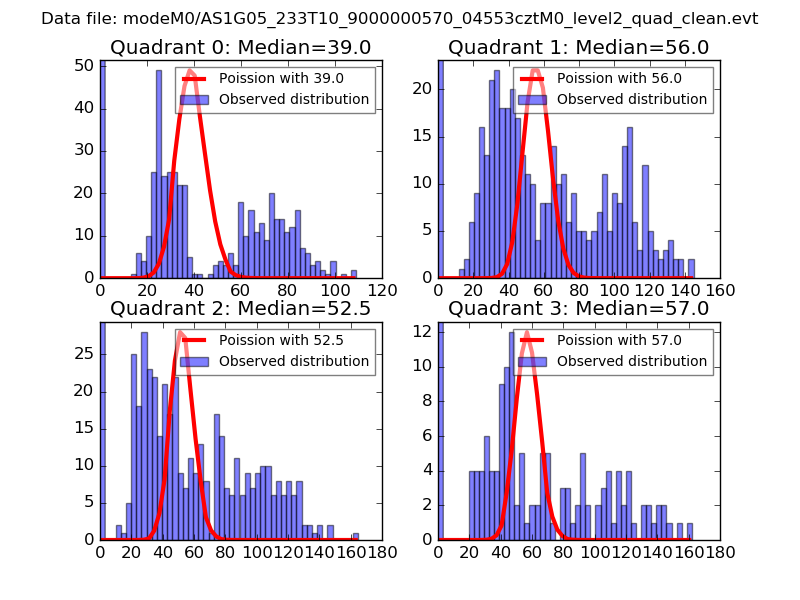 |
 |
| Quadrant-wise count rates Data is divided into 100 sec bins |
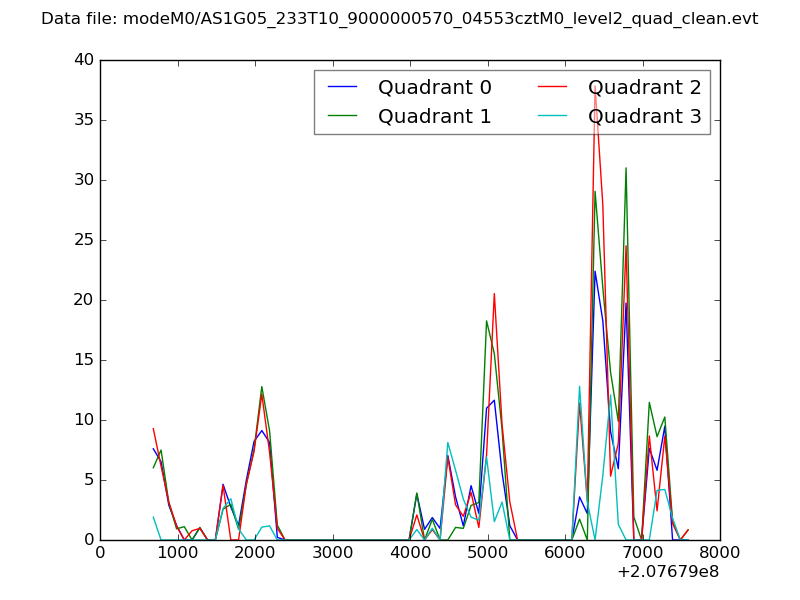 |
|
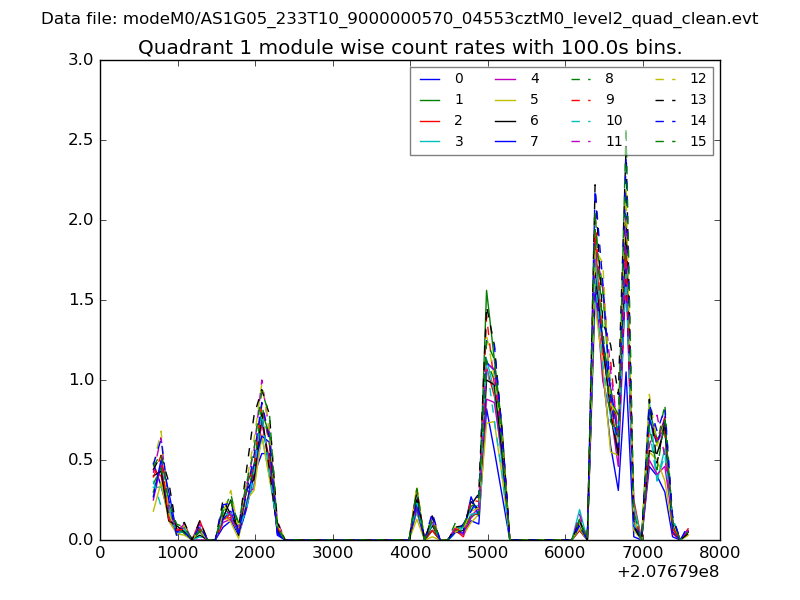
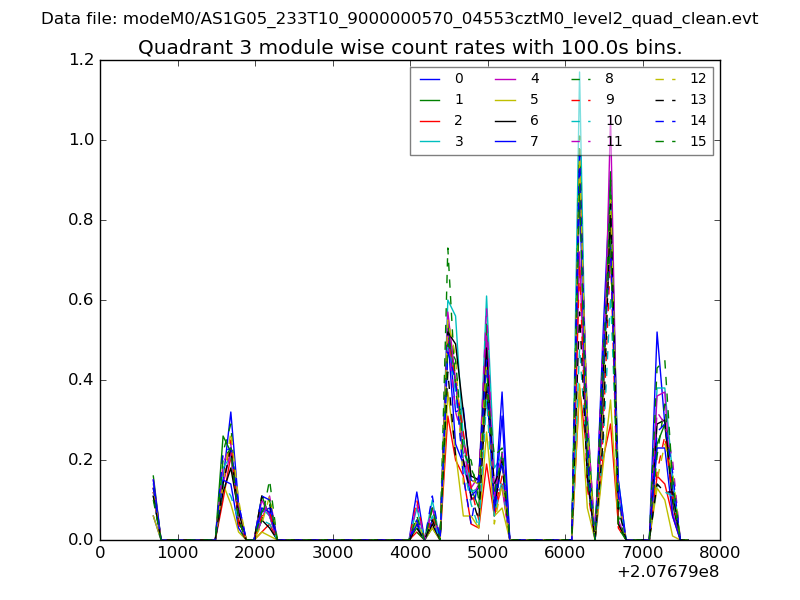
| Module-wise count rates for Quadrant A Data is divided into 100 sec bins |
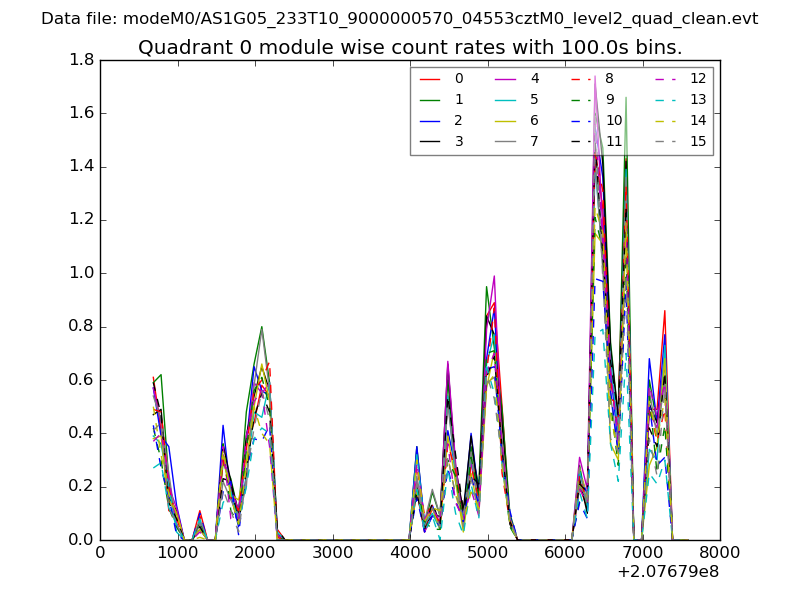 |
 |
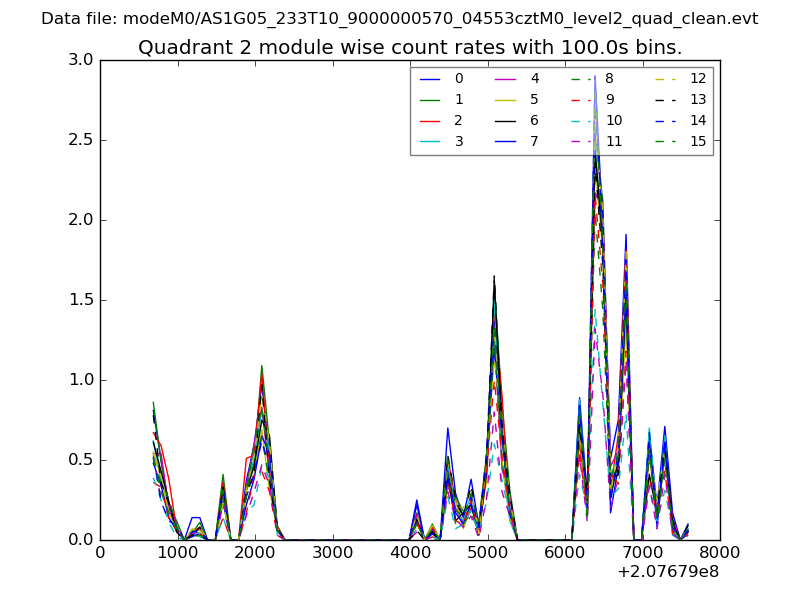
| Module-wise count rates for Quadrant B Data is divided into 100 sec bins |
 |
 |
| Module-wise count rates for Quadrant C Data is divided into 100 sec bins |
 |
 |
| Module-wise count rates for Quadrant D Data is divided into 100 sec bins |
 |
 |
| Parameter | Plot |
|---|---|
| CZT HV Monitor | 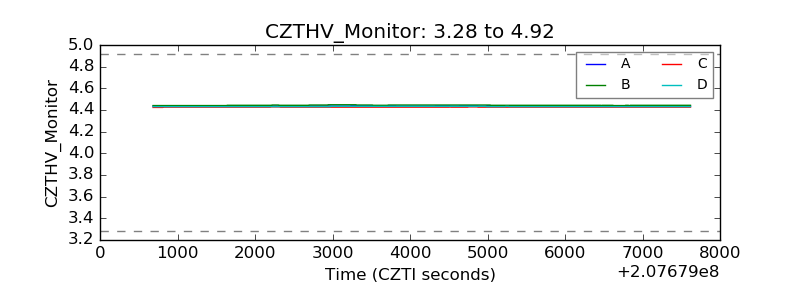 |
| D_VDD | 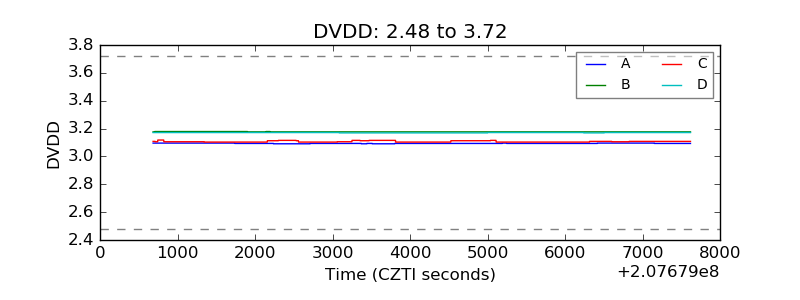 |
| Temperature 1 | 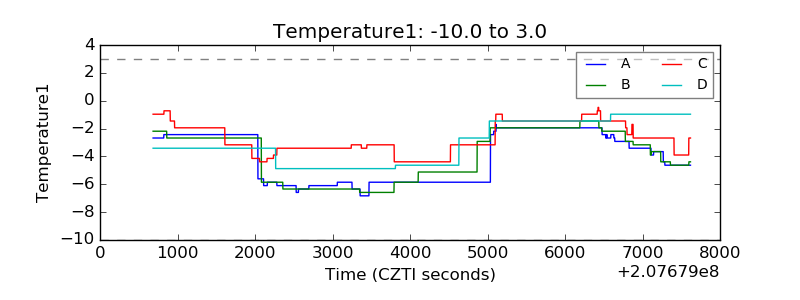 |
| Veto HV Monitor | 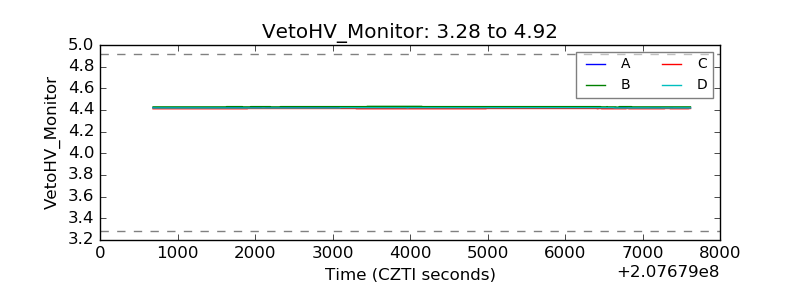 |
| Veto LLD | 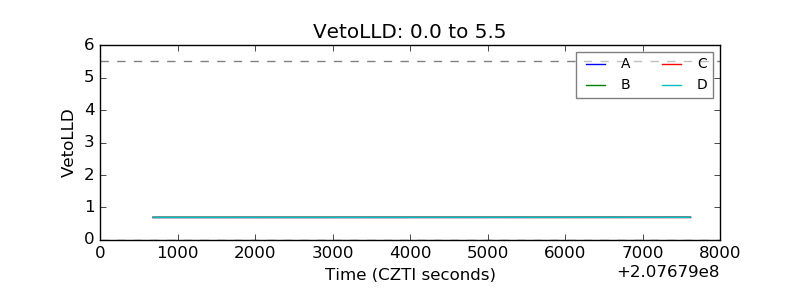 |
| Alpha Counter | 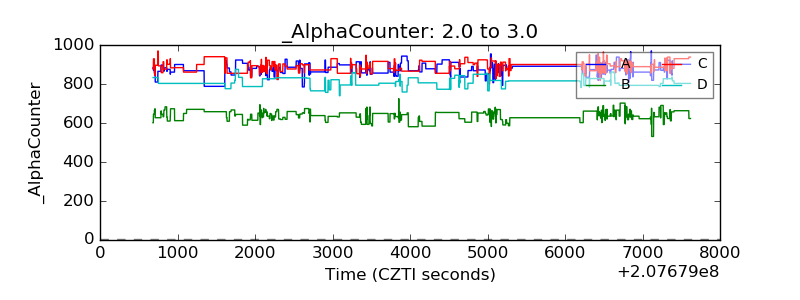 |
| _CPM_Rate | 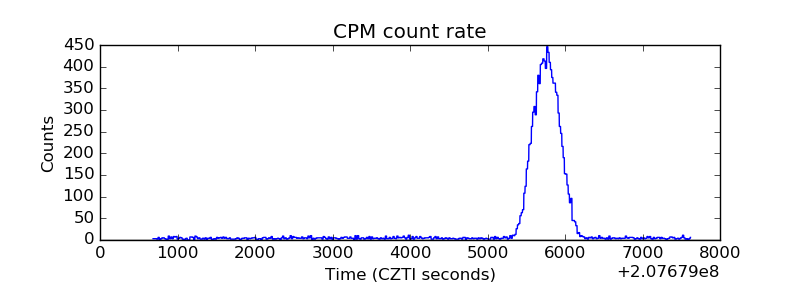 |
| CZT Counter | 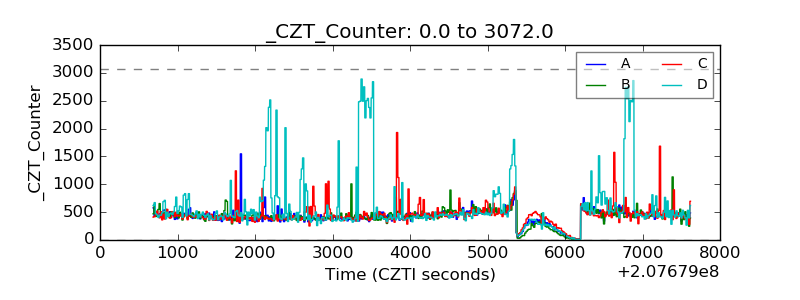 |
| +2.5 Volts monitor |  |
| +5 Volts monitor |  |
| _ROLL_ROT | 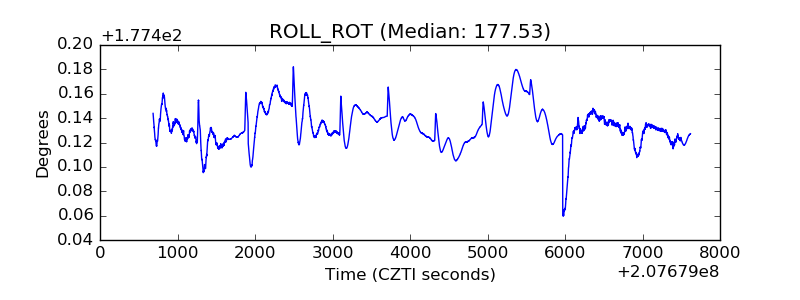 |
| _Roll_DEC | 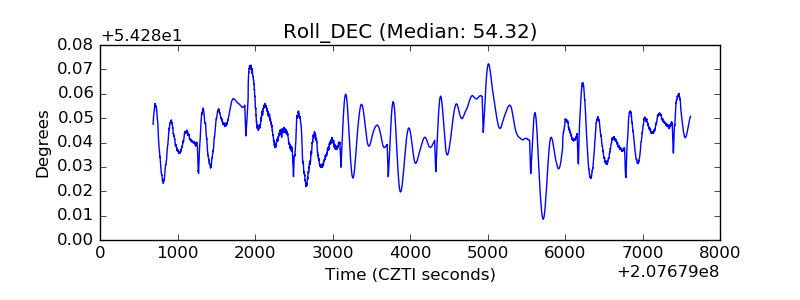 |
| _Roll_RA | 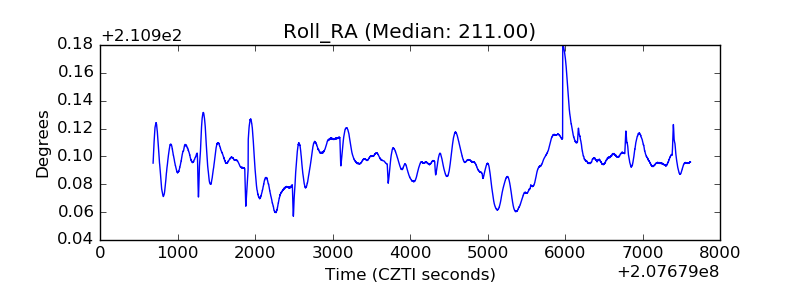 |
| Veto Counter | 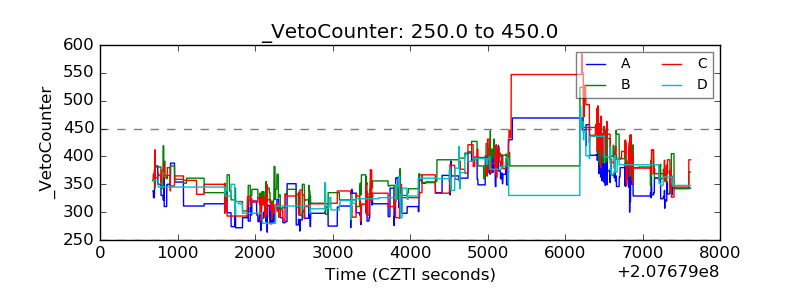 |